
Social Progress Component and Indicators: A Principal Component Analysis
- Rodin M. Paspasan
- 1305-1313
- Mar 21, 2025
- Education
Social Progress Component and Indicators: A Principal Component Analysis
Rodin M. Paspasan, Rme, Ph.D.
Cebu Normal University
DOI: https://dx.doi.org/10.47772/IJRISS.2025.903SEDU0101
Received: 12 February 2025; Accepted: 16 February 2025; Published: 21 March 2025
ABSTRACT
Economic growth has brought hundreds of millions of people out of poverty and improved the lives of many more in the last half-century. A society that fails to address basic human needs, imbues citizens to improve their quality of life, helps protect the environment and provides an opportunity for many of its citizens is ineffective. The Social Progress Index provides a practical tool for government and business leaders to benchmark country performance and to prioritize those areas where social improvement is most needed. It is the most comprehensive framework developed to measure social progress and the first to measure social progress independently of GDP. Thus, from an ideal point of view, the index of social progress should reflect GDP. The main variables identified in the system show the various inter-relationships that exist between them. The aim of this paper is to identify the key social progress indicators of the selected countries for the year 2018, which has a leading social progress index. Measuring social progress ahead of long-established economic measures such as Basic Human Needs reveals that some of the country’s social progress index of life is building up internationally but wear off in personal rights. Hence, Social progress consequently continues to call for the renouncement of personal rights. You should bestow your personal rights to the great benefit of the wider public.
Keywords: social progress index, principal component analysis, social progress indicators, emergent theory
INTRODUCTION
Over the past-century, economic growth has brought hundreds of millions of people out of poverty and strengthened many more lives. Indeed, it becomes increasingly evident that a human development model based primarily on economic progress is incomplete. It is not a healthy society that does not address basic human needs, equip citizens to improve their quality of life, protect the environment, and provide avenues for many of its citizens.
Accordingly, the two schools of thought that have long debated societal advancement are modernization theory and dependency theory (Kim 2008). The modernization hypothesis has highlighted the critical role that people’s attitudes, particularly those of the local elites, have had in the advancement of cultures that are still in the stone age. The underlying presumption was that developing nations should emulate modernity, which is exemplified by the structural traits of Western European and American nations.
Social progress is a complicated process that cannot be reduced to one or two. Quality of life (QOL) issues include “the economic” and “the political.” The paradigm, offered as an alternative measure of GDP, is based on the belief that many signs and indices of individual life will reflect the well-being of people, and summarize the qualitative component of social progress. (Sen 1999; Anand, Santos, & Smith 2009).
The Social Progress Index (SPI) provides a quantitative tool to benchmark country performance for government and business leaders and prioritize those areas where social development is most essential. It is the most systematic methodology developed to measure social progress, and the first to independently quantify social progress across GDP. And It is also a well-established indicator that has been published since 2013 to catalyze change and drive action through the effective and accurate presentation of social outcome information.
SPI’s multiple dimensions can be used to assess performance and provide a holistic, consistent, result-based measure of the well-being of a country that is independent of economic indicators. Additionally, it can be used by legislators, industries and citizens of countries alike to evaluate their country to others on different facets of social progress, allowing specific areas of strength or weakness to be established.
The significant economic change often hinders economic growth in these and other countrijes that fail to meet human needs, build social capital, and create an opportunity for their inhabitants. Thus, this paper aims to establish a theory on how the indicators selected induce the country’s social progress.
Theoretical-Conceptual – Framework
Altruism is the unselfish consideration for other people; doing things simply out of a desire to help, not out of obligation, patriotism, or spiritual reasons. Everyday life is filled with small acts of altruism, from the hotel guard who kindly keeps the door open to the woman who gives food to a homeless man as you walk in from the parking area.
The term altruism was coined by Auguste Comte in 1851 by combining the Latin word “alter” which means “to other” and its Italian adjective “Altru”. Altruism means benevolence or living for others (Smith et al, 2006). The terms altruism and prosocial behavior are used interchangeably. A person is said to exhibit prosocial behavior when one’s helpful action benefits others which does not necessarily serve any benefit to the self and the prosocial act may even involve risk. The true or pure altruism is an individual’s unselfish concern for the welfare of others. Altruism is a group phenomenon. It requires at least a group of two, an altruist who pays a cost and a recipient who receives a benefit.
Altruism is indeed one aspect of what social psychologists call prosocial behavior. Prosaic behavior refers to any action that benefits other people, regardless of what the motivation is or how the action benefits the giver. For example, we may be helping others for a variety of reasons, such as guilt, obligation, duty, or even reward.
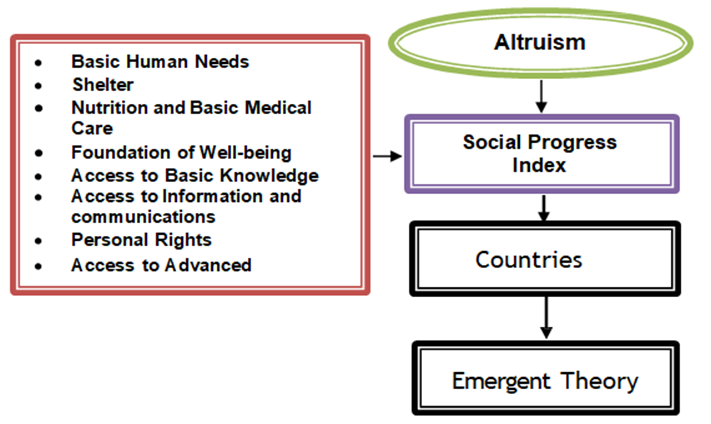
Figure 2: Theoretical-Conceptual – Framework
The altruism is an unconditional kindness without expectation of return, and providing help and achieving a sense of satisfaction from the regardless action by helping others. It is an important quality of animals especially for human beings. There are various factors which are playing significant role in the evolution of altruistic behaviors in humans. As it is a complex mechanism a single approach is not sufficient to explain it. It will be possible only with the help of various theories.
Various religions display evidence of emphasizing the importance of helping others which explains the increased tendency of religious people to be helpful. Buddhism claims the need for altruism in sayings like “the more we care for the happiness of others, the greater our own sense of well-being becomes” (Dalai Lama, 2009). The following excerpt from The Bible “you should love your neighbor as yourself” suggests empathic-altruism. Islam describes the concept of “ithaar” which means altruism- as preferring others to oneself. The Bhagavad Gita states the virtue of “nishkaama karma” referring to actions without any expectation or desire for personal gain which encompasses altruism. Although religion portrays altruism as a salient virtue, there is a possibility of an effect of in-group bias over a religious persons’ helping behavior.
Accordingly, social progress, even so, is the capability of a social structure to address the basic individual needs of its inhabitants, to set up essential elements that will allow inhabitants and societies to enhance and sustain the quality of their lives, and to create the conditions for all individuals to reach their full potential.
The socially manufactured component of social quality known as “social moral resource” is made up of perceived democratic processes and social capital that give people a sense of agency and encourage active involvement. The predictability of social norms and the openness of society are the two most crucial components of social capital. The legitimacy of the system is increased when individuals believe that the rules are always followed. People are more likely to vote and take part in other political activities when they believe that democracy is functioning and that they can control their own destiny. (Paspasan, et.al)
The country Social Progress Index (SPI) measures the extent to which countries provide for the social and environmental needs of their citizens. The paper selected eight SPI country indicators, such as Basic Human Needs, Shelter, Nutrition and Basic Medical Care, Well-being Foundation, Access to Basic Knowledge, Access to Information and Communications, Personal Rights, Access to Advanced Education, and the relative performance of nations.
SPI indicators illustrate three distinct but interrelated quality of life measures. The basic human needs will be evaluated as to how well a country meets the essential needs of its people if the country is safe and secure by means of gauging access to food and basic health care. Consequently, well-being foundations also assess citizens ‘ access to information and knowledge both within their country in terms of access to basic knowledge. In fact, one of the SPI’s distinctive features is that it supports personal rights, a dimension of human well-being that is often ignored or isolated from more basic and material needs in thinking about social progress.
The key variables described in the process indicate the various interrelationships between them. Thus, the goal of this paper is to develop a theory on how the chosen measures lead to social change in the country.
METHODOLOGY
Research Design
The research design used in this study conducted is descriptive in nature. Data Mining is used to explore data (usually large sets of data-typically relevant to business or economy- also known as ‘ big data ‘) in terms of common trends and/or hierarchical relationships between variables, and then to validate the results by applying the patterns identified to new data sub-sets. Thus, the said design was used in determining the theory of emergent based on the eight (8) indicators on social progress index (SPI) results of 2018 such as Basic Human Needs, Shelter, Nutrition and Basic Medical Care, Foundation of Well-being, Access to Basic Knowledge, Access to Information and communications, Personal Rights and Access to Advanced.
Data Analysis
This paper uses the Principal Components Analysis (PCA) aims by reducing a large set of variables to a small set that still contains most of the information in the large set. A smaller number of quasi-correlated variables, called “principal components. With this analysis, the researcher can create new variables (principal components) that are linear combinations of the variables observed. The objective of the principal component analysis is then to explain the maximum variance with the smallest number of principal components.
PCA as presented here, it requires an Eigenvalue analysis of the covariance matrix in order to find the linear combinations of the data variables with greatest variance. Hence, the mathematical technique used in PCA is called Eigen analysis. The eigenvector associated with the largest eigenvalue has the same direction as the first principal component. The eigenvector associated with the second largest eigenvalue determines the direction of the second principal component.
Scope and Limitation of the Study
This study focused on the Social Progress Index (SPI) 2018 of selected countries with complete data. The researchers considered only eight (8) indicators out of fifty-two (52) indicators to be used to generate a theory using the principal component analysis.
RESULTS AND DISCUSSION
The SCREE PLOT as shown in Figure 1 displays the number of factors to retain in a principal components analysis such as Basic Human Needs, Foundation of Wellbeing, Nutrition and Basic Medical Care, Shelter, Access to Basic Knowledge, Access to Information and communications, Personal Rights and Access to Advanced Education. Scree plot also shows the eigenvalues on the y-axis and the number of indicators or variables on the x-axis. It always displays a downward curve. Thus, figure 1 pointed out where the slope of the curve is clearly leveling off (the “elbow) to indicates the number of principal components that should be generated by the analysis.
Therefore, the remaining principal components account for a very small proportion of the variability (close to zero) and are probably unimportant.
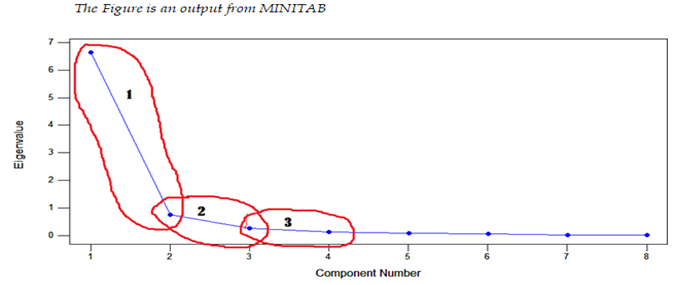
Figure I: Scree Plot of PCA eigenvalues for data analyzed for selected countries
According to the Scree Plot shown in Figure 1 it is not clear whether keeping two or three principal components is better. The values obtained from the data matrix of the correlation is shown in Table 1. The eight (8) eigenvalues presented are ordered from the highest to the lowest variability of the data set. Following the rules-of thumb, the first two principal components give 92.5 % of the total variability. Retaining only the first two principal components (PCs) in an analysis captures 92.5% of the original dataset’s variability, conserving the most important information. This is consistent with the Scree plot’s “elbows,” which illustrate areas where more components provide decreasing benefits to variance explanation.
Complex data may be made less dimensional by using Principal Component Analysis (PCA), which maintains as much variability as possible. To do this, the data must be transformed into a collection of uncorrelated principal components (PCs), which reduce the number of dimensions and highlight the most significant patterns. By reducing the data from hundreds of variables to only two dimensions, the first two main components may account for 92.5% of the total variability.
This method is helpful for analyzing large datasets, improves processing speed, and makes visualization and comprehension easier. By determining which components are responsible for the bulk of the variance, maintaining the necessary data structure, and avoiding problems like overfitting, PCA helps create a balanced model. This approach serves as a visual identifier and is extensively described in PCA literature.
Table 1: Eigenanalysis of the Correlation Matrix
| Principal
Component |
Eigenvalue | Percentage of variability | |
| Proportion | Cumulative | ||
| 1 | 6.6731 | 0.834 | 0.834 |
| 2 | 0.7278 | 0.091 | 0.925 |
| 3 | 0.2596 | 0.032 | 0.958 |
| 4 | 0.1287 | 0.016 | 0.974 |
| 5 | 0.0994 | 0.012 | 0.986 |
| 6 | 0.0693 | 0.009 | 0.995 |
| 7 | 0.0240 | 0.003 | 0.998 |
| 8 | 0.0181 | 0.002 | 1.000 |
The first Eigenvalue of a correlation matrix as shown in Table 1 indicates the maximum amount of the variance of the variables which can be accounted for with a linear model by a single underlying factor. When all correlations between variables are positive, the first eigenvalue in Principal Component Analysis (PCA) approximates a linear function that represents their average correlation.
The table 1 also shows that only 83.4% is the needed variance to explain the principal components that can be for descriptive purposes. However, to perform other analyses on the data at least 92.5% of the variance can be explained by the principal components. It means that after performing Principal Component Analysis (PCA), the first few principal components account for a large proportion of the original dataset’s variability—92.5% in this particular case. When the principal components capture such a large proportion of variation, it means that the fundamental information contained within the original variables is kept in a smaller number of dimensions, making the subsequent analyses more efficient and interpretable (Jolliffe & Cadima, 2016).
By focusing on the principal components, we minimize duplicate information, reducing noise and improving the visibility of any patterns or links in the data (Abdi & Williams, 2010). This dimensionality reduction is especially useful for large datasets, because dealing with fewer components improves computing performance while preserving robust analytical insights.
In order to identify interrelated variables and make easier the visualization, the data were compressed to a one dimension using the principal component. The number of correlation variables was selected on the basis of principal component (PC) values. It can be supposed that factor 1 is related to the influence of the other remaining factors. It implies that the variables included in the study were chosen based on their contribution to the dataset’s most important main components. Variables with high loadings on the principal components are prioritized in principle Component Analysis (PCA) because they account for a considerable fraction of overall data variability (Jolliffe & Cadima, 2016).
The first factor, or primary component, in a dataset often reflects common patterns among other components, indicating a dominant trend or correlation structure (Rencher & Christensen, 2012). Yadav (2019) explored the integration of Principal Component Analysis (PCA) with neural networks to enhance model efficiency and interpretability, especially in high-dimensional financial data. By applying PCA to reduce input dimensions, the study achieved a more streamlined neural network architecture, resulting in lower computational costs and training times without a significant loss in accuracy. The findings revealed that neural networks preprocessed with PCA performed similarly to those trained on the complete feature set, demonstrating PCA’s effectiveness in maintaining essential information while minimizing feature redundancy.
The eigenvectors, the index of the combined action or contrast of the original dimensions are given in Table 2. The eigenvectors are scaled from +1 to -1. The variables that have statistically significant positive or negative value, (the bolded values in the table) work as an index of agreement or disagreement of change in the original variables.
As shown in Table 2 the first principal component (PC1) gives high negative values to both Basic Human Needs, Foundation of Wellbeing, Nutrition and Basic Medical Care, Shelter, Access to Basic Knowledge, Access to Information and communications, and Access to Advanced Education. Hence, the first PC gives information about the country social progress index in their basic human needs. The second principal component (PC2) shows a relationship between personal rights and shelter and Nutrition and Basic Medical Care. The third principal component (PC3) gives relationship about Access to Advanced Education index Nutrition and Basic Medical Care index, which represent the Social Progress Components Index Progress versus the selected countries.
The phrase implies that the first main component (PC1) is largely concerned with fundamental components of social welfare, such as Basic Human Needs, Wellbeing, and Access to Education. High negative values on PC1 for these variables indicate that they change inversely along this dimension, which might indicate that nations with more fulfillment in these areas score differently on the social development scale (Jolliffe & Cadima, 2016). This indicates that PC1 captures and consolidates the majority of the variability associated with these basic welfare indicators, making it an effective indicator for analyzing a country’s baseline socioeconomic circumstances (Abdi & Williams, 2010).
Table 2: Social Progress Index Progress Components
| Variable | PC1 | PC2 | PC3 | PC4 | PC5 | PC6 | PC7 | PC8 |
| BHN | – 0.379 | -0.119 | -0.212 | 0.120 | -0.231 | -0.087 | 0.195 | –0.827 |
| FW | –0.382 | 0.015 | 0.044 | -0.011 | 0.228 | -0.215 | –0.864 | -0.085 |
| NBMC | –0.367 | –0.183 | –0.323 | 0.035 | -0.303 | 0.740 | -0.147 | 0.254 |
| S | –0.364 | –0.282 | -0.220 | 0.317 | -0.219 | –0.578 | 0.180 | 0.474 |
| ABK | –0.365 | -0.109 | -0.129 | -0.820 | 0.295 | -0.083 | 0.254 | 0.082 |
| AIC | –0.368 | 0.117 | 0.138 | 0.451 | 0.702 | 0.220 | 0.293 | 0.032 |
| PR | -0.236 | 0.920 | -0.162 | -0.038 | -0.228 | -0.073 | 0.061 | 0.098 |
| AAE | – 0.345 | -0.033 | 0.859 | – 0.078 | -0.350 | 0.058 | 0.061 | 0.043 |
Legend:
- BHN – Basic Human Needs
- FW – Foundation of Wellbeing
- NBMC – Nutrition and Basic Medical Care
- S – Shelter
- ABK – Access to Basic Knowledge
- AIC – Access to Information and communications
- PR – Personal Rights
- AAE – Access to Advanced Education
Principal Component Analysis (PCA) is a method employed to discern patterns within data and lessen its dimensionality through the transformation of the original variables into a set of non-correlated variables known as principal components. In the provided dataset, each row denotes a variable, and each column reflects the loadings of that variable on various principal components (PCs). As shown in Table 2 that the loadings elucidate the fundamental relationships among the variables. PC1 accounts for the highest variance in the data and exhibits strong negative loadings for Basic Human Needs (-0.379), Foundation of Well-being (-0.382), and Shelter (-0.364), suggesting a common inverse relationship among these variables. PC1 accounts for the most significant portion of the variance, suggesting it may indicate a general pattern where an increase in one variable is associated with a decrease in others. This offers insight into a fundamental relationship between these variables, indicating that they are influenced by analogous factors or behaviors.
Conversely, PC2 exhibits a significant positive loading for Personal Rights (0.920), indicating that Personal Rights substantially influences the variance represented by this principal component. The correlation between Personal Rights and Nutrition and Basic Medical Care is -0.183, and with Shelter, it is -0.282, indicating a positive relationship. Other variables exhibit weaker contributions. PC2 predominantly illustrates a pattern in which Personal Rights is central to explaining the variation in Nutrition, Basic Medical Care, and Shelter, while exhibiting weaker associations with other variables.
Additionally, PC3 is significantly impacted by Access to Advanced Education (0.859), indicating that this factor plays a crucial role in this component. Variables such as Access to Information and Communications (0.702) and Access to Basic Knowledge (0.295) contribute to PC5, indicating a related pattern of variance between them. PCA effectively reduces dataset complexity by emphasizing components that account for the greatest variation, thereby enhancing the understanding of underlying variable relationships and facilitating improved modeling and analysis (Jolliffe & Cadima, 2016; Abdi & Williams, 2010).
A distinct pattern may be seen in the second principal component (PC2), which focuses on the connections between personal rights and other welfare variables such as shelter and nutrition. This suggests that PC2 captures variability not explained by PC1 by differentiating nations according to rights-oriented measures and certain fundamental requirements (Ringnér, 2008). Another aspect of social progress that examines advanced educational access in relation to health indicators is the third principal component (PC3), which links nutrition and access to advanced education. When combined, these elements offer a multifaceted perspective on social advancement, enabling a sophisticated cross-national comparison of social growth (Rencher & Christensen, 2012).
In these results, the score for the first and the second principal component can be calculated from the standardized data using the coefficients listed under PC1 and PC2, respectively;
PC1 = 0.379* BHN + 0.382* FW + 0.367*NBMC+0.364*S+0.365*ABK+ 0.368*AIC + 0.236*PR + 0.345*AAE……………… (1)
PC2 = 0.119* BHN – 0.015*FW + 0.183*NBMC+0.282*S+0.109*ABK- 0.117*AIC – 0.920*PS+ 0.033*AAE (2)
PCA is used to reduce the complexity of a dataset while retaining as much information as possible. The principal components PC1 and PC2 represent new axes that capture the most variance in the data. PC1 captures the most significant trend in the dataset and PC2 captures the second most significant trend, which is uncorrelated with PC1.
Equation 1 reveals that all coefficients are positive, meaning all factors contribute positively to PC1.The largest contributions come from FW (0.382), BHN (0.379), and NBMC (0.367). It implies that PC1 likely represents an overall measure of well-being or human development, where higher values indicate better access to basic needs, education, and rights. Thus, PC1 could be interpreted as a general index of human well-being, where societies with high scores tend to have good access to essential services.
For Equation 2, it also shows that PR has the largest (negative influence with a coefficient of -0.920, meaning that as PR increase, PC2 tends to decrease. Shelter (S = 0.282) and NBMC (0.183) contribute positively, indicating they increase PC2. FW (-0.015) and AIC (-0.117) have minor negative effects. This implies that since PR has a strong negative weight, PC2 might represent a trade-off between personal rights and basic needs. A high PC2 score suggests strong access to shelter and medical care but potentially weaker personal rights. A low PC2 score might indicate better personal rights but relatively lower emphasis on infrastructure-based needs. PC2 may reflect a tension between governance/personal rights and access to basic services.
Moreover, PC1 represents overall well-being, where higher values indicate better access to fundamental needs, education, and rights. And also, PC2 represents a contrast between personal rights and infrastructure-based needs, with personal rights pulling it in the negative direction and shelter/medical care pulling it positively.
Consequently, Table 2 indicates that PC1 exhibits insignificant negative associations with basic human needs, the Foundation of Wellbeing, Nutrition and Basic Medical Care, Shelter, Access to Basic Knowledge, Access to Information and Communications, and Access to Advanced Education. This component quantitatively assesses the social progress within the domain. The emphasized component serves as a significant indicator for assessing the overall level of social development within a specific context, such as a nation, community, or region. This evaluation will consider various aspects of social welfare, including equality, health, education, and environmental sustainability, to provide a comprehensive assessment of society’s well-being. The highlighted component serves as a significant indicator for assessing overall social development within a specific context, such as a country, community, or region. This evaluation considers various elements of social welfare, including health, education, equality, and environmental sustainability, to present a comprehensive overview of societal well-being.
The data indicate that various dimensions of social progress generally enhance with income growth. Wealthier nations, exemplified by Norway, which ranks first in this year’s SPI, typically achieve superior social outcomes compared to lower-income countries. Consequently, numerous rapidly developing economies, such as China and India, have not yet achieved the degree of social advancement that their economic growth permits.
It is also vital to look at China and India, the two most populous countries that significantly affect the world scores. China is placed at 83rd position with a score of 63.72, registering an improvement by 1.42 points since 2014. It is able to provide its citizens with basic facilities like health and shelter. Thus, the scores on opportunity dimension of the Social Progress Index, that measures citizens’ choices, are just 42.89.
Nevertheless, the second principal component (PC2) indicates a highest primary component that predominantly measures the constituent’s personal right. The personal right implies the rights that a person has over their own body. For that reason, for the country had aspired to enhance the social progress might be instigate gradually to reduce the personal rights of the national.
Essentially, the index shows in which areas a country needs to put more emphasis to improve the living standards of its people. The index aims to provide a systematic, empirical foundation to guide strategy for inclusive growth. In the words of Porter, Stern, and Green [28]: “If we can track societal performance rigorously, this will enable better choices, better policies, and better investments by government and business. Green et. al. (2017) findings suggest that improved social progress in the aggregate should not mask the erosion in personal rights and challenges to tolerance and safety that threaten to undermine hard-earned social progress achievements.
Rodin’s Theory of Emergence:
“Social progress often involves reevaluating personal rights for collective good, allowing voluntary relinquishing of certain rights to contribute to the greater benefit of society as a whole”
CONCLUSION
The persistence of disparities in individual rights is evident in social development measurements and economic indicators such as Basic Human Needs, despite substantial efforts to enhance quality of life. This implies that the distribution of social welfare advancements is unequal, underscoring the necessity of inclusive and comprehensive development.
Legal measures, government, public society, and international organizations must contribute to preserving and defending fundamental rights. Social justice, equality, and empowerment of marginalized groups must also be incorporated into sustainable development. Societies promoting a rights-based approach can ensure significant and sustainable growth for all individuals.
REFERENCES
- Abdi, H., & Williams, L. J. (2010). Principal component analysis. Wiley Interdisciplinary Reviews: Computational Statistics, 2(4), 433-459.
- Dalai Lama XIV. (2007)/ (2009). Preface in “Mind in Comfort and Ease”. Boston, MA: Wisdom Publications.
- Jad Chaaban & Alexandra Irani & Alexander Khoury, 2016. “The Composite Global Well-Being Index (CGWBI): A New Multi-Dimensional Measure of Human Development,” Social Indicators Research: An International and Interdisciplinary Journal for Quality-of-Life Measurement, Springer, vol. 129(1), pages 465-487, October.
- Jolliffe, I. T., & Cadima, J. (2016). Principal component analysis: A review and recent developments. *Philosophical Transactions of the Royal Society A: Mathematical, Physical and Engineering Sciences*, 374(2065), 20150202.
- J., Deepa et. al. (2016). Evolution of Altruism in Humans Mathew. IJSSIR, Vol. 5 (12), DECEMBER (2016), pp. 45-65
- Rencher, A. C., & Christensen, W. F. (2012). *Methods of Multivariate Analysis*. Wiley Series in Probability and Statistics.
- Sandeep Yadav (2019) Combining PCA with Neural Networks Improving Model Efficiency and Interpretability, IJIRMPS | ISSN: 2349-7300
Other References
- GREEN al. (2017) SOCIAL PROGRESS INDEX 2017
- https://understandingsociety.blogspot.com/2010/06/social-progress.html
- http://www.humanosphere.org/social-business/2017/06/worldwide-decline-in-personal- rights-hampers-social-progress-study-shows/
- https://www.firstpost.com/business/social-progress-index-indias-quality-of-life-improves- but-scores-low-on-communication-environment-3738869.html //economictimes. indiatimes.com/ articleshow/65911174. cms?utm source=contentofinteres t&utm medium=text&utm campaign=cppst
- https://ideas.ted.com/why-we-shouldnt-judge-a-country-by-its-gdp/ //economictimes. indiatimes.com/ articleshow/33224145.cms?utm source=contentofinteres t&utm_medium=text&utm_campaign=cppst