
Step-By-Step Guide to Calculating Content Validity Index (CVI) For Single Constructs Using Excel
- Nur Ain Md Lukmanul Hakim
- Mohamad Rasidi Pairan
- Mohamad Ikram Zakaria
- 1717-1726
- Apr 4, 2025
- Education
Step-By-Step Guide to Calculating Content Validity Index (CVI) For Single Constructs Using Excel
Nur Ain Md Lukmanul Hakim, Mohamad Rasidi Pairan, Mohamad Ikram Zakaria
Faculty of Educational Sciences and Technology, University Technology Malaysia, Johor, Malaysia
DOI: https://dx.doi.org/10.47772/IJRISS.2025.90300135
Received: 28 February 2025; Accepted: 05 March 2025; Published: 04 April 2025
ABSTRACT
The Content Validity Index (CVI) is a widely used method for assessing the validity of questionnaire items, particularly in educational and social science research. This paper presents a step-by-step tutorial on calculating the CVI for a single construct using Microsoft Excel, making the validation process accessible to researchers with minimal statistical expertise. The methodology includes computing the Item-Level Content Validity Index (I-CVI) and the Scale-Level Content Validity Index (S-CVI), using expert ratings to determine the relevance of questionnaire items. The tutorial demonstrates key Excel functions, such as COUNTIF and AVERAGE, to automate the validity calculation. The findings indicate that while the overall S-CVI/Average (0.875) exceeds the threshold of 0.8, individual I-CVI values revealed areas for potential refinement, highlighting the importance of both item-level and scale-level analysis. This tutorial provides a practical guide for researchers to systematically validate their instruments, ensuring rigor and reliability in questionnaire development.
Keywords: Content Validity Index (CVI), Item-Level CVI (I-CVI), Scale-Level CVI (S-CVI), Questionnaire Validation, Expert Rating, Excel
INTRODUCTION
The validity of research instruments plays a crucial role in ensuring the accuracy and credibility of findings, particularly in questionnaire-based studies. In academic and applied research, developing psychometric measures requires rigorous validation to ensure the instrument effectively captures the intended construct [1]. One essential component of instrument validation is content validity, which assesses whether the questionnaire items adequately represent the domain of interest[2]. Establishing content validity not only strengthens theoretical foundations but also enhances data quality and participant engagement [3]. In fields such as healthcare and education, robust content validation ensures that training tools, pre/post-test questionnaires, and research instruments align with evidence-based practices[3].
To systematically evaluate content validity, researchers often rely on the Content Validity Index (CVI), a widely used metric that helps quantify expert agreement on item relevance. The CVI is classified into two levels: Item-Level CVI (I-CVI), which assesses individual items, and Scale-Level CVI (S-CVI), which evaluates the overall validity of the questionnaire[4, 5]. The S-CVI can be calculated using two approaches: universal agreement (S-CVI/UA) and average agreement (S-CVI/Ave)[6]. A systematic approach, such as the 6C Model, is often used in content validation, which includes Creating a form, choosing experts, completing verification, considering objects and domain, Causing a grade, and CVI Calculation [6]. This structured method ensures consistency in validation procedures and improves the reliability of research instruments across different disciplines [5].
Despite the importance of CVI in research, inconsistencies in reporting and calculating CVI values remain a challenge. Various approaches have been adopted for evaluating content validity; however, inconsistencies in methodology may lead to misinterpretation of results[7]. In addition, manual CVI calculations can be prone to human error, reducing the accuracy and reliability of findings[8].To address these concerns, the integration of digital tools, such as Microsoft Excel, offers a more standardized and efficient approach for calculating CVI.
Recent studies have highlighted Excel’s effectiveness in performing complex calculations across diverse fields. Excel has been widely used in engineering, shipping, and statistical analysis for its accuracy, efficiency, and user-friendly interface [9, 10]. In chemical engineering, Excel has been applied to optimize multicomponent distillation column sizing, demonstrating its potential for both academic and industrial applications [11]. Similarly, in education, Excel serves as an introductory tool for teaching numerical methods before transitioning to more advanced statistical software [12]. These examples collectively emphasize the practicality, accuracy, and time-saving benefits of Excel, making it a valuable tool for streamlining content validity calculations.
Given the need for a standardized and accessible approach to CVI calculation, this study aims to evaluate the Content Validity Index (CVI) for a single construct and multiple constructs using a systematic approach and also demonstrate a step-by-step method for calculating CVI using Excel to facilitate accurate and practical validation. By providing a structured guide to CVI computation using Excel, this study seeks to assist researchers in efficiently validating their instruments while ensuring clarity and consistency in CVI reporting. The proposed method will help mitigate errors, improve reproducibility, and offer a practical alternative to manual content validity calculations.
METHODOLOGY
This study employs a quantitative validation approach to assess the Content Validity Index (CVI) for a single construct. The expert validation data was collected previously, and this study systematically calculates CVI to determine the level of agreement among experts regarding the relevance of questionnaire items.
The questionnaire was designed to examine the challenges novice lecturers face in integrating Higher-Order Thinking Skills (HOTS) into their teaching practices in vocational colleges. The development process involved, comprehensive literature review to ensure alignment with established theories, refinement of questionnaire items based on expert input and validation phase, where experts rated the relevance of each item.
A panel of three experts was selected to evaluate the content validity of the questionnaire. The experts were chosen based on a minimum of five years of experience in relevant fields, and an expertise in language education and what the construct being measured. Each expert independently assessed a 10-question instrument to evaluate how well each item represented the challenges of implementing HOTS.
The experts rated each questionnaire item using a four-point Likert scale,1 = Not relevant; 2 = Somewhat relevant; 3 = Quite relevant; and 4 = Highly relevant. The collected ratings were compiled and analyzed to determine the CVI, providing a systematic measure of content validity.
Cotent Validity Index (CVI) Calculation
To ensure transparency and reproducibility, the CVI calculations were conducted in Microsoft Excel through the following steps:
Step 1: Setting Up the Data Table
An Excel table was created where rows represent questionnaire items. Columns represent expert ratings and ratings were recorded using a four-point Likert scale.
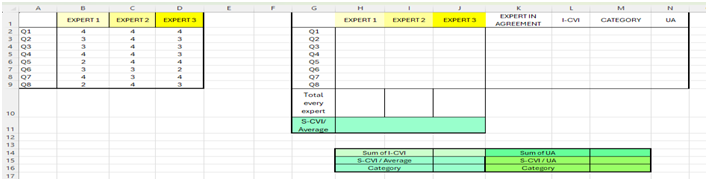
Figure 1 Setting Up the Data Table
Step 2: Converting Likert Scale Ratings to Binary Values
To facilitate CVI calculations, the Likert scale ratings were converted into binary values as follows:
Table 1 Conversion of Likert Scale Ratings for CVI Calculation
| Likert Scale | Binary Conversion of Expert Ratings |
| 1,2 | 0 (Not Valid) |
| 3,4 | 1 (Valid) |
Excel Formula for Binary Conversion
- Go to cell H2.
- Enter the formula: =IF(B2>=3,1,0)
- Press Enter.
- Drag the formula right to fill columns for Expert 2 and Expert 3.
- Drag the formula down to fill all question rows.
Outcome: All Likert scale ratings of 3 or 4 are converted to “1”, while ratings of 1 or 2 are converted to “0”.
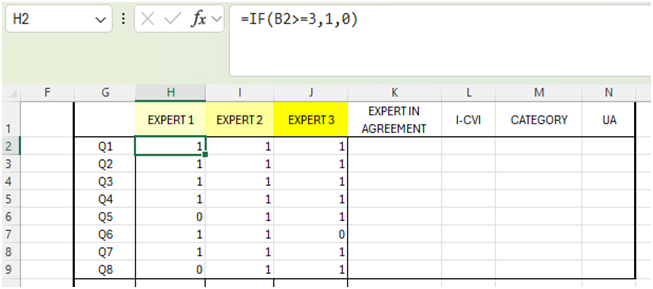
Figure 2 Converting Likert Scale Ratings to Binary Values
Step 3: Counting Expert Agreement
The next step is to count the number of experts who rated each item as “1” (Valid).
Excel Formula to Count Expert Agreement
- Go to cell K2.
- Enter the formula: =COUNTIF(H2:J2,”>=1″)
- Press Enter.
- Drag the formula down to fill all question rows.
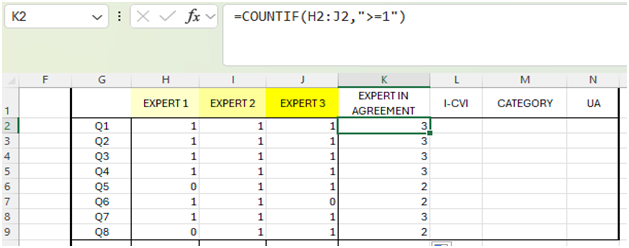
Figure 3 Counting Expert Agreement
Step 4: Calculating I-CVI
TheI-CVI) is calculated by dividing the number of experts who agreed (rated “1”) by the total number of experts (3).
Excel Formula for I-CVI Calculation
- Go to cell L2.
- Enter the formula:=K2/3
- Press Enter.
- Drag the formula down to fill all question rows.
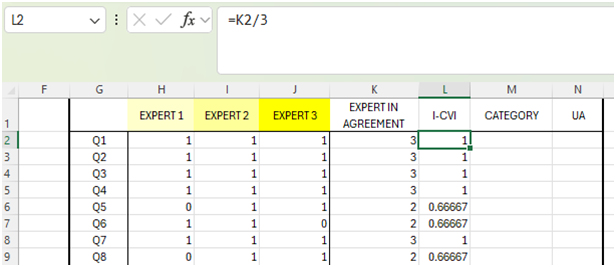
Figure 4 I-CVI Calculation
Step 5: Categorizing Items as Valid or Invalid
In determining the appropriate number of experts, Table 2 below presents the suitability of the I-CVI value based on the number of experts and relevant references. It is crucial to ensure that the obtained I-CVI value aligns with the required threshold, as it indicates whether the content validity meets the expected standard. If the I-CVI value does not meet the required threshold,[13] suggests that researchers should make a decision based on the needs of the study. For this study, the researcher decided to follow the recommendations of [14] and [15], which state that for newly developed instruments, a CVI value of ≥ 0.8 is required to confirm that the items possess high, clear, and relevant content validity. Therefore, if I-CVI ≥ 0.8, the item is considered valid, whereas if I-CVI < 0.8, the item is deemed invalid.
Table 2 The number of experts and its implication on the acceptable cut-off score of CVI
| Number of experts | Acceptables CVI values | Source of recomendation |
| 2 | At least 0.8 | Davis (1992) |
| 3 to 5 | Should be 1 | Polit & Beck (2006), Polit et al., (2007) |
| At least 6 | At least 0.83 | Polit & Beck (2006), Polit et al., (2007) |
| 6 to 8 | At least 0.83 | Lynn (1986) |
| At least 9 | At least 0.78 | Lynn (1986) |
Excel Formula for Categorization
- Go to cell M2.
- Enter the formula: =IF(L2>=0.8,”Valid”,”Invalid”)
- Press Enter.
- Drag the formula down to fill all question rows.
*The value 0.8 can be change depend on the CVI value that resercher followed.
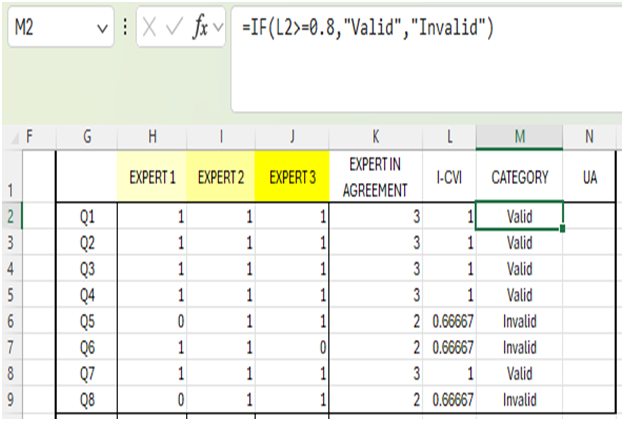
Figure 5 Categorization based on CVI value
Step 6: Calculating Universal Agreement (UA)
UA measures the proportion of items where all three experts agree (i.e., all experts rate the item as 3 or 4 before conversion, or all are “1” in the binary table).
Excel Formula for UA Calculation
- Go to cell N2.
- Enter the formula: =IF(AND(H2=1,I2=1,J2=1),1,0)
- Press Enter.
- Drag the formula down to fill all question rows.
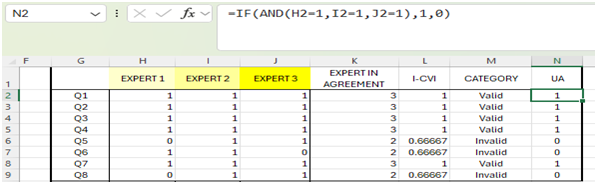
Figure 6 Universal Agreement (UA) for every item question
Step 7: Calculating Expert Averages
To determine experts’ consensus, the sum of binary scores for each expert is calculated.
Excel Formula for Sum of Binary Scores
- Go to cell H10.
- Enter the formula: =SUM(H2:H9)/8
- Press Enter.
- Drag the formula right to fill columns for Expert 2 and Expert 3.
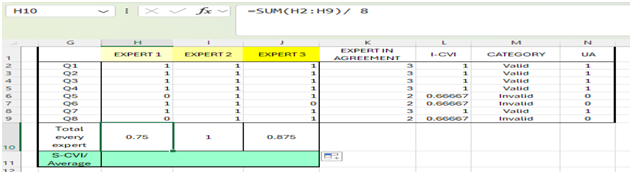
Figure 7 Sum of Binary Scores based on every expert
To calculate the overall expert consensus, we take the average of expert totals:
Excel Formula for Average Expert Consensus
- Go to cell H11.
- Enter the formula: =AVERAGE(H10:J10)
- Press Enter.
- Copy the value to the S-CVI/Average box (J15) OR enter the formula directly in J15: =H11
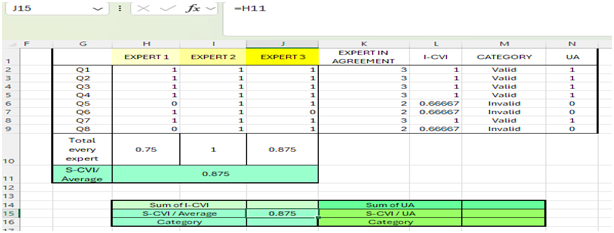
Figure 8 Average Expert Consensus
Step 8: Calculating Final CVI Metrics
To determine S-CVI/Average and S-CVI/UA, we apply the following calculations:
Excel Formula for sum of I-CVI
- Go to cell J14.
- Enter the formula: =SUM(L2:L9)
- Press Enter.
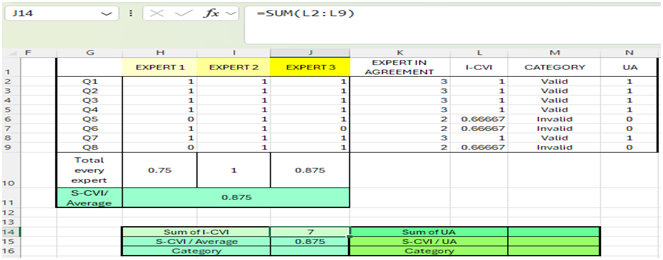
Figure 9 Sum of I-CVI
Excel Formula for sum of UA
- Go to cell M14.
- Enter the formula: =SUM(N2:N9)
- Press Enter.
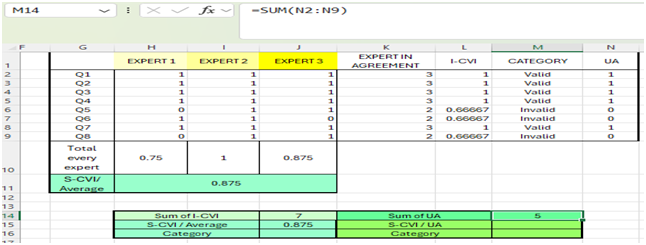
Figure 10 Sum of UA
Excel formula for Calculating S-CVI/UA
S-CVI/UA is obtained by dividing the sum of UA by the total number of questionnaire items. In this research, researcher used 8 questionaire item to validate.
- Go to cell M15.
- Enter the formula: =M14/8
- Press Enter.
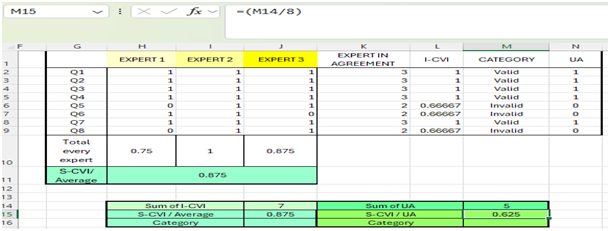
Figure 11 Calculating S-CVI/UA
Final Categorization for S-CVI
To determine the validity of S-CVI, researcher still using the CVI value ≥ 0.8. So, If S-CVI ≥ 0.8, the category is Valid and if S-CVI < 0.78, the category is Invalid.
Excel Formula for S-CVI
- Go to cell J16.
- Enter the formula: =IF(J15>=0.78,”Valid”,”Invalid”)
- Press Enter.
- Repeat for M16 using this formula : =IF(M15>=0.78,”Valid”,”Invalid”)
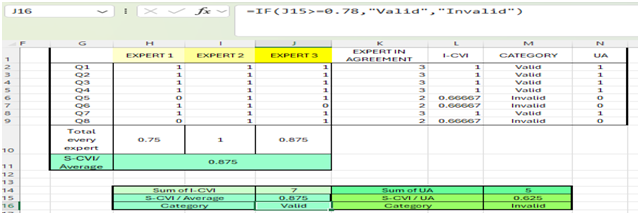
Figure 12 Categorization for S-CVI
DISCUSSION
This study provides a step-by-step guide on calculating the Content Validity Index (CVI) for a single construct using Excel. The process involves determining both the Item-Level Content Validity Index (I-CVI) and the Scale-Level Content Validity Index (S-CVI), which are crucial in assessing the relevance and clarity of questionnaire items based on expert evaluations.
The results from the CVI analysis in this tutorial demonstrate that five out of eight items received an I-CVI of 1.00, indicating unanimous agreement among experts on their relevance. However, three items (Q5, Q6, and Q8) scored below the 0.8 threshold (I-CVI = 0.6667), suggesting some level of disagreement among the experts regarding their content validity. Despite this, the overall S-CVI/Average was 0.875, which exceeds the minimum required threshold of 0.8, confirming the overall validity of the scale.
This tutorial highlights the importance of systematically evaluating content validity through Excel, demonstrating how formulas such as COUNTIF and AVERAGE can be used to calculate agreement levels efficiently. Additionally, it explains how the S-CVI/Average is derived from individual I-CVI values, and why it serves as a critical measure for assessing the overall validity of a single construct. The findings also emphasize that while a high S-CVI indicates strong content validity, individual item-level scores must be carefully examined to identify items requiring refinement.
CONCLUSION
This Excel tutorial provides a practical, step-by-step guide to calculating the Content Validity Index (CVI) for single constructs, offering researchers a structured approach to validating questionnaire items. The tutorial demonstrates how I-CVI and S-CVI/Average are computed and interpreted, ensuring that researchers can assess the relevance of their items with precision.
The findings illustrate that while a high S-CVI/Average confirms overall content validity, individual I-CVI scores must be examined to refine weaker items. In cases where certain items fall below the 0.8 threshold, researchers should consider revising those items, seeking further expert input, or conducting additional validation rounds. This tutorial serves as a useful resource for researchers who wish to apply the CVI method efficiently using Excel, enabling them to enhance the rigor and reliability of their instruments in various fields of study.
REFERENCES
- London, K. Matthews, and V. Grover, “On meaning and measurement: A review of content validity in IS,” 2017.
- S. B. Yusoff, W. N. Arifin, and S. N. H. Hadie, “ABC of questionnaire development and validation for survey research,” Education in Medicine Journal, vol. 13, no. 1, 2021.
- R. Roopashree, “A pragmatic approach for the calculation content validity indices: a study on validation of training tool for pre and post-test questionnaire for the health care sector,” QAI Journal for Healthcare Quality and Patient Safety, vol. 4, no. 1, pp. 17-23, 2023.
- Kipli and A. Z. Khairani, “Content Validity Index: An application of validating CIPP instrument for programme evaluation,” Int Multidiscip Res J, vol. 2, no. 4, pp. 31-40, 2020.
- Madadizadeh and S. Bahariniya, “Tutorial on how to calculating content validity of scales in medical research,” Perioperative Care and Operating Room Management, vol. 31, p. 100315, 2023.
- S. Guraya et al., “Validating the Medical Education e-Professionalism Framework Using the Content Validity Index,” Education in Medicine Journal, vol. 14, no. 3, 2022.
- F. Polit and C. T. Beck, “The content validity index: are you sure you know what’s being reported? Critique and recommendations,” Research in nursing & health, vol. 29, no. 5, pp. 489-497, 2006.
- Munisamy, S. Sahid, and M. Hussin, “Content Validation and Content Validity Index Calculation of B40 Household’s Financial Literacy,” Turkish Online Journal of Qualitative Inquiry, vol. 12, no. 8, 2021.
- T. Adi and P. Suhadi, “Komparasi Perh Itungan Draft Survey Antara Metode Konvensional Dengan Metode Microsoft Excel Dalam Menghitung Berat Muatan Pada Kapal,” Jurnal Jalasena, vol. 2, no. 1, pp. 16-27, 2020.
- S. Rayat, “Applications of Microsoft Excel in statistical methods,” Statistical Methods in Medical Research, pp. 139-146, 2018.
- J. d. S. Ribeiro, C. R. Carneiro, S. G. Bosmediano, M. T. Neves, M. M. dos Santos Dias, and F. R. Carvalho, “Excel as an optimization tool applied to multicomponent distillation column sizing,” The Journal of Engineering and Exact Sciences, vol. 10, no. 3, pp. 18680-18680, 2024.
- Djamila, “Excel spreadsheet in teaching numerical methods,” in Journal of Physics: Conference Series, 2017, vol. 890, no. 1: IOP Publishing, p. 012093.
- A. Aziz, M. M. Saidfudin, and Z. Azami, Asas model pengukuran Rasch: Pembentukan skala dan struktur pengukuran. Penerbit Universiti Kebangsaan Malaysia, 2013.
- S. Lau, M. S. Yusoff, Y.-Y. Lee, S.-B. Choi, J.-Z. Xiao, and M.-T. Liong, “Development and validation of a Chinese translated questionnaire: A single simultaneous tool for assessing gastrointestinal and upper respiratory tract related illnesses in pre-school children,” Journal of Taibah University medical sciences, vol. 13, no. 2, pp. 135-141, 2018.
- K. Shrotryia and U. Dhanda, “Content validity of assessment instrument for employee engagement,” Sage Open, vol. 9, no. 1, p. 2158244018821751, 2019.