
The Effects of Noise Pollution on the Prevalence of Hearing Loss on Workers in Select Industries in Nnewi, Anambra State
- Ogbo O. G
- Nnodu V. C
- Onuoha D. C
- 1932-1944
- Jul 19, 2024
- Health Education
The Effects of Noise Pollution on the Prevalence of Hearing Loss on Workers in Select Industries in Nnewi, Anambra State
Ogbo O. G, Nnodu V. C, and Onuoha D. C
Department of Environmental Management, Nnamdi Azikiwe University, Awka.
DOI: https://dx.doi.org/10.47772/IJRISS.2024.803141S
Received: 30 May 2024; Revised: 17 June 2024; Accepted: 21 June 2024; Published: 19 July 2024
ABSTRACT
The rapid industrialization in Nnewi, Anambra State, has raised significant environmental concerns, particularly noise pollution, which poses severe health risks to industrial workers. This study investigates noise pollution levels and the prevalence of hearing loss among workers in three major industries in Nnewi. Employing a cross-sectional design, the study uses clinical diagnostic approaches and survey methodologies to assess 71 workers with over five years of exposure to industrial noise. Ambient noise was measured with a sound level meter, hearing acuity was assessed through the Rinne and Weber tests, and structured questionnaires were used to collect demographic data, noise exposure details, and PPE usage. Findings reveal that Industries A and B have noise levels averaging 96 dB, significantly higher than Industry C’s 90 dB. PPE usage was inconsistent, with Industry B showing the highest compliance. Despite the high noise levels, only one respondent showed signs of hearing loss. This low incidence is attributed to intermittent noise exposure and the practice of taking regular breaks. The study underscores the need for enhanced regulatory enforcement, modernization of industrial equipment, improved PPE usage, and comprehensive noise management plans to mitigate health risks associated with industrial noise exposure.
Keywords: Noise Pollution, Hearing Loss, Industrial Workers, Personal Protective Equipment (PPE). Occupational Health
BACKGROUND
In the bustling industrial hub of Nnewi, Anambra State, the rapid expansion of manufacturing activities has precipitated a host of environmental concerns, with noise pollution emerging as a particularly egregious offender. Defined as unwanted or harmful outdoor sound created by human activities, noise pollution not only disrupts daily living but also poses significant health risks, particularly in occupational settings (Bacosa, Cesario, & Baldovino, 2018). The phenomenon of noise pollution is not merely an annoyance but a pervasive environmental health hazard, affecting both physiological and psychological well-being.
The distinction between sound and noise lies in the perception of these auditory phenomena. Sound becomes noise when it is undesired, interfering with normal activities or leading to health deterioration (Melnick, 1979). This is particularly relevant in industrial contexts where machinery and production processes generate substantial noise levels. In Nnewi, the concentration of industries ranging from vehicle assembly to electrical and food processing significantly contributes to local noise levels. These industries utilize a variety of heavy machinery such as riveting guns, stamping presses, and power saws, which are potent sources of chronic noise exposure (Ganiyu & Ogunsote, 2010; Reza & Rahman, 2016). While the generated noise levels are dangerous to the general public at large, workers working in these industries bear the burden of the problem. While the generated noise levels pose a danger to the general public, it is the workers in these industries who bear the brunt of the problem. They are exposed to high levels of noise for extended periods, which can lead to serious health issues such as hearing loss, stress, and sleep disturbances. Additionally, the constant exposure to loud noise can impair communication and concentration, increasing the risk of accidents and injuries on the job (Ogbo et. al., 2024).
The global scale of occupational noise exposure is alarming, with millions exposed to hazardous noise levels that exceed those recommended by health organizations worldwide (NIOSH, 1998; WHO, 2001). In developing countries, the situation is dire, with industrial noise levels often being well beyond safe limits, posing serious risks to workers’ health (Mithanga, Gatebe, & Gichuhi, 2013).
In Nigeria, despite established guidelines by the National Environmental Standards and Regulations Enforcement Agency (NESREA), enforcement remains lax, and the actual noise conditions within industries often surpass the regulatory thresholds (NESREA, 2009; Onuu & Akpan, 2006).
The primary health concern associated with chronic noise exposure in industrial settings is hearing impairment, including conditions such as tinnitus and permanent hearing loss. These conditions are typically precipitated by prolonged exposure to noise above 85 decibels (dB), a threshold recognized by international health agencies as potentially harmful (NIOSH, 1998; WHO, 2001). Empirical studies have consistently demonstrated a strong correlation between long-term noise exposure and the incidence of auditory damage among industrial workers (Shi et. al, 2023).
Despite the well-documented risks, the use of personal protective equipment (PPE) such as earplugs remains inconsistent among workers. Reports suggest that discomfort and communication challenges on noisy production floors lead to sporadic use of earplugs, thereby increasing the risk of hearing loss. This situation is exacerbated by the typical duration of exposure, with many workers in Nnewi engaging with high-decibel environments for prolonged periods, often exceeding the work shifts prescribed under safe noise exposure limits.
The regulatory landscape in Nigeria provides a framework for addressing occupational noise exposure, with standards established by various national and international bodies aimed at safeguarding workers’ health. These include the permissible exposure limits set by NESREA, which specify maximum noise levels for different industrial zones (NESREA, 2009). However, the effectiveness of these regulations is undermined by weak enforcement and compliance issues, particularly in less developed regions where industrial growth outpaces environmental governance.
This study seeks to address the gap in knowledge regarding the actual noise exposure levels in Nnewi’s industries and their health implications, particularly focusing on hearing impairment. The investigation will involve detailed noise level assessments across various manufacturing sectors in Nnewi and evaluate the prevalence of auditory health issues among the workers. This approach is informed by the hypothesis that sustained exposure to noise levels exceeding 85 dB(A) is positively correlated with a higher incidence of hearing loss among industrial workers in this region.
The significance of this research lies in its potential to inform policy and occupational health practices in Nnewi and similar industrial settings. By providing empirical data on the extent of noise exposure and its health impacts, the study aims to catalyze improvements in regulatory enforcement and worker protection strategies. Moreover, this research will contribute to the broader discourse on occupational health and safety in developing countries, offering insights into the challenges and opportunities for mitigating environmental health risks in rapidly industrializing regions.
MATERIALS AND METHODS
Study Design and Data Collection
This study employs a clinical diagnostic approach and a survey methodology within a cross-sectional design to assess the prevalence of hearing loss among workers in selected industries in Nnewi, Anambra State, Nigeria. The target population is made up of 110 workers from three major industries in Nnewi, Anambra State. These industries were selected based on their high usage of heavy machinery known to produce substantial noise levels and high number of workers in the production floor. A purposive sampling technique was then used to select 71 workers who had at least five years of experience on the production floors of these industries, ensuring substantial exposure to industrial noise. Control groups were selected from less noisy administrative department with doors constantly shut within the same companies to provide comparative data.
Data collection utilized the following instruments:
- Sound Level Meter: To measure ambient noise levels on the production floors, providing baseline data for noise exposure.
- Tuning Fork: Employed to conduct Rinne and Weber tests to evaluate hearing acuity and detect any impairments potentially caused by noise exposure.
- Structured Questionnaire: Administered to gather demographic information, personal and workplace noise exposure details, usage of personal protective equipment and to deploy the NIDCD Hearing loss assessment test.
Data collection was conducted during specific shifts to ensure consistency, with noise levels and health assessments, including hearing tests, performed simultaneously. Each participant underwent hearing assessments using the tuning fork tests, supplemented by the questionnaire to gather subjective data on hearing concerns and noise exposure experiences.
RESULTS
Noise level measurement
The noise levels at the three industries were measured in dBA for a three-day period and was averaged. These measurements were carried out on Mondays, Wednesdays and Fridays for the three industries simultaneously for three weeks in accordance to the study done by Nadir, Yasmeen, Chen, Dongsheng and Ghufran (2018). The Rinne and Weber tests for hearing acuity was also conducted at the same time.
Levels of noise pollution in the industry
The noise level from the industries is presented below
Table 1: Levels of noise pollution in the industry
| S/N | Industry | Day 1 (Leq) | Day 2 (Leq) | Day 3 (Leq) | Mean Value (Leq) | Control/office area (Leq) |
| 1. | A | 96.4 | 96.6 | 95.2 | 96.2 | 80.3 |
| 2. | B | 96.2 | 95.8 | 97.6 | 96.5 | 86.7 |
| 3. | C | 90.1 | 89.6 | 90.6 | 90.1 | 85.9 |
Source: Researchers Field Study
Table 1 shows that industry C had a mean noise level of 90.1 dB, making it the quietest among the three industries. The office area of the industry C, which served as the control, had a noise level of 85.9 dB. Industry A had a mean noise level of 96.2 dB, and its office area, serving as the control, had a noise level of 80.3 dB. Industry B was the nosiest, with a mean noise level of 96.5 dB. The office area in the B complex, serving as the control, had a noise level of 86.7 dB.
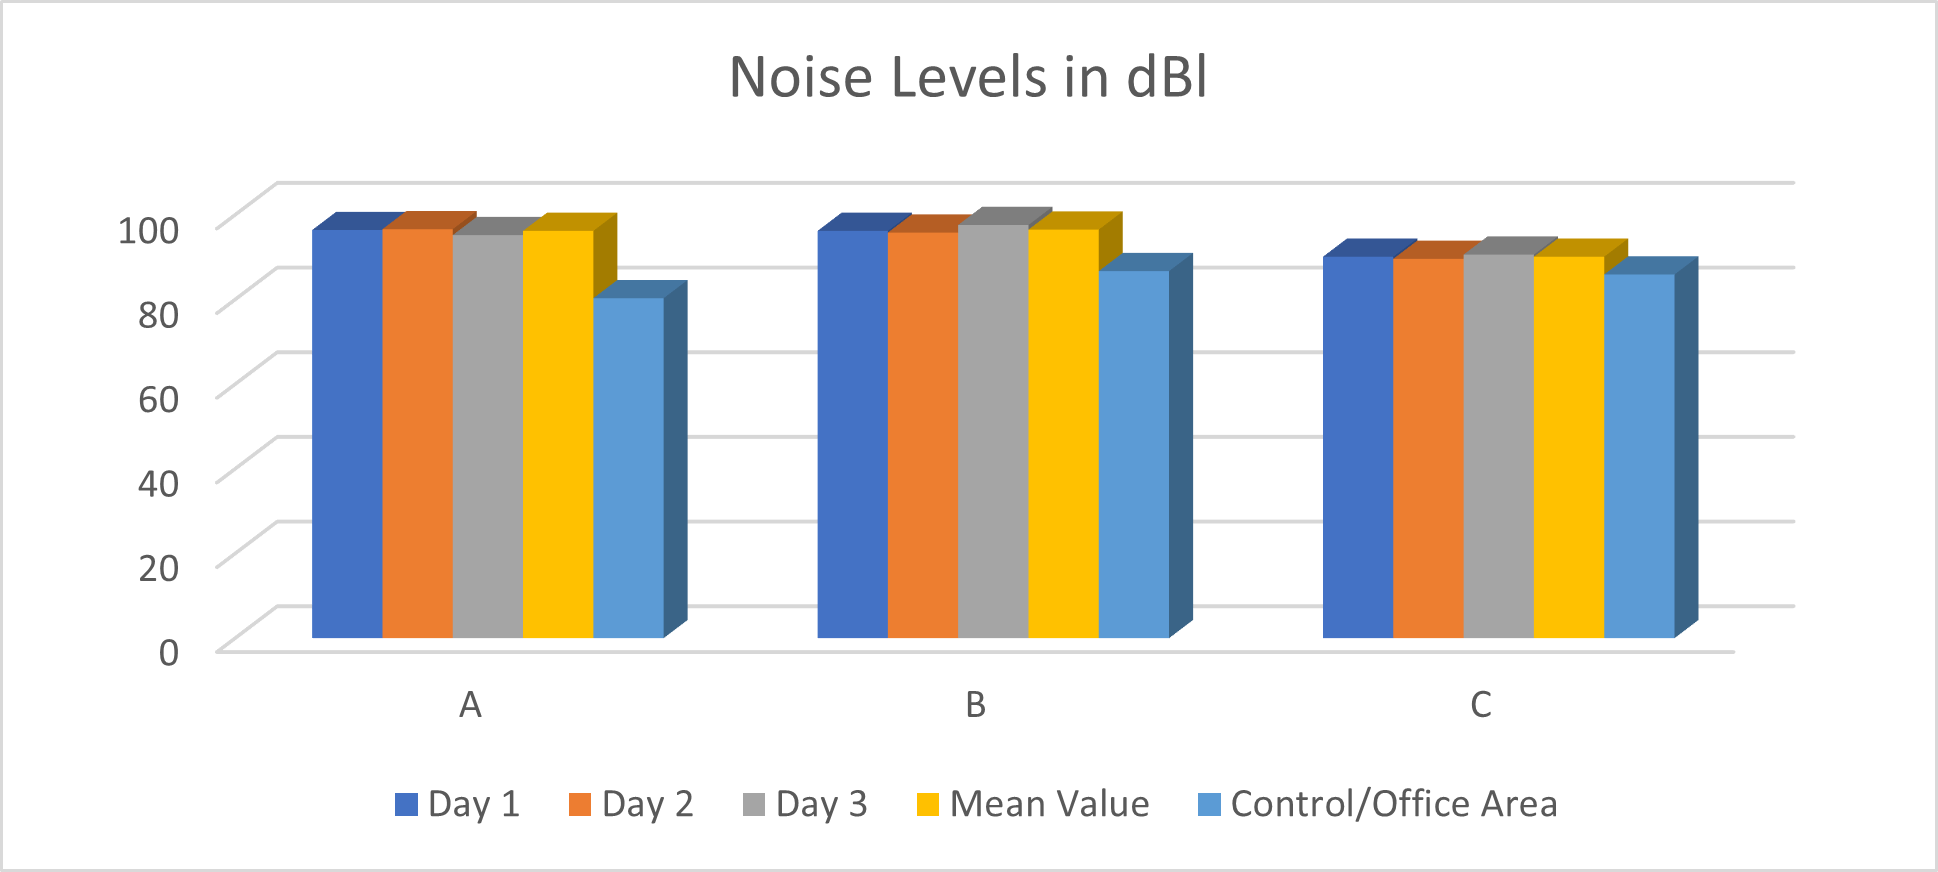
Figure 1: The noise levels in the industries represented in a bar chat.
Hearing loss assessment
Two hearing loss assessments were administered to the respondents viz a viz: The Rinne and Weber Screening test and the NIDCD hearing loss assessment test.
Rinne and Weber Screening
Rinne and Weber tests were performed by a physician on the respondents to determine the prevalence of sensorial hearing loss and the results are presented in Table 2.
Table 2: Rinne and Weber Screening test results
| A | B | B | ||||
| Respondents | Control | Respondents | Control | Respondents | Control | |
| Sensorial hearing loss | 0 | 0 | 1 | 0 | 0 | 0 |
Source: Researchers Field Survey
From Table 2, the Rinne and Weber Screening test results shows that just one respondent from industry B tested positive for sensorial hearing loss. None of the respondents from the other industries showed any sign of sensorial hearing loss. The table also shows that none of the respondents from the control group of all industries studied show any sign of sensorial hearing loss.
NIDCD hearing loss assessment
The second hearing acuity test administered to both the respondents and the control group for hearing loss assessment was developed by NIDCD and results gathered are presented in Table 3.
Table 3: NIDCD Hearing loss assessment
| SN | NIDCD Questions | A | B | C | |||||||||
| Respondents | Control | Respondents | Control | Respondents | Control | ||||||||
| Yes | No | Yes | No | Yes | No | Yes | No | Yes | No | Yes | No | ||
| 1) | Do you have a problem hearing over the phone? | 0 | 37 | 0 | 7 | 0 | 22 | 0 | 5 | 0 | 12 | 0 | 4 |
| 2) | Do you have a problem following the conversation when two or more people are talking at the same time? | 0 | 37 | 0 | 7 | 0 | 22 | 0 | 5 | 0 | 12 | 0 | 4 |
| 3) | Do people complain that you turn the TV volume too loud? | 0 | 37 | 0 | 7 | 1 | 21 | 0 | 5 | 0 | 12 | 0 | 4 |
| 4) | Do you have to strain to understand conversation? | 0 | 37 | 0 | 7 | 0 | 22 | 0 | 5 | 0 | 12 | 0 | 4 |
| 5) | Do you have problem hearing in noisy background? | 0 | 37 | 0 | 7 | 0 | 22 | 0 | 5 | 0 | 12 | 0 | 4 |
| 6) | Do you find yourself asking people to repeat themselves? | 0 | 37 | 0 | 7 | 1 | 21 | 0 | 5 | 0 | 12 | 0 | 4 |
| 7) | Do many people you talk to seem to mumble? | 0 | 37 | 0 | 7 | 0 | 22 | 0 | 5 | 0 | 12 | 0 | 4 |
| 8) | Do you misunderstand what others are saying and respond inappropriately? | 0 | 37 | 0 | 7 | 0 | 22 | 0 | 5 | 0 | 12 | 0 | 4 |
| 9) | Do you have problem understanding the speech of women and children? | 0 | 37 | 0 | 7 | 0 | 22 | 0 | 5 | 0 | 12 | 0 | 4 |
| 10) | Do people get annoyed when you misunderstand what they say? | 0 | 37 | 0 | 7 | 1 | 21 | 0 | 5 | 0 | 12 | 0 | 4 |
Source: Researchers Field Survey
Table 3 shows that one person from industry B reported frequently asking people to repeat themselves, being told they turn the TV volume too loud, and annoying others by misunderstanding conversations. No individuals from industries A or C, nor from the control group, indicated any signs of hearing loss according to the NIDCD test.
NIDCD Guideline analysis
The NIDCD hearing loss assessment guide is analyzed by determining those with positive response to 3 or more questions (total score of 3 or more out of the 10 questions, mean an indication for hearing loss). The analysis is presented in Table 4.
Table 4: NIDCD Guideline analysis
| SN | NIDCD guideline total | A | B | C |
| 1. | 0 – 2 | 37 | 21 | 12 |
| 2. | Above 2* | 0 | 1 | 0 |
Source: Researchers field survey and computation; *= Indication for hearing loss
From table 4, 1 person from industry B indicated a probable hearing loss problem from the three industries.
Questionnaire data
Job Duration of Workers in Years
Job duration of workers in years is given in table 4
Table 5: Job Duration of Workers in Years
| SN | Industry | 5-9 Years | 10-14 Years | Above 15 Years |
| 1. | A | 25 | 9 | 3 |
| 2. | B | 19 | 3 | 0 |
| 3. | C | 10 | 1 | 1 |
Source: Researchers field survey
Table 5 shows the tenure of workers in each industry. Industry A had 25 workers with 5 to 9 years of experience, 9 workers with 10 to 14 years, and 3 workers with 15 years or more. In industry B, 19 workers had 5 to 9 years of experience, 3 had 10 to 14 years, and none had 15 years or more. Industry C had 10 workers with 5 to 9 years, 1 worker with 10 to 14 years, and 1 worker with over 15 years.
Job duration of workers in days per week
Job duration of workers in days is given in Table 5
Table 6: Job duration of workers in days per week
| SN | Industry | 1 days | 2days | 3 days | 4 days | 5 days | 6 days | 7 days |
| 1. | A | 0 | 0 | 0 | 0 | 4 | 32 | 1 |
| 2. | B | 0 | 0 | 0 | 1 | 2 | 16 | 3 |
| 3. | C | 0 | 0 | 0 | 0 | 5 | 7 | 0 |
Source: Researchers field survey
Table 6 shows the number of days workers in each industry work per week. In industry A, 4 workers work 5 days, 32 work 6 days, and 1 works all 7 days of the week. Industry B has 1 worker who works 4 days, 2 who work 5 days, 16 who work 6 days, and 3 who work all 7 days of the week. In industry C, 5 out of 12 workers work 5 days, and 7 work 6 days. None of the industries had workers who work 1, 2, or 3 days a week, and only industry B had a worker who worked 4 days a week.
Job duration in hours per day
Table 7 shows how long workers are exposed to noisy machine per day while at work.
Table 7: Job duration in hours per day
| SN | Industry | Less than 2 hours | 2-5 hours | 5-8 hours | Over 8 hours |
| 1. | A | 0 | 0 | 26 | 11 |
| 2. | B | 0 | 0 | 15 | 7 |
| 3. | C | 0 | 0 | 10 | 2 |
Source: Researchers field survey
Table 7 shows that none of the workers in industries A, B, or C worked for less than 5 hours a day. In industry A, 26 workers worked between 5 to 8 hours a day, while 11 worked over 8 hours. In industry B, 15 workers worked between 5 to 8 hours, and 7 worked over 8 hours. In industry C, 10 workers worked between 5 to 8 hours, and 2 worked over 8 hours. Unstructured interviews revealed that those working between 5 to 8 hours a day mostly worked 8 hours, and none worked less than a seven-hour shift.
Use of hearing protection
Table 8 and 9 presents the data gathered on workers use of hearing protection. Table 8 presents the number of workers in each industry that makes use of a hearing protection devices and the type used while Table 9 presents data gathered on how long these devices are used while working on the factory floor.
Table 8: Use of hearing protection
| SN | Industry | Yes (%) | No (%) | Ear plug | Ear muffler | Others |
| 1. | A | 7 (18.92) | 30 (81.08) | 7 | Nil | Nil |
| 2. | B | 15 (68.18) | 7 (31.82) | 15 | Nil | Nil |
| 4. | C | 0 (0) | 12 (100) | Nil | Nil | Nil |
Source: Researchers field survey
Table 8 shows that in industry A, only 7 workers (18.92%) used hearing protective devices on the noisy production floor, all of which were ear plugs provided by management. In industry B, 15 out of 22 workers (68.18%) used ear plugs provided by management, while 7 workers (31.81%) did not use them, citing discomfort. In industry C, no workers used hearing protection, and none was provided by management.
Table 9: Duration of the use of hearing protection devices per day
| SN | Industry | Less than 5 hours | 6 hours | 7 hours | 8 hours | Above 8 hours |
| 1. | A | 7 | Nil | Nil | Nil | Nil |
| 2. | B | 15 | Nil | Nil | Nil | Nil |
| 4. | C | Nil | Nil | Nil | Nil | Nil |
Source: Researchers field survey
Table 9 shows that all respondents from industries A, B, and C who used company-provided hearing protection devices indicated they used them for less than 5 hours per day.
Table 10: Possible Predisposition to Hearing Loss
| S/N | Industries | Serious Head injury | Serious ear infection | Viral Infection | Meningitis | Others | Members of family with previous health infection |
| 1. | A | 0 | 0 | 0 | 0 | 0 | 0 |
| 2. | B | 0 | 0 | 0 | 0 | 0 | 0 |
| 3. | C | 0 | 0 | 0 | 0 | 0 | 0 |
Table 10 shows that no respondents had a family history of hearing loss, nor did any family members have past hearing issues. Additionally, none of the respondents had a history of serious head injury, ear infection, viral infection, or meningitis. Therefore, there is no reason to assume any respondents are predisposed to hearing loss due to these factors.
DISCUSSION OF THE FINDINGS
Discussion of Findings on Noise Pollution Levels in Industry A, Industry B, and Industry C
The noise levels at Industry A, Industry B, and Industry C were 96.2 dB, 96.5 dB, and 90.1 dB, respectively. Data collected showed that noise pollution at Industry A ranged between 95.2 dB and 96.6 dB, with the control area at 80.3 dB. The office buildings, with windows and doors shut, were about 80 meters from the production floor to control the noise.
At Industry B, noise levels ranged from 95.8 dB to 97.6 dB, with the control area recording 86.3 dB. These offices, located within the factory floor, were soundproof and air-conditioned. Both Industry A and Industry B used older machines, producing significant noise despite being in good working condition.
Industry C, with newer production facilities, had lower noise levels ranging from 89.6 dB to 90.6 dB, with the control area at 85.9 dB. Unlike Industries A and B, Industry C did not use cutting tools or stamping presses, which significantly reduced noise levels.
The differences in noise levels are consistent with studies indicating that equipment type and production processes significantly affect noise pollution (Mayowa, Babajide, & Ayomide, 2017). Noise levels in these industries align with those recorded in similar industries in other developing nations (WHO, 2001; Mithanga et. al., 2013).
At 96 dB and above, the factory floors of Industries A and B are twice as loud as that of Industry C, operating at 90 dB. According to McBride (2010), sound intensity doubles every 3 dB. Considering the time-intensity trade-off (NIOSH, 1998; NESREA, 2009; ILO, 2019), workers in Industries A and B should spend less time at their workstations compared to those in Industry C. The Occupational Safety and Health Administration recommends a permissible exposure limit of at most 4 hours in such noisy conditions. However, data showed that all workers in the three industries work more than a 5-hour shift daily. NESREA guidelines suggest that at a noise level of 97 dB, workers should only work a maximum of 30 minutes a day and 2.5 hours a week.
Workers in all three industries are at risk of speech interference, sleep disturbance, activity interference, and annoyance in the short term, and Noise-Induced Hearing Loss (NIHL) in 20 to 40 years. They are also at risk of physiological effects such as hypertension and cardiovascular disease in 30 years, and psychological/mental illness/stress over the short to long term (Akpan 2018; WHO, 1999; OSHA, 1983). Although this study did not cover home activities and noise exposure, it is assumed that these workers live in noisy environments, further increasing their susceptibility to noise-induced health problems.
Discussion of the Findings on Industry Workers’ Use of Personal Protective Equipment
Data showed that only 7 out of 37 respondents (18.92%) used personal protective equipment (ear plugs) in Industry A. In Industry C, none of the respondents used PPE. Industry B had the highest use of PPE, with 15 out of 22 respondents (68.18%) using ear plugs. Further inquiry revealed that ear plugs were provided to all workers on the production floor in both Industry A and Industry B. However, many workers did not use them because they found them uncomfortable and felt they hindered communication. Workers had to physically alert each other by touch and remove an ear plug to communicate, disrupting their tasks. This finding is consistent with Nwali and Agunwamba (2005), who discovered that industry workers often did not use ear protection provided by management, although they might wear them occasionally, especially when supervisors or Health Safety and Environment (HSE) officers were present.
Discussion of Findings on the Prevalence of Hearing Loss Among Workers in the Production Section and Control Group with Five Years or More in the Three Industries
Hearing loss can result from various factors, including age, noise exposure, otologic diseases, head injuries, genetic factors, and drugs (Gómez-Álvarez et al., 2023). In this study, none of the respondents or control group indicated any predisposition to hearing loss other than exposure to loud noise, primarily from their workplace.
Data collected showed that only one respondent across all three industries exhibited signs of hearing loss, as revealed by the Rinne and Weber Screening test. Similarly, the NIDCD Hearing Loss Assessment confirmed that only one out of 71 respondents showed symptoms of hearing loss. This finding contrasts with the study by Ibrahim et al. (2014), where 33% of workers examined had defects in their left or right ear.
Despite the high levels of noise pollution in the industries, respondents indicated that their duties sometimes required them to leave the factory floor, exposing them to intermittent rather than constant loud noise. This intermittent exposure might explain the low incidence of hearing loss. According to NESREA, workers can be exposed to noise levels above 94 dB for a maximum of one hour at a time. Regular breaks or leaving the noisy environment before this duration might prevent hearing damage despite the high noise levels.
The WHO (2015) suggests that taking breaks every 47 minutes when exposed to noise levels of 95 dB can help ears adjust and recover. Although this guideline is not exact, it emphasizes the importance of intermittent breaks to prevent hearing loss. This practice might explain the low prevalence of hearing loss among the workers, as they were not required to stay on the noisy factory floor all day.
Additionally, studies have shown that ears can recover from noise exposure if intermittent breaks are taken (Nordmann, Bohne & Harding, 2000; Heeringa & van Dijk, 2014; Le et al., 2017). Workers in all three industries acknowledged leaving the factory floor when the noise became unbearable. This practice of time-intensity trade-offs, whether intentional or not, contributed to the low incidence of hearing loss observed in the industries.
SUMMARY DISCUSSION
The findings from this study reveal critical insights into the levels of noise pollution and its impact on the health of workers in three industrial settings in Nnewi: Industry A, Industry B, and Industry C. The study highlights the persistent issue of occupational noise exposure, which remains a significant health hazard despite existing regulations and protective measures.
The analysis confirmed that Industries A and B exhibited exceptionally high noise levels, averaging around 96 dB, substantially above the recommended threshold of 85 dB set by international health agencies (NIOSH, 1998; WHO, 2001). Industry C, with newer machinery and different production processes, had lower noise levels, averaging 90 dB. These findings are consistent with Ganiyu and Ogunsote (2010) and Reza and Rahman (2016), who highlighted the substantial noise generated by older machinery and certain types of industrial equipment.
Despite the availability of ear plugs, their usage among workers was inconsistent. Only 18.92% of workers in Industry A and 68.18% in Industry B used PPE, while none in Industry C did so. The primary reasons cited for not using ear plugs were discomfort and communication barriers, aligning with the findings of Nwali and Agunwamba (2005). This sporadic use of PPE indicates a significant gap in effective hearing protection, exacerbating the risk of noise-induced hearing loss.
Surprisingly, the prevalence of hearing loss among workers was low, with only one respondent showing signs of hearing impairment. This contrasts with previous studies, such as Ibrahim et al. (2014), which reported higher rates of hearing defects among industrial workers. The low incidence of hearing loss despite the high noise level could be attributed to intermittent noise exposure, as workers often leave the noisy environments for quieter areas, reducing continuous exposure to harmful noise levels. This practice is supported by guidelines from WHO (2015) and NESREA, emphasizing the importance of regular breaks to mitigate noise damage.
The study reaffirms that workers are still at risk for long-term health effects, including hearing loss, hypertension, cardiovascular diseases, and psychological stress, due to sustained noise exposure. The findings also underscore the challenges in regulatory compliance, with NESREA guidelines often being inadequately enforced. This weak enforcement exacerbates the health risks, as industries frequently surpass the safe noise exposure limits, a concern echoed by Onuu and Akpan (2006).
The study highlights the urgent need for improved noise control measures and stricter enforcement of existing regulations to protect workers’ health. Updating industrial machinery, enhancing the design of production processes, and ensuring consistent use of PPE are critical steps. Moreover, increasing awareness and training among workers about the importance of hearing protection could mitigate the adverse health impacts of noise pollution.
While the current prevalence of hearing loss among workers in Nnewi’s industries is relatively low, the high levels of noise pollution and inconsistent use of PPE pose significant long-term health risks. The study calls for a more robust regulatory framework and better occupational health practices to safeguard workers, thereby contributing to the broader discourse on industrial health and safety in developing regions.
The findings highlight the critical need for effective noise control measures and increased PPE usage in noisy industrial environments. While the low prevalence of hearing loss among workers is encouraging, the potential for long-term health risks remains a significant concern. Industries should consider updating machinery, implementing noise reduction strategies, and encouraging consistent use of PPE to protect workers’ hearing and overall health. Regular breaks and intermittent exposure, as observed in this study, should be part of the standard practice to mitigate the risks associated with high noise levels.
RECOMMENDATIONS
Regulatory bodies such as NESREA must enhance their enforcement mechanisms to ensure compliance with established noise exposure limits. Regular inspections and penalties for non-compliance can drive industries to adopt better noise control practices. Industries should invest in modern, low-noise machinery and upgrade their production processes to reduce overall noise levels. This can be achieved through government incentives and support programs aimed at industrial modernization. It is crucial to increase the adoption of PPE among workers through regular training and awareness programs that emphasize the importance of hearing protection. Providing more comfortable and effective PPE can further encourage consistent use.
Industries should implement engineering controls such as soundproofing, regular maintenance of machinery, and the use of noise barriers. Administrative controls, such as rotating workers to limit their noise exposure time, should also be considered. Regular auditory health screenings for workers can help in early detection and management of hearing loss, preventing long-term health complications and improving overall worker well-being. Continuous education on occupational health and safety, focusing on the risks of noise exposure and the benefits of protective measures, can empower workers to take personal responsibility for their hearing health.
Industries should develop and implement a comprehensive noise management plan that includes periodic noise assessments, worker training, and effective communication strategies to address noise-related issues promptly. By addressing these recommendations, industries in Nnewi and similar industrial regions can significantly reduce the health risks associated with noise pollution, ensuring a safer and healthier working environment for their employees. The findings from this study can serve as a catalyst for policy improvements and the adoption of best practices in occupational health and safety, contributing to the overall well-being of workers in developing regions.
CONCLUSION
This study has highlighted the critical issue of noise pollution in the industrial hub of Nnewi, Anambra State, with a particular focus on three key industries: Industry A, Industry B, and Industry C. The investigation revealed that noise levels in Industries A and B significantly exceed safe thresholds, posing serious health risks to workers, despite the relatively lower noise levels in Industry C. The findings indicate that while the use of personal protective equipment (PPE) is inconsistent, it is essential for mitigating the risk of noise-induced hearing loss (NIHL) and other health complications.
The analysis underscores the importance of effective noise control measures and the need for stringent regulatory enforcement to protect workers from the adverse effects of chronic noise exposure. The study also reveals a gap in worker awareness and compliance regarding the use of hearing protection, further exacerbating the potential for long-term health issues.
REFERENCES
- Akpan, A. O. (2018). Environmental Noise Pollution and Impact in Major Markets of Akwa. Global Journal of HUMAN-SOCIAL SCIENCE: B, 18(1). Retrieved from https://globaljournals.org/GJHSS_Volume18/1-Environmental-Noise-Pollution.pdf
- Bacosa F, Cesario Jr and Baldovino, M. (2018). Sound Energy: An Electric Source of Noise Pollution Based Power Bank. KnE Social Sciences. 3. 221. 10.18502/kss.v3i6.2382.
- Demain, H. (2014). Environmental Noise and Sleep Disturbances: A Threat to Health: Sleep Science. (7)1. 209-212.
- Fada Patience and Osiasanya Ayo. (2017). Effects of industrial noise pollution on the auditory performance and health status of industrial workers in Oluyole Industrial Estate, Ibadan, Nigeria. Academia Journal of Educational Research, 5(6), 092-100.
- Ganiyu, S. A. and Ogunsote, O. O. (2010). A Study of the Sources and Control of Environmental Noise Pollution on a Typical Street in Akure, Nigeria. A paper presented in an International Conterence organized by School of Environmental Technology, Federal University of Technology, Akure.
- Gómez-Álvarez M, Johannesen PT, Coelho-de-Sousa SL, Klump GM, Lopez-Poveda EA (2023). The Relative Contribution of Cochlear Synaptopathy and Reduced Inhibition to Age-Related Hearing Impairment for People With Normal Audiograms. Trends in Hearing. doi:10.1177/23312165231213191
- Heeringa AN, and Van Dijk P (2014). The dissimilar time course of temporary threshold shifts and reduction of inhibition in the inferior colliculus following intense sound exposure. Hear Res. 312: 38–47. 10.1016/ 2014.03.004.
- Ibrahim, Aremu, Adeniyi, Ajao and Ojelabi, (2015). Evaluation of Noise Pollution and Effects on Workers during Wheat Processing. Journal of Applied Sciences and Environmental Management. 18. 599. 10.4314/jasem.v18i4.6.
- International Labor Organization. (2019, December 24). C148 – Working Environment (Air Pollution, Noise and Vibration) Convention, 1977 (No. 148). Retrieved from International Labor Organization web site: https://www.ilo.org/dyn/normlex/en/f?p=NORMLEXPUB:12100:0::NO::P12100_ILO_CODE:C148
- Ityavyar, E. M., and Tyav, T. T. (2012). Environmental Pollution in Nigeria: The need for awareness. Journal of research in Forestry, Wild life and environment, 4(2).
- Kimani, M.J. (2011). Evaluation of Occupational Noise Exposure among Workers in Metal fabricating sector in Kamukunji Nairobi. A thesis submitted in partial fulfillment for the degree of Master of Science in Occupational Safety and Health in Jomo Kenyatta University of Agriculture and Technology.
- Mayowa Jacob Owoyemi, Babajide Charles Falemara, and Ayomide Joseph Owoyemi (2017), Noise Pollution and Control in Mechanical Processing Wood Industries, Biomedical Statistics and Informatics. Vol. 2, No. 2, 2017
- McBride, D. (2010). Noise effects and duration. Guideline or diagnosing occupational noise-induced hearing loss. University of Otago. Retrieved from: http://www.acc.co.nz/PRD_EXTCSMP/ groups/ external communications/documents/reference_tools /wpc091005 .pdf.
- Melnick, W. (1979). Hearing loss from noise exposure, Handbook of Noise Control. Mc. Grow Hill, New York, 15, 1.
- Mithanga, J., Gatebe, E., and Gichuhi, M. (2013). Evaluation of Noise Levels in Manufacturing Sectors in Thika District, Kenya. Unpublished MSc thesis, Juja: Jomo Kenyatta University of Agriculture and Technology.
- National Environmental Standards and Regulations Enforcement Agency (NESREA) (2009) National Environmental (Noise Standards and Control) Regulations, 2009. S. I. No. 35.
- National Environmental Standards and Regulations Enforcement Agency (NESREA) (2009) National Environmental (Noise Standards and Control) Regulations, 2009. S. I. No. 35.
- National Health and Nutrition Examination Surveys (NHANES) (1973). The 1971-1973 NHANES I Linked Mortality Files. Retrieved from https://wwwn.cdc.gov/nchs/nhanes/Search/DataPage.aspx?Component=Questionnaire&CycleBeginYear=1999. June 2019
- National Institute for Occupational Safety and Health (NIOSH), (1991). Criteria for a recommended standard: Occupational noise exposure. Revised criteria 1998. Cincinnati: OH, National Institute for Occupational Safety and Health Retrieved from: http://www.cdc.gov/niosh/2014-126.html.
- National Institute on Deafness and Other Communication Disorders (2014). Noise induced hearing loss. Available at: https://www.nidcd.nih.gov/health/noise-induced-hearing-loss. Updated: February 7, 2017
- NHANES (2004). The 1999-2004 (NHANES 1999-2004) Linked Mortality Files. Retrieved from https://www.cdc.gov/nchs/data/datalinkage/nh99+_mort_file_layout_public_2010.pdf
- NIOSH. (1998). Criteria for a recommended standard: Occupational noise exposure. Revised criteria 1998. Cincinnati: OH, National Institute for Occupational Safety and Health Retrieved from: http://www.cdc.gov/niosh/2014-126.html.
- NIOSH. (1998). Criteria for a recommended standard: Occupational noise exposure. Revised criteria 1998. Cincinnati: OH, National Institute for Occupational Safety and Health Retrieved from: http://www.cdc.gov/niosh/2014-126.html.
- Niquette, P.A., (2013). Noise Exposure: Explanation of OSHA and NIOSH Safe – Exposure Limits and the Importance of Noise Dosimeter. New Jersey: Etymotic Research Inc.
- Nwali, E.I. and Agunwamba, J.C. (2005) Analysis of the environmental and socio-economic impact of noise pollution in eleme
- Ogbo, O. G, Onuoha, D. C, Okonkwo, U. C. and Amaechi, M. (2024) The Effects of Noise Pollution on the Prevalence of High Blood Pressure and Abnormal Pulse Rate on Workers in select Industries in Nnewi. International Journal of Environment and Pollution Research, 12 (2). pp. 58-74.
- Onuu M. U and Akpan A. (2006) Industrial Noise in Nigeria: Measurements, Analysis, Dose and Effects. Retrieved from https://www.researchgate.net/publication/239433242_Industrial_ Noise_in_Nigeria_Measurements_Analysis_Dose_and_Effects
- Reza, S. and Rahman, M. (2016). Status of noise pollution: A case study on Industries, Hospitals and Bus stations in Gazipur City Corporation.
- Shi, D., Lam, B., Gan, W. S., Cheer, J., & Elliott, S. J. (2023, November). Active noise control in the new century: The role and prospect of signal processing. In INTER-NOISE and NOISE-CON Congress and Conference Proceedings (Vol. 268, No. 3, pp. 5141-5151). Institute of Noise Control Engineering.
- WHO, (2011) Burden of disease from environmental noise. Retrieved from: http://www.who.int/quantifying_ehimpacts/publications/e94888.pdf?ua=1
- World Health Organization (WHO), (2001). Occupational and community noise (Fact Sheet No. 258), Geneva: World Health Organization.
- World Health Organization (WHO). (2017, December 27). About World Health Organization: Constitution. Retrieved from World Health Organization: http://www.who.int/governance/eb/constitution/en/