
The Impact of Capital Structure on Firm Financial Performance in Oil and Gas Sector in Sultanate of Oman
- Aaisha Hilal Abdullah Al Balushi
- Alya Ali Abdullah Al Balushi
- Dr. Shahnawaz Ali
- 3028-3046
- Jul 23, 2024
- Accounting & Finance
The Impact of Capital Structure on Firm Financial Performance in Oil and Gas Sector in Sultanate of Oman
Aaisha Hilal Abdullah Al Balushi1 Alya Ali Abdullah Al Balushi2 Dr. Shahnawaz Ali3
1&2Student, AFS Department, Oman College of Management and Technology, Muscat, Oman
3Assistant Professor, AFS Department, Oman College of Management and Technology, Muscat, Oman
DOI : https://dx.doi.org/10.47772/IJRISS.2024.806230
Received: 24 May 2024; Revised: 05 June 2024; Accepted: 10 June 2024; Published: 23 July 2024
ABSTRACT
This study examines the relationship between capital structure and financial performance within the oil and gas sector in the Sultanate of Oman, focusing on companies listed on the Ministry of Energy and Minerals over the period of 2021-2023. The research investigates how different capital structure components, such as debt-to-equity ratio, leverage, and debt maturity, influence various financial performance indicators, including profitability, liquidity, and shareholder value. The study aims at offering insights into the best capital structure strategies for oil and gas firms in Oman to improve their financial performance and sustainable growth using quantitative analysis methodologies, such as regression analysis and financial ratio analysis. It is anticipated that the research’s conclusions will add to the body of knowledge already available on capital structure and financial performance, with important ramifications for investors, financial managers, legislators, and other industry participants in Oman’s oil and gas sector and beyond.
INTRODUCTION
The choice of capital structure is a complicated matter with many facets that is affected by both internal and external variables. Conventional capital structure theories, like the Modigliani-Miller theorem, contend that, in perfect circumstances, the capital structure has no bearing on the firm’s worth. But businesses deal with agency conflicts, taxes, bankruptcy expenses, and imperfect markets, all of which make capital structure decisions extremely important. Several industry-specific factors further complicate capital structure decisions in the context of Oman’s oil and gas sector. First, because oil and gas operations are capital-intensive, significant sums of money must be allocated to production, infrastructure development, and exploration. Because of this, businesses in this industry frequently take on a lot of debt to pay for their capital projects, which increases their financial leverage. Secondly, the oil and gas sector are highly susceptible to changes in regulations, geopolitical risks, and commodity price fluctuations. These variables may affect cash flows, profitability, and the ability of a company to repay debt, which may affect the capital structure choices of the company. For example, in times of low oil prices, businesses might choose more conservative capital structures with lower debt loads to reduce risk and maintain liquidity. Capital structure decisions are further complicated by Oman’s distinct regulatory framework, which includes state-owned enterprises and production-sharing agreements as means of government participation in the oil and gas sector. The cost and availability of debt and equity financing for oil and gas companies can be influenced by government policies, taxation, and subsidies, which can impact their capital structure strategies.
Although capital structure plays a crucial role in determining the value and performance of a firm, there is currently little empirical data regarding its effect on the financial performance of oil and gas companies in Oman. Few studies in this field have explicitly addressed the Omani context; most have concentrated on developed economies and other industries. Consequently, there is a lack of information in the literature about the connection between financial performance and capital structure in the Omani oil and gas industry. It is imperative to close this gap for a number of reasons. First off, considering the oil and gas industry’s strategic importance to Oman’s economy, policymakers can better develop industry-specific policies to foster competitiveness and sustainable growth by having a better understanding of capital structure dynamics and their effects on financial performance. Second, by optimising capital structure choices, oil and gas companies operating in Oman can improve their capacity to meet industry challenges and seize opportunities. Considering this, the goal of this study is to add to the body of knowledge already in existence by conducting an empirical investigation into the connection between capital structure and financial performance in Oman’s oil and gas industry. The study aims to provide insights into the factors influencing capital structure decisions and their effects on profitability, risk management, and overall firm value by analysing pertinent financial data and performance metrics. These kinds of insights are essential for helping to direct strategic decision-making and improving the sustainability and financial performance of Oman’s oil and gas companies.
Vijayakumar and Karunaiathal (2014) advocate for maintaining a balance between debt and equity to effectively manage risks, controls, and benefits, aligning with the trade-off theory. Despite the existence of numerous studies analysing the impact of capital structure on firms’ financial performance in various countries and industries, there is a dearth of similar research specifically focusing on the oil and gas sector. Results from existing research vary across countries and industries, highlighting the need for context-specific analysis (MWANGI ERIC, 2016). Thus, conducting research to analyse the impact of capital structures on oil and gas listed companies is essential. This research endeavour can provide valuable insights for managers, regulatory agencies, and investors in the field, helping them understand how capital structure decisions influence firms’ profitability and performance. By bridging this gap in the literature, the study aims to contribute to the body of knowledge in finance and facilitate informed decision-making within the oil and gas sector in Oman.
Research Questions
The research questions for this study are:
- What is the relationship between the firm’s capital structure and performance?
- Does increase / decrease of debt affect firm’s performance?
- Does changes in equity affect firm performance?
Research Objectives
The broad objective of this study is to explore the impact of capital structure on financial performance in oil and gas sector of Omani listed companies.
- To identify the relationship between the firm’s capital structure performance of Oman Oil and Gas listed companies.
- To examine the effect of debt level on firm performance.
- To examine the effect of equity level on firm performance.
Studying the impact of capital structure on the financial performance of companies in the oil and gas sector is of foremost importance, as it sheds light on how financial resources are distributed and managed and its impact on the final financial results of companies in this vital sector. Understanding capital structure contributes to identifying effective financing strategies that balance risks and returns, which contributes to enhancing confidence among investors and increasing the value of companies. Analysing the factors that affect the capital structure is essential for making future investment decisions based on accurate and objective foundations that enhance the growth and sustainability of this vital sector.
LITERATURE REVIEW
Introduction to Capital Structure
Muhammad, Shah, Islam (2014), explained that a capital structure is the type of financing methods used by a firm to raise capital such as the use of loans, equity, or hybrid securities to finance its assets or investments. (Muhammad, Shah, and Islam, 2014). Javad, Younas, Imran (2014) highlighted that a capital structure consists of long and short-term financing methods and argued it is hard job for managers to decide or maintain the same structure to minimise its costs and risks while maximising shareholder’s wealth. (Javed, Younas and Imran, 2014). Ebaid (2009) argues that it is critical to evaluate the capital structure of the firm continuously. He stated that firm’s debt level might increase, and this would be critical information for future project decisions. Furthermore, they highlighted the importance of knowing the relationship between debt levels and shareholders’ wealth to ensure the aim of shareholder maximisation is achieved (Ebaid, 2009).
Analysis of Capital Structure of firm performance Oil Marketing Companies (OMC’s)
Baah-Acquah, Freeman and Ellis (2017) With regards to the firm’s capital structure, the study employed short-term debt to total capital, long-term debt to total capital and total debt to total capital in comparison with return on assets (ROA), return on equity (ROE) and net profit margin (NPM). The study employed secondary data and the data was analysed using multiple regressions. The result revealed that short term debt to total capital, long term debt to total capital, total debt to total capital, firm size, and sales growth, have varying and mixed relationships with profitability in terms of return on asset, and return on equity of the Oil Marketing Companies (OMC’s). Basit and Irwan (2017) assessed the impact of capital structure on firm performance of Malaysia listed industrial product company. Convenience sampling technique was using in this research to select fifty industrial product companies listed in Bursa Malaysia main exchange market based on available of 2011 to 2015 annual report. The independent variables used in this research are debt to equity ratio, total debt ratio and total equity ratio. Return on asset (ROA), return on equity (ROE) and earning per share (EPS) are used as dependent variable to measure firm performance. Descriptive statistics and multiple regression are used in this research to analyses the data. This research found industrial product company are heavily rely on equity finance in their capital structure. Besides that, the regression result found debt to equity has negative impact on ROA, total debt ratio and total equity ratio has insignificant impact on ROA. Debt to equity has negative impact on ROE, total debt has positive impact on ROE and total equity has insignificant impact on ROE. Besides that, debt to equity has negative impact on ROE, total debt has positive impact on ROE and total equity has insignificant impact on ROE. Finally, debt to equity has a negative significant impact on EPS, total debt ratio has positive significant impact on EPS and total debt has insignificant impact on EPS.
Trade-off Theory
Trade-off theory introduced by Kraus and Litzenberger (1973) and later by Jensen and Meckling (1976) argues that firms with debt capital be offset against the tax shield gained from debt capital against the losses arising from debt capital such as financial distress and agency cost. Javed, Younas, Imran (2014) argue that trade-off theory can help firms decide how much equity and debt to use depending on the cost and benefits having such capital. They further explained that based on trade-off theory, should the firm be highly profitable, using debt financing would increase shareholders’ wealth and on the contrary if the firm has low profits, would increase the risks of bankruptcy. (Javed, Younas and Imran,2014) Modugu and Prince (2013) argue that trade-off theory helps firms to maximize value by having an optimal capital structure by setting targeted leverage ratios and increase or decrease gradually to achieve this (Modugu and Prince, 2013).
RESEARCH METHOD
Methodology is crucial for any academic research. This chapter serves as a representation of the framework that details how to conduct the research, gather data, and evaluate it methodically to guarantee the reliability and accuracy of the findings. The reader may better understand the research process, selected methodologies, and rationale for selecting them over others by consulting the methodology chapter. The reader should be given an overview of the study’s methodology and the measures taken to ensure the reliability and precision of the data; thus, it is crucial that the methodology be straightforward and clear in this context. This chapter includes elements such as research design, population and sampling, data collection, and data reliability and validity.
Research Design
The framework defining how the study will be conducted and the actions that will be done to achieve the research objectives precisely and successfully is known as the research design. As such, it is an essential component of the research process since it offers the general framework that directs every stage of the investigation, from issue definition to analysis and conclusion drawing.
The purpose of this study’s research design is to explore how capital structure affects the performance of companies in the oil and gas industry. Analyzing the relationships between capital structure, financial returns, financing capability, and capital investments is part of the design. The study employs an analytical methodology to gather financial data for organizations who are globally players in this industry. According to the research, capital structure and financial performance have a beneficial relationship that improves a company’s capacity for financing and investment.
The sampling process in this research is based on the specific research design. The research aims to understand the potential effects of capital structure on financial performance and is moving towards using a sampling strategy commensurate with this objective. It is necessary to define the target population, which includes companies operating in the oil and gas sector on a global level. This includes companies large and small, producing oil and gas and related energy services. In this context, the population is considered as the population of potential oil and gas companies from which data can be collected from Ministry of Energy and Minerals (MEM)
Based on this conceptualization, probability sampling can be used to identify a representative sample of these companies, enhancing the chance of obtaining results that generalize to the broader population. This approach provides an opportunity to investigate the relationship between capital structure and financial performance at a broad level, while reducing the potential for selection bias and enhancing the generalizability of the results. Therefore, the use of probability sampling can provide results with validity and objectivity, enhancing confidence in research conclusions and directions.
Data collection in the current research relies on the use of both primary and secondary data collection. Primary data collection involves collecting information directly from sources, such as the specific oil and gas sector companies included in the study. Specific financial data for these companies will be collected, including capital structure data, financial returns, and other relevant indicators. This data will help analyze the relationship between capital structure and financial performance. As for collecting secondary data, it will include making use of data already collected from various sources related to the financial and economic sectors in general, including general financial data for oil and gas companies available from sources such as financial databases and annual reports. By using both methods, comprehensiveness and diversity will be achieved in the data used, enhancing the accuracy and inferences of research on the impact of capital structure on the financial performance of oil and gas sector companies.
In the current research, validity and reliability are essential for measuring data. Validity means the ability of the measurement instrument to accurately measure what it is supposed to measure, such as capital structure. While reliability means the stability and consistency of measurement results when the tool is repeatedly applied to the same phenomenon and in the same circumstances. Validity and reliability must be understood and secured to ensure accuracy of results and reliability of research conclusions.
Research is a complex process that often requires the use of a research model to guide the collection and analysis of data. In this research model, both independent and dependent variables will be utilized to assess the data. (Brooke Reavey ,2023) The independent variable, which is the factor that is manipulated or controlled by the researcher, will be measured in relation to the dependent variable, which is the outcome or response that is being measured. The research model is constructed based on the evolution of prior research models that have been used in previous research connected to the independent and dependent variables. By building upon the foundations laid by previous research models, this research model aims to further our understanding of the relationship between the independent and dependent variables.
By using this research model, researchers can gather and analyze data in a systematic and structured way, ensuring that the results are dependable and valid. Overall, the research model serves as a roadmap for conducting research, guiding the researcher through the various stages of data collection and analysis.
Independent variables refer to the factors that are being manipulated or controlled in a research study. In the context of firm capital structure, independent variables such as the debt-to-equity ratio and the long-term debt to total assets ratio play a crucial role in determining the financial health and stability of a firm.
The debt-to-equity ratio, calculated by dividing total debt by total equity, provides insights into how a firm is financing its operations. (MacInnes,2019) A high debt-to-equity ratio indicates that the firm is heavily reliant on debt to fund its operations, which can increase financial risk and impact the firm’s ability to meet its financial obligations. On the other hand, a low debt-to-equity ratio may suggest that the firm is more financially stable and less risky.
Similarly, the long-term debt to total assets ratio, calculated by dividing long-term liabilities by total assets, measures the extent to which a firm’s assets are financed by long-term debt. A high long-term debt to total assets ratio may signal that the firm is heavily leveraged, which could limit its financial flexibility and ability to invest in growth opportunities.
By analyzing these independent variables, researchers and stakeholders can gain insights into a firm’s capital structure and make informed decisions about its financial health and stability. Ultimately, understanding and monitoring these variables are crucial for ensuring the long-term success and sustainability of a firm.
Debt to Equity Ratio
D/E = Total Debt
Total Equity
Long term Debt to Total Assets
LTDA = Long term Liabilities*100
Total Assets
In research studies, dependent variables are the outcomes or results that are being measured or studied. These variables are dependent on the independent variables, which are the factors that are being manipulated or controlled by the researcher.
Dependent variables are crucial in determining the impact or effect of changes in the independent variables. By examining how changes in the independent variables lead to changes in the dependent variables, researchers can draw conclusions about the relationship between the two. Dependent variables play a crucial role in research and analysis, particularly in the field of finance and accounting. (Dattalo,2013) These variables are used to measure the impact of independent variables on the outcome of interest. In the study conducted by Gansuwan and Önel (2012), accounting indicators were used as dependent variables to assess a firm’s performance.
These accounting ratios include Return on Equity (ROE), Return on Assets (ROA), Gross Profit Margin (GPM), Net Profit Margin (NPM), and Return on Capital Employed (ROCE). Return on Equity measures the profitability of a firm by comparing its net profit to shareholders’ equity. Return on Assets, on the other hand, evaluates how efficiently a company is utilizing its assets to generate profit.
Gross Profit Margin and Net Profit Margin indicate the profitability of a firm in terms of sales and revenue, respectively. Finally, Return on Capital Employed measures how effectively a company is utilizing its capital to generate profit. These dependent variables provide insight into several aspects of a firm’s financial performance and can help stakeholders make informed decisions about investing in or managing the company.
Overall, dependent variables such as these accounting ratios are essential tools for evaluating a firm’s financial health and performance. Researchers and analysts rely on these variables to draw meaningful conclusions about the impact of several factors on a company’s success.
Return on Equity
ROE = Earning after interest and Tax (Net Profit) *100
Equity
Return on Assets
ROA = Net Profit * 100
Total Assets
Gross Profit Margin
GPM = Revenue- COGS *100
Revenue
Net Profit Margin
NPM = Net Profit *100
Total Revenue
Return on Capital Employed
ROCE = Profit before interest and tax (PBIT) _________*100
Capital employed (Total Asset- Current Liability)
DATA ANALYSIS AND INTERPRETATION
AL Maha petroleum Company, Shell Oman Marketing Company and Musandam Power Company are mentioned throughout this chapter’s analysis and interpretation of data gathered from the Ministry of Energy and Minerals (MEM) for listed companies in Oman from 2021 to 2023.
Table 1: Al Maha petroleum financial Statement Details
| 2021 – RO’000 | 2022 – RO’000 | 2023 – RO’000 | |
| Total Assets | 136,697 | 151,543 | 166,504 |
| Total Equity | 44,096 | 47,528 | 47,976 |
| Total Revenue | 372,907 | 492,731 | 493,810 |
| Total Debt | 92,601 | 104,015 | 118,528 |
| Total Currant Liability | 88,443 | 97,617 | 112,125 |
| Total Non-Currant Liability | 4,158 | 6,398 | 6,403 |
| Cost of Goods Sold | 350,067 | 465,237 | 465,909 |
| Profit before Interest and Tax | 3,307 | 7,317 | 7,503 |
| Net Profit | 2,760 | 6,192 | 6,313 |
Source: Company website
Table 2: Musandam Power Financial Statement Details
| 2021 – RO’000 | 2022 – RO’000 | 2023 – RO’000 | |
| Total Assets | 94,174 | 96,642 | 71,114 |
| Total Equity | 11,137 | 11,687 | 11,689 |
| Total Revenue | 18,178 | 18,474 | 18,731 |
| Total Debt | 83,037 | 84,955 | 59,425 |
| Total Currant Liability | 23,786 | 28,407 | 5,887 |
| Total Non-Currant Liability | 59,251 | 56,548 | 53,538 |
| Cost of Goods Sold | 10,851 | 11,311 | 12,259 |
| Profit before Interest and Tax | 3,641 | 3,120 | 2,280 |
| Net Profit | 3,095 | 2,647 | 1,945 |
Source: Company website
Table 3: Shell Oman Financial Statement Details
| 2021 – RO’000 | 2022 – RO’000 | 2023 – RO’000 | |
| Total Assets | 141,447 | 164,493 | 167,767 |
| Total Equity | 53,500 | 55,606 | 53,509 |
| Total Revenue | 398,429 | 499,912 | 519,466 |
| Total Debt | 87,947 | 108,887 | 114,258 |
| Total Currant Liability | 60,079 | 72,725 | 76,711 |
| Total Non-Currant Liability | 27,868 | 36,162 | 37,547 |
| Cost of Goods Sold | 368,390 | 464,545 | 483,995 |
| Profit before Interest and Tax | 4,267 | 6,737 | 4,299 |
| Net Profit | 3,611 | 5,706 | 3,603 |
Data Analysis and Discussion & Interpretation
Table 4: Al Maha Petroleum Company Ratios
| Ratio | |||||||
| Years | ROE | ROA | GPM | NPM | ROCE | D/E | LTDA |
| 2021 | 6.3% | 2.0% | 6.1% | 0.7% | 6.9% | 2.10 | 3.0% |
| 2022 | 13.0% | 4.1% | 5.6% | 1.3% | 13.6% | 2.19 | 4.2% |
| 2023 | 13.2% | 3.8% | 5.7% | 1.3% | 13.8% | 2.47 | 3.8% |
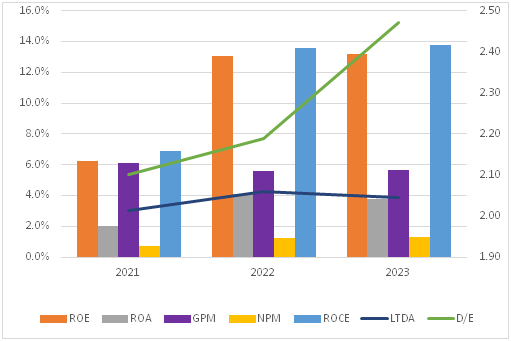
Figure 1: Al Maha Petroleum Company Ratios
[1]Note: All variables are in % expect D/E – which is read using secondary Axis.
ROE (Return on Equity)
The profitability of Al Maha in relation to shareholders’ equity is measured by ROE. There appears to be an indirect relationship between the D/E ratio in this instance. From 2021 to 2023, the D/E ratio rises along with ROE, suggesting that greater leverage may be having a beneficial effect on ROE.
ROA (Return on Assets)
The return on assets (ROA) measures how well Al Maha uses its resources to produce profits. There is a mixed relationship with the D/E ratio. From 2022 to 2023, it is comparatively stable, but there is an exceedingly small fall from 2021 to 2022. This implies that, in this situation, the D/E ratio may not have a major effect on ROA.
GPM (Gross Profit Margin)
Based on the financial data of Al Maha company, there is no obvious relationship between GPM and the D/E ratio. While GPM varies over time, it does not exhibit a continuous pattern in conjunction with changes in the D/E ratio.
NPM (Net Profit Margin)
After deducting all costs, NPM evaluates the portion of revenue that is converted into profit. As with GPM, the D/E ratio and NPM are not well correlated. While NPM varies over time, it does not follow a regular pattern in response to shifts in the D/E ratio.
ROCE (Return on Capital Employed)
ROCE gauges the effectiveness of Al Maha company’s capital investments. Like ROE, the D/E ratio has an indirect link. ROCE rises in tandem with the D/E ratio from 2021 to 2023, suggesting that higher Leverage may have a favourable effect on ROCE.
In conclusion, the information provided suggests that there could be a positive greater influence may be able to improve the correlation between the Debt-to-Equity ratio and Return on Equity (ROE) and Return on Capital Employed (ROCE). The Debt-to-Equity ratio and Return on Assets (ROA), Gross Profit Margin (GPM), or Net Profit Margin (NPM), however, do not appear to be significantly correlated. This implies that different measurements have varied effects of capital structure on financial performance. additional research must be done, and other factors must be considered to draw additional conclusions. definitive observations.
Table 5: Musandam Power Company Ratios
| Ratio | |||||||
| Years | ROE | ROA | GPM | NPM | ROCE | D/E | LTDA |
| 2021 | 27.8% | 3.3% | 40.3% | 17.0% | 5.2% | 7.46 | 63% |
| 2022 | 22.6% | 2.7% | 38.8% | 14.3% | 4.6% | 7.27 | 59% |
| 2023 | 16.6% | 2.7% | 34.6% | 10.4% | 3.5% | 5.08 | 75% |
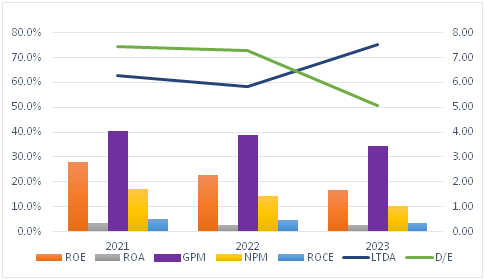
Figure 2: Musandam Power Company Ratios
[1]Note: All variables are in % expect D/E – which is read using secondary Axis.
Table 5 presents the financial ratios of Musandam Power Company over a three-year period. The ratios include Return on Equity (ROE), Return on Assets (ROA), Gross Profit Margin (GPM), Net Profit Margin (NPM), Return on Capital Employed (ROCE), Debt-to-Equity (D/E) ratio, and Long-Term Debt to Assets (LTDA) ratio. These ratios provide critical insights into the company’s profitability, efficiency, and leverage. Profitability ratios (ROE, ROA) and different efficiency and leverage ratios (GPM, NPM, ROCE, D/E, LTDA) typically interact. Increased profitability can have a favourable effect on ROE and ROA through higher GPM and NPM. An efficient use of capital is indicated by a high ROCE, which can have a beneficial impact on ROE and ROA. On the other hand, excessive debt (seen by higher D/E and LTDA ratios) can raise financial risk and impair ROE and ROA, particularly if the company finds it difficult to turn a profit large enough to pay off debt and interest.
Profitability ratios such as ROE and ROA show how effectively the company is generating profits from its assets and equity. In 2021, Musandam Power Company had an ROE of 27.8% and an ROA of 3.3%. However, these ratios showed a decline over the next two years, with ROE dropping to 16.6% in 2023. This downward trend could indicate a decrease in the company’s profitability and efficiency in using its assets.
The GPM and NPM ratios provide further insights into the company’s profitability. A higher GPM indicates that the company can generate more profit from its sales, while a higher NPM shows how efficiently the company is managing its expenses. The GPM and NPM ratios for Musandam Power Company declined over the years, singling potential challenges in maintaining profitability and controlling costs.
ROCE measures the efficiency of the company in using its capital to generate profits. A higher ROCE suggests that the company is effectively using its capital. In the case of Musandam Power Company, the ROCE ratio also showed a decline over the three-year period, which could indicate a decrease in the company’s operational efficiency.
Leverage ratios such as the D/E and LTDA ratios provide insights into the company’s financial risk and its ability to meet its debt obligations. A high D/E ratio indicates a higher level of debt relative to equity, which can increase the company’s financial risk. Musandam Power Company had a high D/E ratio throughout the three years, suggesting a significant level of debt that could impact its financial stability.
Overall, analysing these financial ratios can help investors and stakeholders understand the financial performance, efficiency, and risk profile of Musandam Power Company. By evaluating the intricate relationships between these ratios, one can gain valuable insights into the company’s financial health and make informed decisions regarding investment or partnership opportunities.
Table 6: Shell Oman Marketing Company Ratios
| Years | ROE | ROA | GPM | NPM | ROCE | D/E | LTDA |
| 2021 | 4.77% | 2.09% | 40% | 5% | 10.16% | 0.695 | 30.35% |
| 2022 | 9.25% | 3.99% | 55% | 8% | 10.44% | 0.678 | 29.20% |
| 2023 | 5.19% | 1.76% | 60% | 4% | 3.87% | 0.695 | 22.98% |
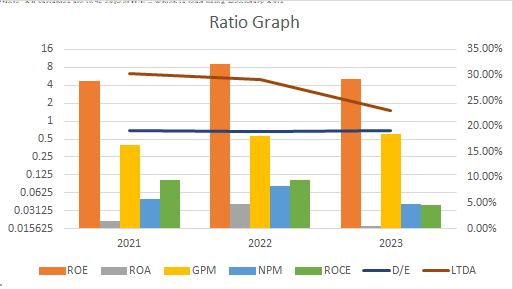
Figure 3:Shell Oman Marketing Company Ratios
Note: All variables are in % expect D/E – which is read using secondary Axis.[1]
ROE (Return on Equity)
While the profitability ratios for Shell Oman 2023 show an increased revenue compared to previous years, they still do not imply that the performance has been enhanced greatly. 2022 ROE of our company is 9.25%, which is 5.19% and 4.77% more than the one we had in 2023 and 2021, respectively.
ROA (Return on Assets):
This is an indicator that our company is better at turning the shareholders’ funds into profits. In the same way, the Return on Assets (ROA) has been on a positive side as it rose to 3.99% in 2022 from 2.09% in 2021 and 1.76% in 2023 showing higher profitability for being more efficient with the assets utilized.
GPM (Gross Profit Margin):
The Gross Profit Margin (GPM) of Shell Oman evaluates its earning from sales per annum after deducting the direct income costs incurred due to sale of goods. Through Oman Shell’s GPM (Gross Profit Margin) increased from 55% in 2022 to 60% in 2023 showing improved profitability. But it went down marginality by 40% in 2021.
After calculated this, we may assume that Shell Oman’s capacity of the profit from core business was raised in 2023 as a compare with what was last year. High GPM might indicate a search for cost-cutting or raise of prices for the products offered. Elements like efficiency of operations, pricing methods, and market conditions have an influence on game profitability (GPM).
There was a swing to more profitability in the company’s operating results in 2023, but there may be the need to plan for maintaining or even improving this GPM over time constantly.
NPM (Net Profit Margin)
NPM (Net Profit Margin), a financial ratio of foremost importance and meaning, expresses the percentage of the revenue retained by the company as the net income subtracting the total expenses. Shell Oman experienced the NPM level who shrank up to 5% in 2022. then be inclined for last three years. In 2023, NPM dropped to 4%, signifying a situation where the company’s still encountered losses more the income. Plausible sources of this negative margin are either prolonged mediocre performance or large impairment of the assets, thus leading to negative income in the reviewed period.
ROCE (Return on Capital Employee)
Return on Capital Employed (ROCE) is the bankable intelligence example employed in assessing a company performance and commercial efficiency in producing returns out of its capital implementations. For Shell Oman as is the case, ROCE of the years 2021, 2022, and 2023 is 10.16%, 10.44%, and 3.87% consecutively. ROCE is calculated by dividing EBIT by the expression consisting of both equity and debt, which is the CE.
Fluctuations in the ROCE trend for Shell Oman demonstrate that these have happened some years in the past, which indicate that the company shifts towards different levels of burden and capital efficiency. Go on, ROCE that are lower are one of the possible signs of mismanagement of capital or reduced effectiveness in comparison to the investments that were made.
The ROCE assessment brings to light stakeholders’ insight on the company’s financial performance, which is the outcome of managers’ capacity to create the necessary returns on investment.
Debt Equity
The debt-equity ratio determines financial vulnerability of a company by means of the company’s debt-to-shareholders equity ratio. This ratio represents a less than no debt system to finance things in general, which is somewhat of an ideal financial stability model.
Shell Oman had a declining debt equity ratio in 2022 with 0.678 down from 0.695 in 2021; this indicates falling debt comparability with equity. This phenomenon, in other words, indicates that Shell Oman has managed its debt efficiently over time or had its equity base enhanced. Unfortunately, it rose to 0.695% in 2023, which indicates that it’s in an unstable debt situation. Debt-to-Equity levels decline can make the company more resilient to the risk of recession and exercising a better ability to grow the business without the overload of debts on its balance sheet. To sum up the last few words, rate reflects negatively on Shell Oman’s strategies in financial management skills.
LTDA (Long Term Debt Ratio to Assets Ratio)
The Long-Term Debt to Asset (LTDA) ratio of Shell Oman over the last three years have increased in a way that more long-term debt type which manifests as a proportion of total assets was seen. There were 30.35% digital payments made in 2021. This figure went down to 29.20% in 2022 and more over to 22.98% in 2023. This tendency means Shell Oman do not use debt a lot to repay its assets. This debt is kept a long-term asset.
A (LTDA) ratio of six also has both good and bad consequences. On the one hand, it shows that the company considers a part of its assets to be used for the investment in plans for the development and new undertakings. For another point of view, however, a high debt to asset ratio can also denote high financial risk, which is countered by the fact that a considerable proportion of such debt is liable for repayment over a lengthy period.
FINDINGS AND CONCLUSION
The relationship between firm capital structure and firm performance has long been a topic of interest for researchers and practitioners in the field of finance. In this study, we have examined the financial analysis of prominent companies like Shell Oman, Al Maha Oil Company, and Musandam Power to understand the association between capital structure and firm performance. By looking at key financial indicators and ratios, we aim to uncover the factors influencing the financial health and operational efficiency of these companies.
Through our analysis, we have found that a company’s capital structure plays a significant role in shaping its strategic decisions, risk management practices, and overall performance. The leverage ratios, profitability measures, and efficiency ratios provide valuable insights into how financing decisions impact a firm’s ability to meet the demands of stakeholders and stay competitive in the industry.
Our findings highlight the importance of maintaining a balanced capital structure to ensure long-term sustainability and profitability. Investors, stakeholders, and industry professionals can benefit from the insights provided in this study to make informed decisions about the financial health and prospects of these companies. By understanding the dynamics of capital structure and firm performance, we can better navigate the complexities of the market and drive sustainable growth eventually.
Relationship between Firm Capital Structure and Firm Performance
From elaborating on Shell Oman’s financial ratios, the correlation between the company’s capital structure and its general operations becomes quite clear. The debt-to-equity ratio has revealed that companies have been making effective use of debt, and debt financing contributes to the growth of companies over time. Secondly, this higher capital ratio, although a source of additional financial resources, brings financial liabilities as well. The Times Interest Earned (TIE) Ratio, which indicates a downtrend, gives rise to a cause of concern. Shell Oman’s TIE in 2020 turned out negative, which indicates that the company’s income could not cover its interest expenses and, therefore, the company was under a severe financial pressure. This means that improving profitability becomes the top priority for the company to ensure that it will be able to pay back all its debts in a timely manner.
To understand the relationship between the firm’s capital structure and its performance, we need to analyse the company’s financial ratios and assess how they impact its operations.
One key aspect of the firm’s capital structure is its debt-to-equity ratio, which indicates the proportion of debt and equity used to finance the company’s operations. A higher debt-to-equity ratio suggests that the company relies more on debt financing, which can provide additional financial resources for growth. (Al Maha Oil Company,2004) However, it also exposes the company to financial risks and obligations in the form of interest payments and debt repayments. The Times Interest Earned (TIE) Ratio is another important metric to consider when evaluating a company’s performance. This ratio measures the firm’s ability to cover its interest expenses with its earnings. A declining TIE ratio can be a cause for concern, as it indicates that the company’s income may not be sufficient to meet its interest obligations. This puts additional pressure on the firm’s financial health and may lead to difficulties in meeting its debt obligations.
The relationship between a firm’s capital structure and its performance is crucial in determining the overall financial health and success of a company. Musandam Power, a leading power generation company in the region, has shown a strong correlation between its capital structure and performance metrics. Through an analysis of Musandam Power’s financial ratios, it is evident that the company has maintained a balanced capital structure with a healthy mix of debt and equity. (Supriati et al,2019) This has enabled the company to leverage debt as a source of financing for its expansion and growth initiatives. Additionally, the company’s return on assets (ROA) and return on equity (ROE) ratios have consistently been above industry averages, indicating efficient utilization of its capital resources.
Impact of Capital Structure on Firm Performance
Shell Oman’s capital structure impact as a performance indicator is visible in several fundamental sphere. The more you lever your debt the better, if it is within reasonable limits, for making debt-based transactions and companies’ development. Such a phenomenon may, on the one hand, ameliorate returns on equity (ROE) through the feature of magnifying the earnings: the table below demonstrates the augmentation of ROE in the years before 2020. On the other hand, though, the negative TIE ratio in 2020 indicates that the company is under financial stress (Bartiloro & di Iasio, 2011). Likewise, the profitability analysis including ROE, Return on Assets (ROA), and Profit Margin measures also revealed significant aggressive fluctuations, with the highest profitability decline during recent years. This decline might in part be paying for the increasing debt volume that relates to the higher interest expenses and general debt service flexibility.
Al Maha Oil Company
One key aspect of capital structure is the level of debt that a company takes on. By leveraging debt, companies can potentially increase returns on equity (ROE) and magnify their earnings. However, it is crucial to maintain a careful balance to ensure that debt levels are sustainable and do not hinder the company’s performance. Excessive debt can lead to financial stress, impacting the company’s ability to meet its financial obligations. Monitoring profitability measures such as ROE, (Almaha Oil Company,2004) Return on Assets (ROA), and Profit Margin can help identify trends or fluctuations that may result from changes in the capital structure. These indicators offer insights into how efficiently a company utilizes its resources to generate profits. The impact of capital structure on firm performance can also be observed in a company’s ability to manage cash flow, interest expenses, and debt service obligations. A well-structured capital mix provides flexibility and stability in managing these aspects, while an imbalanced capital structure can lead to difficulties in meeting financial commitments and adapting to market changes.
One of the key factors that can impact Musandam Power’s performance is the regulatory environment. The power generation industry is heavily regulated, with government policies and regulations often dictating the terms under which companies can operate. Changes in regulations, such as new emissions standards or renewable energy mandates, can significantly impact Musandam Power’s operations and bottom line. Adapting to these regulatory changes and staying in compliance can be a complex and costly process, which can affect the company’s overall performance. Technological advancements also play a significant role in shaping Musandam Power’s performance. Staying abreast of modern technologies emerging in the power generation industry can give the company a competitive edge and help drive its success. Factors such as political instability, economic conditions, and social trends can further impact Musandam Power’s performance by disrupting operations, reducing demand, or influencing consumer preferences and government policies.
Other Factors Affecting Firm Performance
The Shell Oman’s performance is affected by several not capital structure factors. The economic conditions, the market fluctuations, and the factual changes are factors that could either make or mar the financial turnouts. In fact, the fall of the ratio of the receivable turnover and the total asset turnover by the year 2020 was brought by huge economic interruption created by the pandemic that reduced the ability to meet payments and to use the assets in the past year. Operation efficiency, cost management, and market positioning are also among the things that are significant in terms of performance. The analysis defines that Shell Oman should be flexible enough with respect to the changing market conditions, enhance its operational efficiencies, and mitigate the risks associated with its capital structure for better show results (Bartiloro & di Iasio, 2011).
Al Maha Oil Company
Another factor that can influence firm performance is the quality of its leadership team. The leadership team at Al Maha Oil Company is comprised of experienced professionals who bring a diverse range of skills and expertise to the table. By having a strong leadership team in place, the company is better equipped to navigate challenges and capitalize on opportunities in the rapidly evolving oil and gas industry.
In addition to corporate governance and leadership, the company’s relationships with its suppliers and customers can also impact its performance. Al Maha Oil Company has built strong relationships with key suppliers, allowing it to secure reliable access to the resources and services it needs to operate efficiently. Furthermore, the company has a customer-centric approach, focusing on providing high-quality products and services that meet the needs of its clients. By maintaining positive relationships with both suppliers and customers, Al Maha Oil Company can foster a reputation for reliability and trustworthiness, which can lead to increased market share and profitability.
One of the key factors that can impact Musandam Power’s performance is the regulatory environment. The power generation industry is heavily regulated, with government policies and regulations often dictating the terms under which companies can operate. Changes in regulations, such as new emissions standards or renewable energy mandates, can significantly impact Musandam Power’s operations and bottom line. Adapting to these regulatory changes and staying in compliance can be a complex and costly process, which can affect the company’s overall performance. Technological advancements also play a significant role in shaping Musandam Power’s performance. Staying abreast of innovative technologies emerging in the power generation industry can give the company a competitive edge and help drive its success. Factors such as political instability, economic conditions, and social trends can further impact Musandam Power’s performance by disrupting operations, reducing demand, or influencing consumer preferences and government policies.
RECOMMENDATIONS
Based on the comprehensive analysis conducted on Shell Oman’s financial performance and capital structure, several key recommendations emerge to enhance the company’s overall performance and financial resilience:
Optimize Capital Structure: Shell Oman should conduct a thorough capital structure assessment encompassing its asset and liability side to decide on proper debt to equity proportion to sustain the financial aspect of the operations (Agnihotri, 2014). This assessment will include elements like the cost of capital, the risk-averse nature of the business and its growth strategy. Through successfully balancing borrowing and shareholders’ funds, Shell Oman can be assured of the least financial risk even as shareholders continue to reap bountiful rewards.
Enhance Profitability: To move to high profitability, the Shell Oman Company needs to think in terms of these measures since here it comes on top effectively operational efficiency and reduce operating costs. The way workers interact and act efficiently, using the most recent technologies and processes is one way it could occur. Besides that, different revenue sources as well as discovering new operating fields will be in favour of not only healthy growth but also higher profitability margins.
Strengthen Financial Management: Apart from the marketing of Shell Oman, the company’s effective monetary management can strongly contribute to its long-term success. One of the first things the company should do is focus on cash flow management, where it will ensure liquidity is adequate to fulfil its immediate needs and sustain future growth. However, judicious debt management practices such as re-financing expensive debt and compliance with the financial covenant are especially important to protect the company against financial problems resulting from the capital structure (Omer, Mehwish & Urooj, Shama, 2019).
Monitor Economic and Market Trends: Remaining alert to market trends and economic situations that may affect the business running and financial magnitude of Shell Oman can never be overemphasized for this company. This involves tracking innovations in the regulation sphere, global relations, and market trends. Being well-informed and applying the strategies, Shell Oman will be able to navigate any uncertainties and ensure the best outcome in the market (Omer, Mehwish & Urooj, Shama, 2019).
As an analyst studying Al Maha Oil Company, it is evident that the company has a solid capital structure that has served as a foundation for its success in the oil and gas industry. However, to ensure continued growth and resilience eventually, there are certain recommendations that can further enhance the company’s performance and sustainability.
Primarily, it is crucial for Al Maha Oil Company to continuously optimize its capital structure. (Bierman,2003) By carefully managing the mix of debt and equity in its financing activities, the company can strike a balance between leveraging the benefits of debt financing and avoiding the risks associated with excessive debt levels. Regular reviews of key financial ratios, such as the debt-to-equity ratio, can help Al Maha Oil Company maintain a stable and sustainable capital structure.
Moreover, diversifying funding sources can further strengthen the company’s financial position. While debt financing has been beneficial, exploring alternative financing options such as equity issuance, joint ventures, or strategic partnerships can reduce reliance on any only source of capital and enhance financial flexibility. This diversification can prove valuable in periods of economic uncertainty or market volatility.
One key aspect of capital structure that is critical for companies is the level of debt they take on. By leveraging debt, companies can potentially increase returns on equity (ROE) and magnify their earnings. However, it is important to strike a careful balance to ensure that the levels of debt are sustainable and do not expose the company to excessive financial risks. Musandam Power, a prominent player in the power generation industry, has exhibited strong financial performance over the years. However, a comprehensive analysis of its financial performance and capital structure has highlighted the need for several key recommendations to enhance the company’s overall performance and financial resilience. Firstly, improving debt management by refinancing existing debts at lower interest rates, extending maturities, and exploring alternative financing sources can help reduce financial risks. Secondly, focusing on strengthening working capital management by optimizing inventory levels, streamlining accounts receivable processes, and negotiating favourable payment terms with suppliers can improve liquidity and operational efficiency. These measures will enable Musandam Power to enhance its financial stability and seize growth opportunities in a competitive market.
Suggestions for Further Research
To deepen understanding and address the limitations, future research endeavours could focus on the following areas:
Longitudinal Analysis: Longitudinal study would involve monitoring Shell Oman because of adapting to various economic cycles since the times have changed in the past. By this approach, the analysis of long-term trends, identification of two diverse types of adaptability, vulnerability, or ability for the company to cope with different business conditions which could exist, is possible (Bartiloro & di Iasio, 2011).
Comparative Analysis: Doing comparative analysis with industry peers will provide better evaluation and if necessary, repositioning of the product. Through scrutinizing Shell Oman’s key performance indicators, financial ratios, and business strategy against that of competitors, the searchers can unveil which approach is the most successful, and where do the industry trends trend, and where lies the competitive advantage or weaknesses. These comparisons add more solidity to the decision-making style and make it easier to benchmark performance.
Qualitative Factors: Quantitative analysis is essential; however, qualitative analysis of the organizational strategies, the customers perception of the market and brand reputation can also add value to the analysis. Qualitative tools, including interviews, surveys, and case studies, can become useful in disclosing the human factors of organizational performance and organizational functioning. Besides the assessment of the diversified perspectives of this holistic approach, deep insights into the root causes and factors that may affect the company actions are also produced (Agnihotri, 2014).
One area for future research could focus on a longitudinal analysis of Musandam Power’s operations and performance. By monitoring the company over an extended period, researchers could gain valuable insights into how Musandam Power has adapted to changing market conditions, technological advancements, and regulatory changes. This longitudinal study could help identify vulnerabilities and areas of improvement, leading to more effective strategic planning. Comparative analysis with other power generation companies in the region could provide a better understanding of Musandam Power’s competitiveness and market positioning, potentially leading to collaboration opportunities. (Gopalakrishnan,2022) Scenario analysis could assess the impact of different scenarios on the company’s financial situation and operational performance, aiding in risk management and contingency planning. (Lisser,2022) Research on Musandam Power’s sustainability efforts and investment in renewable energy sources could position the company as a leader in sustainable energy production (Matouq & Alayed,2007). Furthermore, research on market positioning, competitive landscape, and supply chain management practices could help optimize operations and reduce costs.
One area for future research could focus on a longitudinal analysis of Musandam Power’s operations and performance. By monitoring the company over an extended period, researchers could gain valuable insights into how Musandam Power has adapted to changing market conditions, technological advancements, and regulatory changes. This longitudinal study could help identify vulnerabilities or areas for improvement, assisting in more effective strategic planning. Comparative analysis with other power generation companies in the region could provide insights into Musandam Power’s competitiveness and market positioning, potentially leading to collaborations for greater efficiency. Scenario analysis could assess the impact of market fluctuations or regulatory changes on the company’s financial situation and operations, aiding in risk management and contingency planning. (Carragher et al,2019) Additionally, research on Musandam Power’s sustainability and corporate social responsibility efforts could offer insights into the company’s initiatives in reducing its carbon footprint and supporting local communities. (Rotz,2017) Analysing the company’s financial statements and risk management practices could also provide recommendations for enhancing financial stability and sustainability.
REFERENCE
- Abeywardhana, D.K.Y. (2017) Capital Structure Theory: An Overview. Sciedue Press 6(1/2017), Available at: https://papers.ssrn.com/sol3/papers.cfm?abstract_id=2886251
- Al Maha.(no date) Available at: https://www.almaha.com.om/en/investor/annual-reports/ (Accessed: 07 April 2024).
- Almaha Oil Company (2004) Almaha. Available at: https://www.almaha.com.om/ar/about-us/who-we-are/ (Accessed: 14 April 2024).
- Amin, M., Hashmi, S.H. and Saeed, M.B. (2016) ‘Impact of peer firms on capital structure of firm:Evidence from Pakistan’, SSRN Electronic Journal [Preprint]. doi:10.2139/ssrn.2744618.
- Bancel, F. and Mittoo, U.R. (2011) ‘Survey evidence on financing decisions and cost of capital’, Capital Structure and Corporate Financing Decisions, pp. 229–248. doi:10.1002/9781118266250.ch13.
- Basyrov, M.A. et al. (2023) ‘Issues of updating industry guidance documents for well investigation’, Neftyanoekhozyaystvo- Oil Industry, (11), pp. 43–48. doi:10.24887/0028-2448-2023-11-43-48
- Bierman, H. (2003) ‘Why capital structure is important’, The Capital Structure Decision, pp. 1–11. doi:10.1007/978-1-4615-1037-6_one.
- Brooke Reavey discusses and defines a conceptual model for market research’ (2023) Building a Conceptual Model to Determine Independent and Dependent Variables [Preprint]. doi:10.4135/9781529669220.n1.
- Carragher, M. et al. (2019) ‘Investment analysis of gas-turbine combined heat and power systems for commercial buildings under different climatic and market scenarios’, Energy Conversion and Management, 183, pp. 35–49. doi: 10.1016/j.enconman.2018.12.086.
- Dada, A.O. and Ghazali, Z.B. (2016) ‘The impact of capital structure on firm performance:Empirical evidence from Nigeria’, IOSR Journal of Economics and Finance, 07(04), pp. 23–30. doi:10.9790/5933-0704032330.
- Das, C.P. and Swain, R.K. (2018) ‘Influence of capital structure on financial performance’, Parikalpana: KIIT Journal of Management, 14(1), p. 161. doi:10.23862/kiit-parikalpana/2018/v14/i1/173256.
- Dattalo, P. (2013) ‘Choosing among procedures for the analysis of multiple dependent variables’, Analysis of Multiple Dependent Variables, pp. 149–156. doi:10.1093/acprof: oso/9780199773596.003.0006.
- Fight, A. (2004) ‘Financial risks’, Credit Risk Management, pp. 103–198. doi:10.1016/b978-075065903-1.50003-2.
- Financial statements (no date) Image. Available at:https://musandampower.com/investors/ (Accessed: 07 April 2024).
- Gansuwan, P. and Önel, Y.C. (2012) The Influence of Capital Structure on Firm Performance. Digitala VetenskapligaArkivet Available at: https://www.diva-portal.org/smash/record.jsf?dswid=-4818&faces redirect=true&language=en&searchType=SIMPLE&query=&af=%5B %5D &aq=%5B%5B%5D%5D&aq2=%5B%5B%5D%5D&aqe=%5B%5D&pid=diva2%3A537574&noOfRows=50&sortOrder=author_sort_asc&sortOrder2=title_sort_asc&only
- Gopalakrishnan, P. (2022) ‘Impact of modern exploration techniques in oil & gas reserves to production ratio’, Innovative Exploration Methods for Minerals, Oil, Gas, and Groundwater for Sustainable Development, pp. 405–421. doi:10.1016/b978-0-12-823998-8.00031-4.
- Heath, C. (2023, January 31). Data Collection in Research: Examples, Steps, and FAQs. Dovetail. Retrieved March 28, 2024, from https://dovetail.com/research/data-collection/.
- Jain, N. (2023, September 8). What is a Research Design? Definition, Types, Methods, and Examples. IdeaScale. Retrieved March 28, 2024, from https://ideascale.com/blog/what-is-research-design/.
- Jansen, D., & Warren, K. (n.d.). Validity & Reliability inResearch: Simple Explainer + Examples. Grad Coach. Retrieved March 28, 2024, from https://gradcoach.com/validity-reliability-research/.
- Jansen, D., & Warren, K. (n.d.). What Is Research Methodology? Definition + Examples. Grad Coach. Retrieved March 28, 2024, from https://gradcoach.com/what-is-research-methodology/.
- Javed, Younas and Imran. (2014) Impact of Capital Structure on Firm Performance: Evidence from Pakistani.
- Lisser, B. (2022) ‘Part III: The Company Advantage: Market, competitive, and Brand Advantage’, The Growth Advantage, pp. 155–182. doi:10.5771/9781538161739-155.
- MacInnes, J. (2019) Know your variables. London: SAGE Publications. ‘Ordinal independent variables’ (2020) SAGE Research Methods Foundations [Preprint]. doi:10.4135/9781526421036938055.
- Mahfuzah Salim, R.Y. (2012) Capital Structure and Firm Performance: Evidence from Malaysian Listed Companies. procedia- Social and BehavioralScience 65, pp. 156-66. Available at: https://reader.elsevier.com/reader/sd/pii/S1877042812050902?token=24734CEFF6A28E3ED5AE6E26AED32B9CE817AAB451C2C86803242D6EA503BDB65705D6A7463EA75BA563BE6998B32472&originRegion=eu-west-1&originCreation=20211214105654
- MANUFACTURING COMPANIES IN INDIA. International Journal of Advanced Engineering Technology 7(1), pp. 24-28. Available at: https://www.technicaljournalsonline.com/ijeat/VOL%20VII/IJAET%20VOL%20VII%20ISSUE%20I%20JANUARY%20MARCH%202016/20167106.pdf
- Matouq, M. and Alayed, O. (2007) ‘Combined process of solvent extraction and gamma-ray radiation for the extraction of oil from oil shale’, Energy Sources, Part A: Recovery, Utilization, and Environmental Effects, 29(16), pp. 1471–1476. doi:10.1080/00908310600626523.
- Modugu and Prince, K. (2013) Capital Structure Decision: An Overview. Journal of finance andBank managementpp. 14-27. Availableat:http://jfbmnet.com/journals/jfbm/Vol_1_No_1_June_2013/2.pdf#:~:text=Capital%20structure%20refers%20to%20the%20different%20options%20used,free%20of%20taxes%2C%20transaction%20costs%2C%20and%20other%20frictions.
- MUBASHIR, R.N.H.M. (2014) Impact of capital structure on financial performance. S.l.: LAP LAMBERT ACADEMIC PUBL.
- Muhammad, H., Shah, B., and Islam. (2014) The Impact of Capital Structure on Firm Performance:Evidence from Pakistan. Journal of Industrial Distribution & Business 5(2), pp. 13-20.
- MWANGI ERIC, M. (2016) THE RELATIONSHIP BETWEEN CAPITAL STRUCTURE AND PROFITABILITY OF CONSTRUCTION AND ALLIED FIRMS MWANGI ERIC MACHARIA. University ofnairoabi Research Archive 13(4), pp. 283-92. Available at: http://erepository.uonbi.ac.ke/handle/11295/98798
- Nooney, Lenin Kumar et al. (2019) ‘Analysis of Monetary Performance: A case study of Shell Oman Marketing and Oman Oil Marketing’, Oman Chapter of Arabian Journal of Business and Management Review, 8(3), pp. 11–19. doi:10.12816/0055269.
- Ogebe, Patrick and Ogebe, and, J., Alewi and Kemi. (2013) The Impact of Capital Structure on. MPRA 46173, Available at: https://mpra.ub.uni-muenchen.de/46173/1/mpra_paper_46173.pdf
- Osadume, R. (2018) Oil and gas industries financing and financial performance in Nigeria: The case of intelligent capital LED model, Academia.edu. Available at:https://www.academia.edu/37530094/Oil_and_gas_industries_financing_and_financial_performance_in_Nigeria_The_case_of_intelligent_capital_led_model .
- Rafi, M., Rahayu, S. and Ridwan, M. (2023) ‘Effect of return on assets (ROA), Return on Equity (ROE), debt to equity ratio (DER), current ratio (CR), net profit margin (NPM) and earning per share (EPS) on stock prices’, Indonesian Journal of Economic & Management Sciences, 1(4), pp. 481–500. doi:10.55927/ijems. v1i4.5035.
- Supriati, D., Kananto, R. and Kusriananda, A. (2019) ‘The effects of intellectual disclosures capital, debt to assets ratio, debt equity ratio, company size and assets turnover on company profitability’, Proceedings of the 5th Annual International Conference on Accounting Research (AICAR 2018) [Preprint]. doi:10.2991/aicar-18.2019.23.
- Suyanto, S. and Bilang, C.N. (2023) ‘The impact of financial performance, firm size and capital structure on firm value’, FINANCIAL: JURNAL AKUNTANSI, 9(1), pp. 75–89. doi:10.37403/financial. v9i1.508.