
The Impact of South Africa’s Carbon Tax Policy on Carbon Leakages on its Top Five African Trading Partners
- Masedi Sesele
- 1960-1971
- Mar 20, 2024
- Education
The Impact of South Africa’s Carbon Tax Policy on Carbon Leakages on its Top Five African Trading Partners
Masedi Sesele
University of the Witwatersrand, South Africa.
DOI: https://dx.doi.org/10.47772/IJRISS.2024.802138
Received: 09 February 2024; Revised: 15 February 2024; Accepted: 21 February 2024; Published: 20 March 2024
ABSTRACT
The carbon leakage phenomenon, whereby decreased carbon emissions in locations with strict constraints on carbon emissions may be offset to some extent by increased carbon emissions in locations with less strict constraints on emissions, has the potential to undermine efforts to mitigating carbon emissions. As such the objective of this study was to use a natural experiment model to estimate the extent of carbon leakage associated with South Africa’s Carbon Tax on the combined carbon emissions of its top five trading African partners (Mozambique, Namibia, Botswana, Nigeria and Eswatini). This was a highly essential study and arguably a first of its kind, to infer causal impact of the carbon tax on carbon leakages using a single group interrupted time-series analysis regression discontinuity design. Results from the study showed that in the long-run, the carbon tax has decreased carbon emission in South Africa by 4.42 percent while increasing carbon emissions in South Africa’s trading partners by 1.003 percent. This shows evidence of a carbon leakage because of the carbon tax, and it is recommended that policymakers should consider trade restrictions to prevent the import of carbon-intensive commodities or institute universal, instead of unilateral, climate change mitigation policies.
Keywords: Carbon leakages, Carbon emissions, Carbon tax
Key policy highlights
- The carbon tax in South Africa has resulted in a decreased in carbon emissions of 4.42 percent.
- The carbon tax in South Africa has resulted in a carbon leakage of 1.003 percent for its selected trading partners.
- Policymakers should consider trade restrictions to prevent the import of carbon-intensive commodities.
- Universal, instead of unilateral, climate change mitigation policies should be instituted to limit carbon leakages.
INTRODUCTION
Environmental sustainability has become an issue of major importance in recent times. It has become evident that in order to maintain human life and prosperity, it is required that the environment in which the human life is occupying is preserved and protected. This is because human life depends on ecosystem services that maintain a natural balance to life. Such services include environmental functions such as carbon cycling, climate, and surface temperature regulation as well as carbon absorption through the ocean, rocks, sediments, and other living organisms.
Despite the importance of sustaining the environment, the world continues to pollute the environment, resulting in loss of biodiversity and increased greenhouse gas emissions. Global warming has been a major threat to global sustainability as the Earth’s temperature has risen by an average of 0.08° Celsius per decade since 1880 and the rate of warming since 1981 is more than twice as fast at 0.18° C per decade (Lindsey & Dahlman, 2023).
The increased temperatures have resulted in various extreme weather conditions such as floods and wildfires, which have destroyed human life and infrastructure. South Africa has felt the harsh effects of global warming through extreme weather conditions such as the Durban floods which killed over 300 people and destroyed infrastructure, which resulted in estimated economic losses of over R700 million, excluding the cost to repair damaged infrastructure and properties (Nyoka, 2022; Business Partners Limited, 2022).
Countries across the world continue to mitigate the effects of climate change through various environmental policies such as command and control policies; emissions charges and subsidies policies and market trading systems. One such emissions charge policy in South Africa is the carbon tax which came into effect on 1 June 2019. Carbon taxes have the potential to effectively decrease carbon emissions as they make it more costly to emit them. However, a major concern for carbon taxes is through the concept of carbon leakages, which threaten to undermine efforts to mitigating carbon emissions.
Carbon leakages results when stricter constraints on carbon emissions in some locations result in geographical relocations of some industries to locations with less strict constraints on carbon emissions which can change the patterns of trade (Perman, et al., 2011). Therefore, decreases in carbon emissions in locations with strict constraints on carbon emissions may result in increases in carbon emission in locations with less strict constraints on emissions.
Therefore the main objective of this study, is to use a natural experiment model to estimate the extent of carbon leakage associated with South Africa’s Carbon Tax in its top five trading African partners. This is a highly essential study and arguably a first of its kind, to infer causal impact of the carbon tax on carbon leakages using a regression discontinuity design. Results from this study will be beneficial to policymakers not only in South Africa, but also to the rest of the world in two aspects. First, in order to implement trade restrictions to prevent the import of carbon-intensive commodities and secondly, to consider the wisdom of unilateral measures to decrease carbon emissions.
The rest of this study is organised into six sections, the first is a review of the South African Carbon Tax. The second section discusses and establishes South Africa’s five main African trading partners. The third provides a literature review on previous studies with regards to carbon leakages. The fourth section outlines the methodology that was used to model the carbon leakage associated with the carbon tax. The fifth section is a discussion of the results and the sixth section concludes the study and provides policy recommendations.
SOUTH AFRICA’S CARBON TAX ACT OF 2019
The carbon tax act of 2019 came into effect on the 1st of June 2019 as a response to climate change with the intension of decreasing greenhouse gas emissions in a sustainable, cost effective and affordable manner (South African Revenue Services, 2019). The carbon tax ensures that producers and consumers take into account social costs associated with negative externalities arising from their production or consumption. This follows the polluter-pays-principle which makes polluters pay for their social damage. This is intended to incentivise polluters to find the best way to reduce emissions, rather than having a command and control policy where a central authority determines how much should be emitted and how it should be done.
The carbon tax is administered, assessed, enforced and collected by the South African Revenue Services (SARS) as an environmental levy in terms of the Customs and Excise Act, 1964. The emissions which are subject to the carbon tax are determined by either an approved reporting methodology of the Department of Environment, Forestry and Fisheries or the prescribed formulas in terms of the Carbon Tax Act, 2019 (South African Revenue Services, 2019).
The liability of the carbon tax is calculated in phases, with the first phase having a carbon tax rate of R120 per ton of carbon dioxide (CO2) equivalent emissions. The rate has increased annually by inflation plus two percent to R134 by the end of 2022 (IMF, 2023). However, due to the generous tax-free thresholds and allowances the effective carbon tax rate was relatively lower, with the International Monetary Fund (IMF) estimating it to be less than R7 per ton of carbon dioxide emission during the 2021/22 financial year (IMF, 2023).
SOUTH AFRICA’S INTRA-AFRICAN TRADE
According to Tralac (2023) the South African Intra-African trade and tariff profile of 2022 has shown that the South Africa’s intra-African merchandise trade was valued at approximately R647 billion. In terms of exports, South Africa’s main intra-African exports are light oils, bituminous coal, ferro-chromium, chromium ores, electrical energy, goods vehicles and non-agglomerated iron ores. In terms of imports, South Africa’s main intra-African imports are petroleum oils, gold, natural gas, mixtures of odoriferous substances, electrical energy and non-industrial diamonds (Tralac, 2023).
As can be seen in Figure 1, South Africa’s intra-African exports are mainly to Mozambique, Botswana, Namibia, Zimbabwe and Zambia, while South Africa’s intra-African imports are mainly from Nigeria, Eswatini, Mozambique, Namibia and Botswana. Therefore, the top five trading partners to be included in this study’s analysis will be Mozambique, Namibia, Botswana, Nigeria and Eswatini. These are the top five import markets for South Africa. The analysis will give insight as to whether the carbon tax in South Africa, has resulted in the country’s trading partners being more carbon intensive, which is the essence of carbon leakages. Mozambique, Namibia, Botswana, Nigeria and Eswatini all do not have any carbon tax implemented as at the year 2023 to the best of this study’s knowledge.
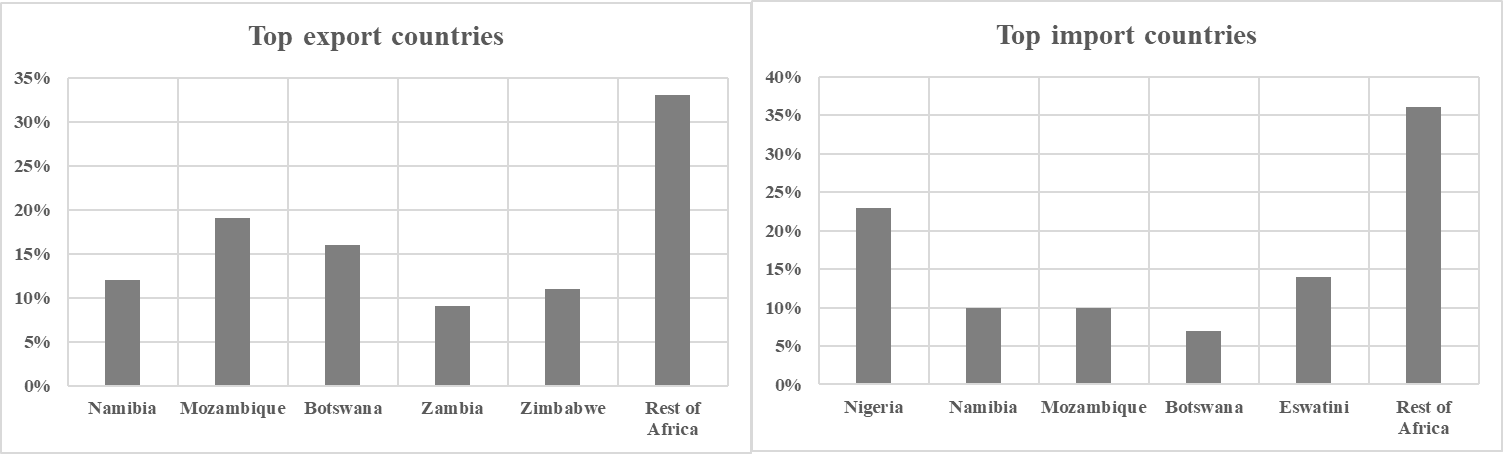
Figure 1: South Africa’s top export destinations and import markets
Source: Tralac (2023)
LITERATURE REVIEW
Since the emergence of climate change mitigation policies, the carbon leakage phenomenon has intrigued researchers across the world. Manne and Martins (1994) dubbed carbon leakage as the possibility that unilateral reductions in CO2 emissions in one country will be partially offset by increased emissions elsewhere. Manne and Martins (1994) determined that the channel through which this is possible is by the raised production costs due to a carbon tax of some goods more than others, which will change the comparative advantage towards less carbon-intensive goods. Therefore, in countries which have no carbon tax imposed, the comparative advantage will shift in the opposite direction, which may lead to increased emissions.
Manne (1994) further determined that a 20 percent cut in emissions from the Organisation for Economic Co-operation and Development (OECD) generates a leakage rate of 30 percent. Arroyo-Currás, et al.(2015) also investigated the implications of Europe, China and the United States taking unilateral or joint early climate policy action and results from the multi-regional energy–economy–climate model REMIND 1.5 showed that carbon leakage is the combined effect of fossil fuel and capital market re-allocation. The leakage is limited to 15 percent of the emission reductions in the pioneering regions and this cannot be a strong counter-argument against early climate policy action by pioneers to induce other regions to adopt more stringent mitigation.
On the other hand, Babiker, (2005) by making use of computable general equilibrium model determined that climate change mitigation policies may result in significant relocation of energy-intensive industries away from OECD countries, resulting in leakage rates as high as 130 percent which will actually lead to higher global emissions. Branger, et al. (2016) investigated the competitiveness-driven carbon leakage due to the European Union Emissions Trading scheme in the cement and steel sector and results showed no evidence of carbon leakage in these sectors, in the short run.
Maria and van der Werf, (2005) showed that as long as technical change cannot be directed, there will always be carbon leakage through the standard terms-of-trade effect, however, when technical change is directed, a counterbalancing induced technology effect arises and carbon leakage will generally be lower. Naegele and Zaklan (2019) investigated the impact of the European Union Emissions Trading System on carbon leakage in European manufacturing. The results of the analysis showed no evidence of carbon leakages resulting from the emissions trading system. On the other hand, Paltsev (2001) determined that the Kyoto Protocol, which calls for a number of industrial countries to limit their carbon emissions, leads to a carbon leakage of 10 percent. The study requires caution when designing carbon taxes and does not justify exemptions of any sector from carbon tax as they lower welfare in a region.
Pan, et al. (2020) determined that in the forest sector, carbon leakage is 39.6 percent which can likely increase depending on the degree of substitution and recommends a mature worldwide carbon trading market with relatively high carbon prices can attract more participants. Paroussos, et al., (2015) calculated the carbon leakage rate when the European Union undertakes a unilateral climate policy and results from a global multi-sector and multi-country computable general equilibrium model showed that total carbon leakage is around 28 percent from 2015-2050 and it is likely to increase when assuming higher trade elasticities. However, the leakage rate drops when more countries such as the United States of America and China join in the abatement.
It is evident that much of extant literature has different views and results on carbon emission mitigation policies and the degree of carbon leakage from such policies. Some studies support the existence of a carbon leakage, others have insufficient evidence of such existence. None of the reviewed literature is in the African context, which leaves a gap, intended to be filled by this study in terms of investigating the existence of carbon leakages in African countries due to climate policies.
METHODOLOGY
Natural Experiment Framework
Causal inference in non-experimental studies usually requires a strong, untestable assumption that no unobserved factor confounds the relationship between the exposure and the outcome. Violations of this assumption will lead to a biased estimation of causal effects. In their study, Bor et al. (2014) stated that the Regression Discontinuity design is one important quasi-experimental study design in which this assumption is not required for causal inference. Regression Discontinuity designs can be implemented when the exposure of interest is assigned by the value of a continuously measured random variable and whether that variable lies above (or below) some threshold value. Provided that subjects cannot precisely manipulate the value of this variable, assigning the exposure is as good as random for observations close to the threshold, and valid causal effects can be identified.
Causal inference requires comparing outcomes for the same unit of analysis in two states of the world: if treated, Ci (1) and if not treated, Ci (0). In this study, the unit of analysis was the combined carbon emissions of South Africa’s top five trading partners (Ci) before South Africa’s carbon tax policy (Ci (1)). Only one of these potential outcomes is ever observed: Ci = Ci (1) if CTi = 1 or Ci = Ci (0) if CTi = 0 where CTi = {0, 1} is a binary variable for the implementation of the carbon tax in South Africa. The challenge of non-experimental studies is that if there are unobserved confounders of the relationship between Ti and Ci, the potential outcomes will be correlated with treatment assignment, and effect estimates will be biased. Regression Discontinuity designs are feasible when the probability of treatment assignment changes discontinuously at some threshold value, C, of a continuous assignment variable.
Zi : limZ ↓C Pr (CTi = 1 | Zi = z ) ≠ limZ ↑C Pr (CTi = 1 | Zi = z ) (1)
Where C is the dateit of the implementation of the carbon tax policy.
If the probability of treatment assignment changes from 0 to 1 at the threshold, then treatment assignment is a deterministic function of Zi : CTi = 1[Zi < C] where 1[.] is the indicator function, and this is known as sharp Regression Discontinuity. Therefore, when measuring the carbon leakage in the trading partners carbon emissions due to the South African carbon tax policy, the probability of the carbon tax implementation changes from 0 (no carbon tax policy implementation) to 1 (carbon tax policy implementation). A motivation for Regression Discontinuity is that in a small neighbourhood around C, as the range goes toward 0, treatment assignment (carbon tax implementation) is ignorable, that is, independent of the potential outcomes, just as in randomised experiments: limƐ→0 Ci (0), Ci (1) ⊥ CTi | C = – Ɛ < = Zi < C + Ɛ. This follows from the assumption that Zi is continuous at C and the relationship between Zi and the potential outcomes Ci (0), Ci (1) are continuous at C.
Under these assumptions, the conditional distribution F (Ci (0)) | Zi) and F (Ci (1)) | Zi) are identical as Zi approaches C from above and below. The average causal effect is then given by estimating the differences in the means at the threshold E[Ci (1) | Zi = C] – E[Ci (0) | Zi = C]. Because this is a sharp discontinuity, before and on the date that the carbon tax policy is implemented Zi ≤ C, then E[Ci | Zi] = E[Ci (0) | Zi] and after the carbon tax policy Zi > C, then E[Ci | Zi ] = E[Ci (1) | Zi].
Figure 2 shows the continuous conditional expectation functions for the potential outcomes, E[Ci (0) | Zi = z] and E[Ci (1) | Zi = z]. The solid lines show the observed data, E[Ci | Zi] and the dotted lines show the regions of the potential outcome conditional expectation functions that are not observed. At the threshold, both E[Ci (0) | Zi = z] and E[Ci (1) | Zi = z] are identified by limits in the observed data. Thus, the sharp Regression Discontinuity design identifies the average causal effect at the threshold:
Average Causal Effect = limZ ↑C E[Ci | Zi = z ] – limZ ↓C E[Ci | Zi = z ] (2)
The same analysis explained above will also be conducted to measure the impact of the carbon tax on South Africa’s carbon emissions.
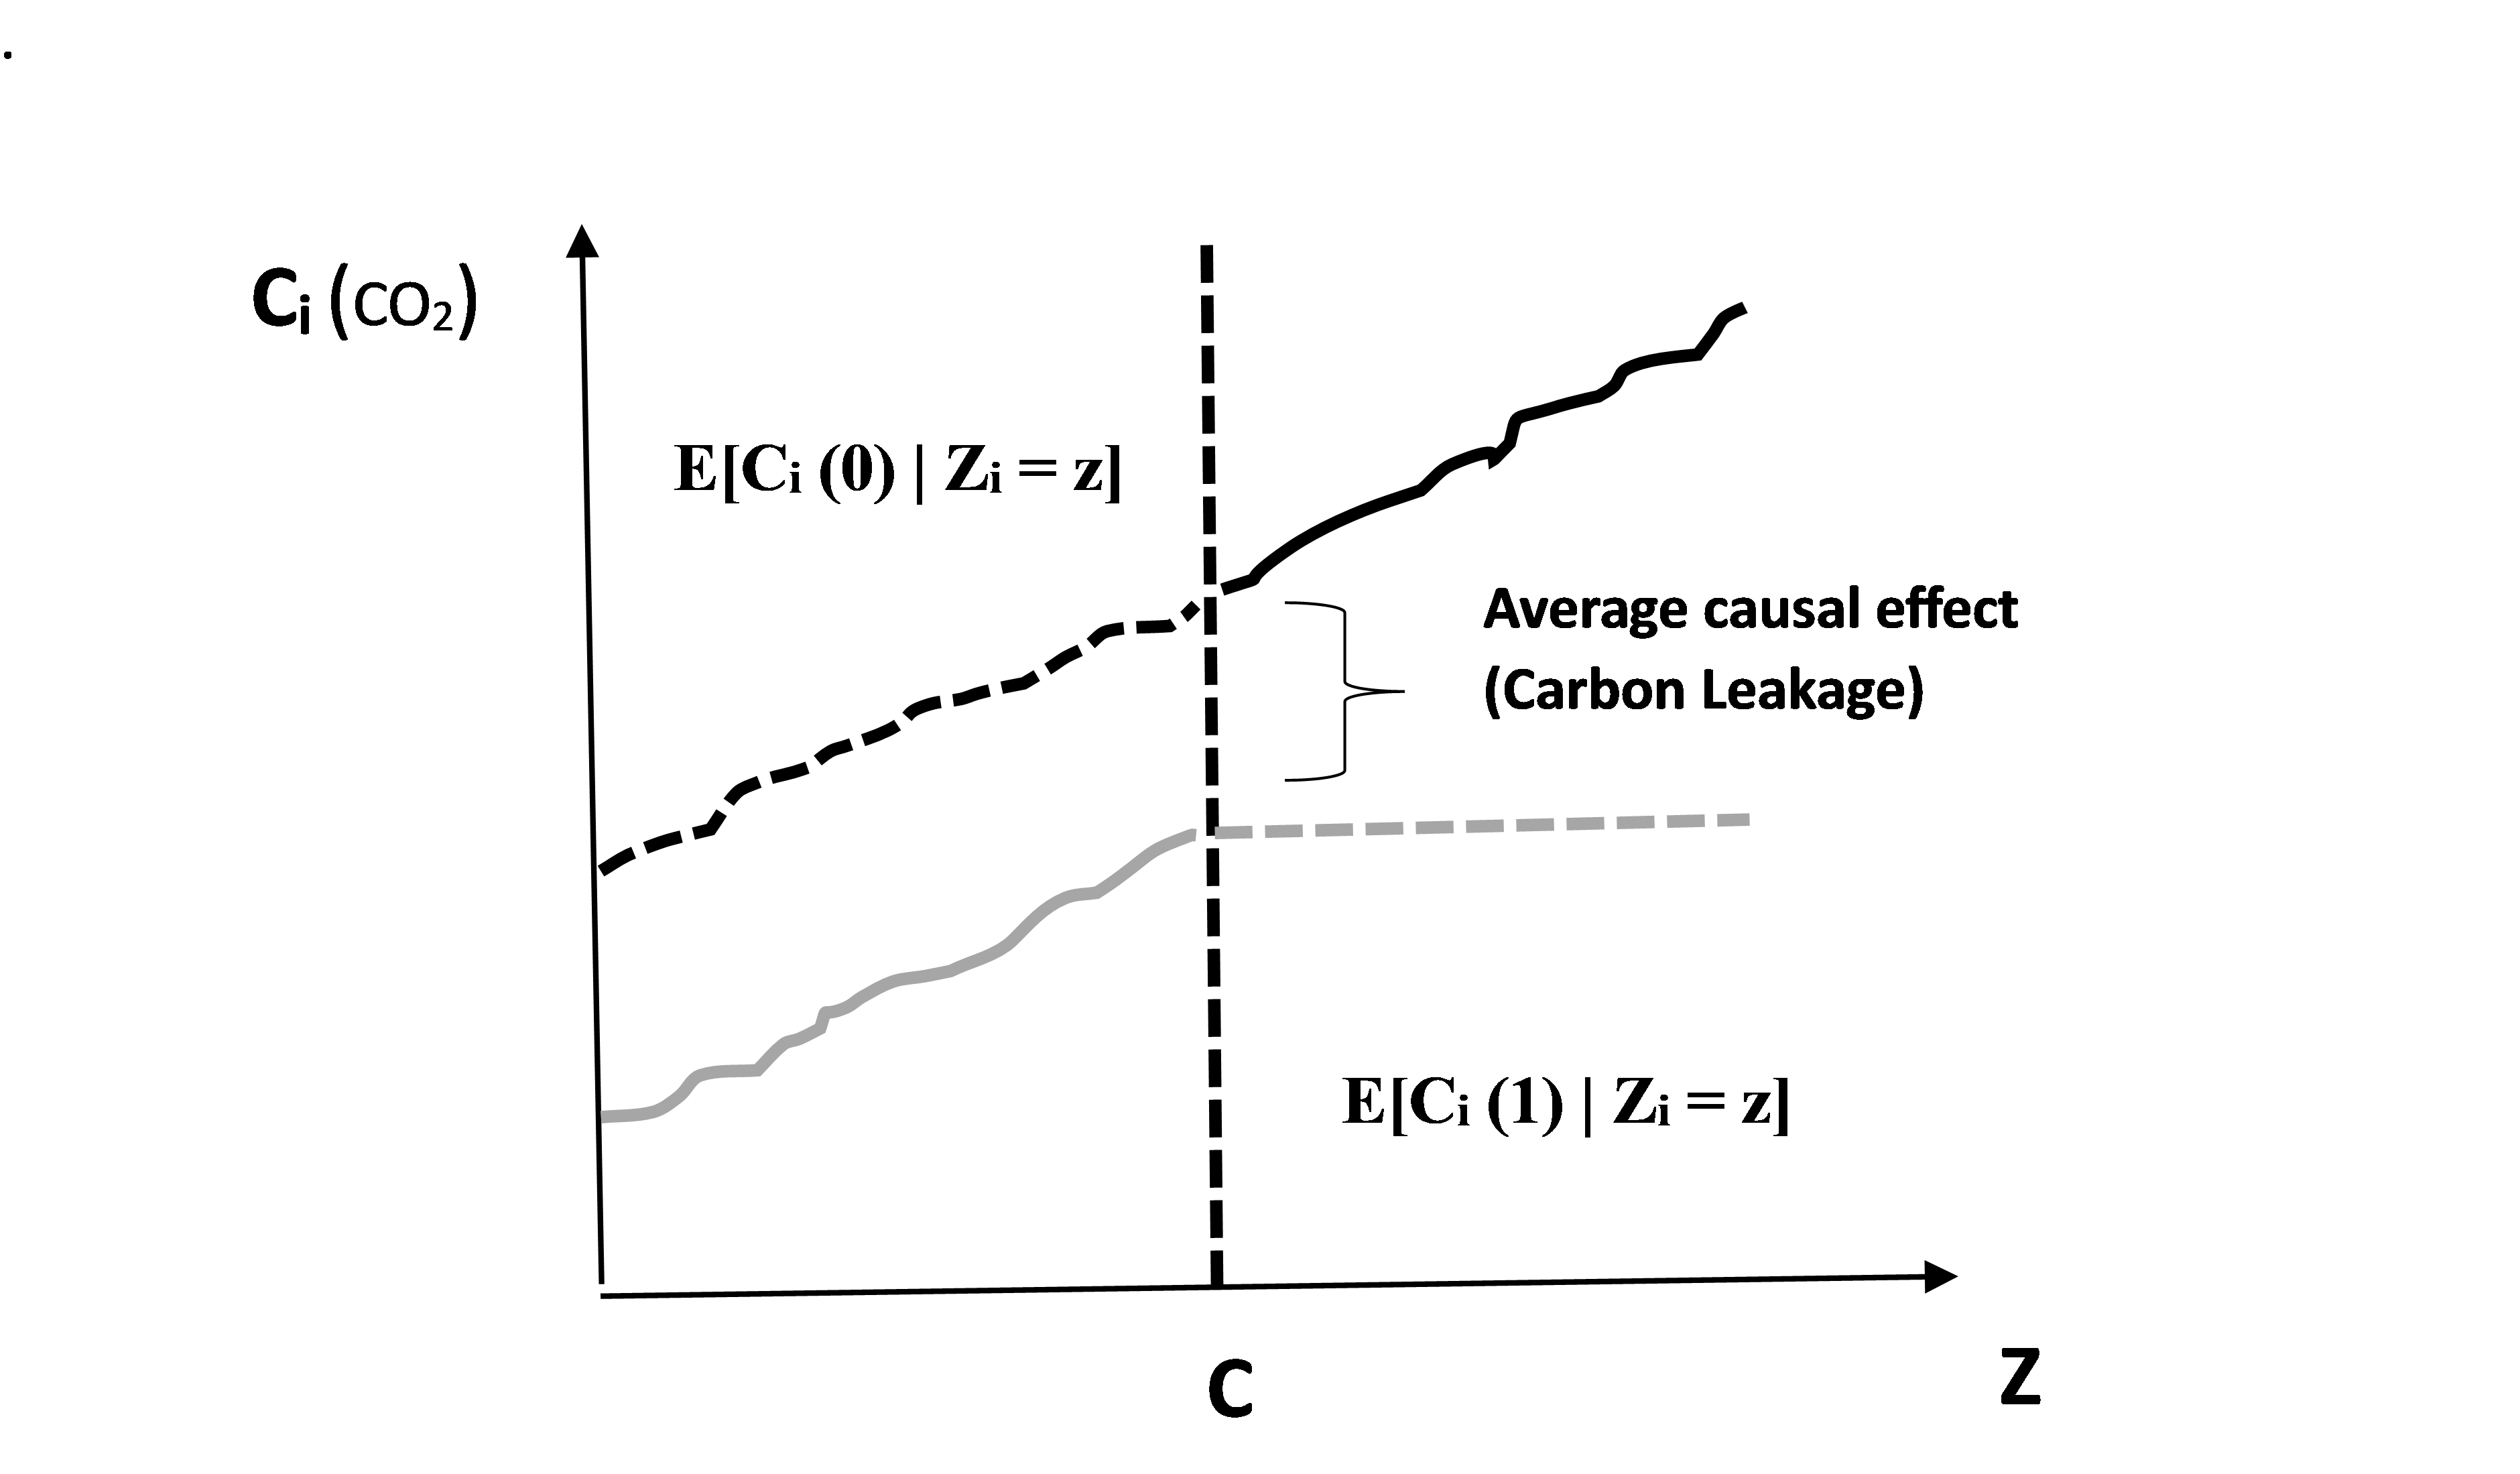
Figure 2: Sharp Regression Discontinuity design
Data Source and Descriptive Statistics
The carbon emissions data for South Africa, Mozambique, Namibia, Botswana, Nigeria and Eswatini were sourced from Ritchie and Roser (2021). The carbon dioxide emissions from fossil fuels are measured in tonnes and are shown in Figure 3 and 4. In Figure 3, the emissions from Mozambique, Namibia, Botswana, Nigeria and Eswatini are shown. It is evident from Figure 3 that Nigeria has the highest rate of carbon emissions, followed by Mozambique, Botswana and Namibia. Eswatini has the lowest rate of carbon emissions, which have been relatively constant, while the rate of emissions from the other countries have been gradually increasing.
Figure 4 shows South Africa’s carbon emissions and the combined carbon emissions of the five trading partners. South Africa’s carbon emission are higher than the combined emissions of its African trading partners. It is evident from Figure 4 that South Africa’s emission have in recent years gradually decreased, while the combined emissions of the trading partners have been gradually increasing. The regression discontinuity in time analysis will quantify if and by how much has the carbon tax implemented in 2019 affected carbon emissions in South Africa, and if and by how much has the carbon tax resulted in carbon leakages in the five trading partners.
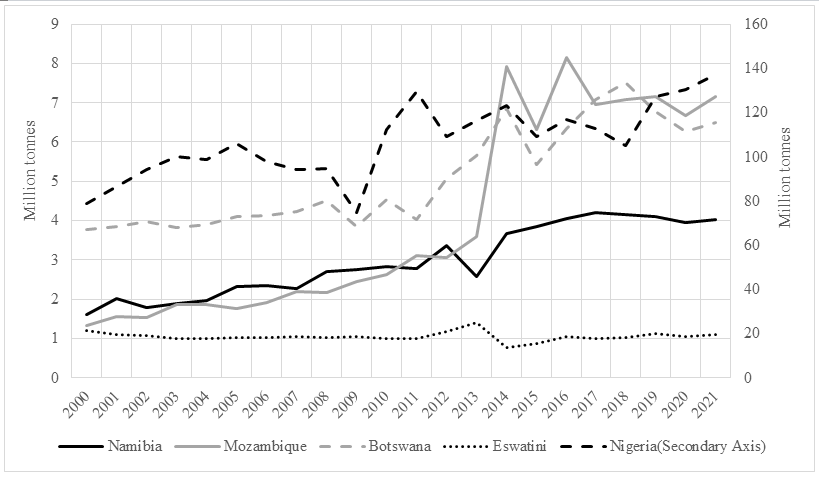
Figure 3: carbon emissions data for Namibia, Mozambique, Botswana, Eswatini and Nigeria
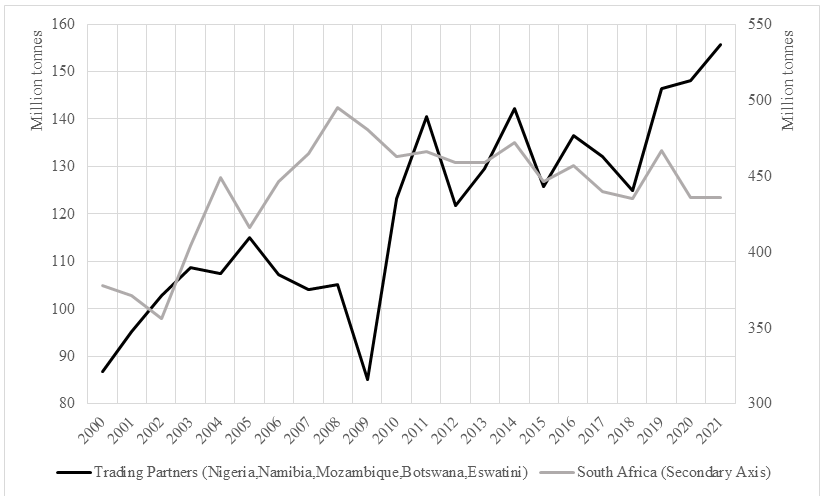
Figure 4: carbon emissions data for South Africa and its combined trading partners
Regression Discontinuity Estimates
The regression discontinuity design to estimate the carbon leakage in South Africa’s trading partners due to the carbon tax takes the following specification:
![]() (3)
(3)
Where Cit denotes the combined carbon emission i of the top five trading partners during year t; CTit denotes a binary variable, which is equal to one after the introduction of the carbon tax and zero otherwise; dateit denotes the date measured in years from the start of the study. The function F (.) eliminates the endogenous relationship between εit and the date, which should not change discontinuously on or near the date of the start of the policy intervention (carbon tax). The regression discontinuity is sharp as the running variable dateit determines the introduction of the carbon tax.
To estimate this model, the Imbens and Lemieux (2008) approach will be followed, and the estimated local linear regression will take the following form:
Cit = α + β1 CTit + β2 dateit +β3 CTit٠dateit +εit (4)
Where the variable dateit is normalised to zero on the year the carbon tax begins, and the function F(dateit) is specified as β2 dateit +β3 CTit٠dateit whereby both dateit and CTit only vary by date. For the days that are close to the day the carbon tax was implemented, the variables dateit and dateit·CTit absorb any smooth relationship between the date and εit. When εit does not change discontinuously when the carbon tax begins, the estimated coefficient β will be unbiased and the regression discontinuity will be valid. A single group interrupted time-series analysis (Linden & Arbor, 2015) will be used to indicate the immediate effect (β1) and the long-term effect (β3) of the carbon tax on carbon leakages in South Africa’s African trading partners.
The same regression discontinuity technique will also be used to determine the casual impact of the carbon tax on carbon emissions in South Africa. The estimated local linear regression will take the same following form:
SACit = α + β1 CTit + β2 dateit +β3 CTit٠dateit +εit (5)
With SAC begin the South African carbon emissions and the result of the model specifications being the same as equation 4.
EMPIRICAL RESULTS
Impact of the carbon tax on emission in South Africa
Table 1 shows the results from the regression discontinuity measuring the immediate and long term causal impact of the carbon tax on carbon emissions in South Africa.
Table 1: Regression discontinuity results
| Regression with Newey-West Standard errors | |
| Date | 0.0098**
(2.28) |
| Carbon Tax | -0.0464
(-0.98) |
| Carbon Tax * Date | -0.04418***
(-4.68) |
| Intercept | 19.8096***
(398.18) |
| Post-intervention liner trend | -0.03434***
(-3.81) |
| F-test | 7.52*** |
T-statistics of coefficients in brackets ();*(**) [***] denote 10 percent, 5 percent, 1 percent levels of statistical significance, respectively
In the first year of the implementation of the carbon tax, there appears to be a reduction of 4.64 percent in carbon emission in South Africa. This is regarded as the short-term effect of the carbon tax on carbon emission, but this reduction is not significant at the 10 percent significance level. This can possibly be explained by the COVID-19 pandemic, which resulted in decreased energy demands, which subsequently resulted in reduced emissions. The long-term effect of the carbon tax has resulted in a 4.42 percent significant decrease in carbon emissions in South Africa. Overall, the post-intervention (carbon tax) trend decreased yearly carbon emissions by 3.43 percent. Figure 5 provides a visual display of these results.
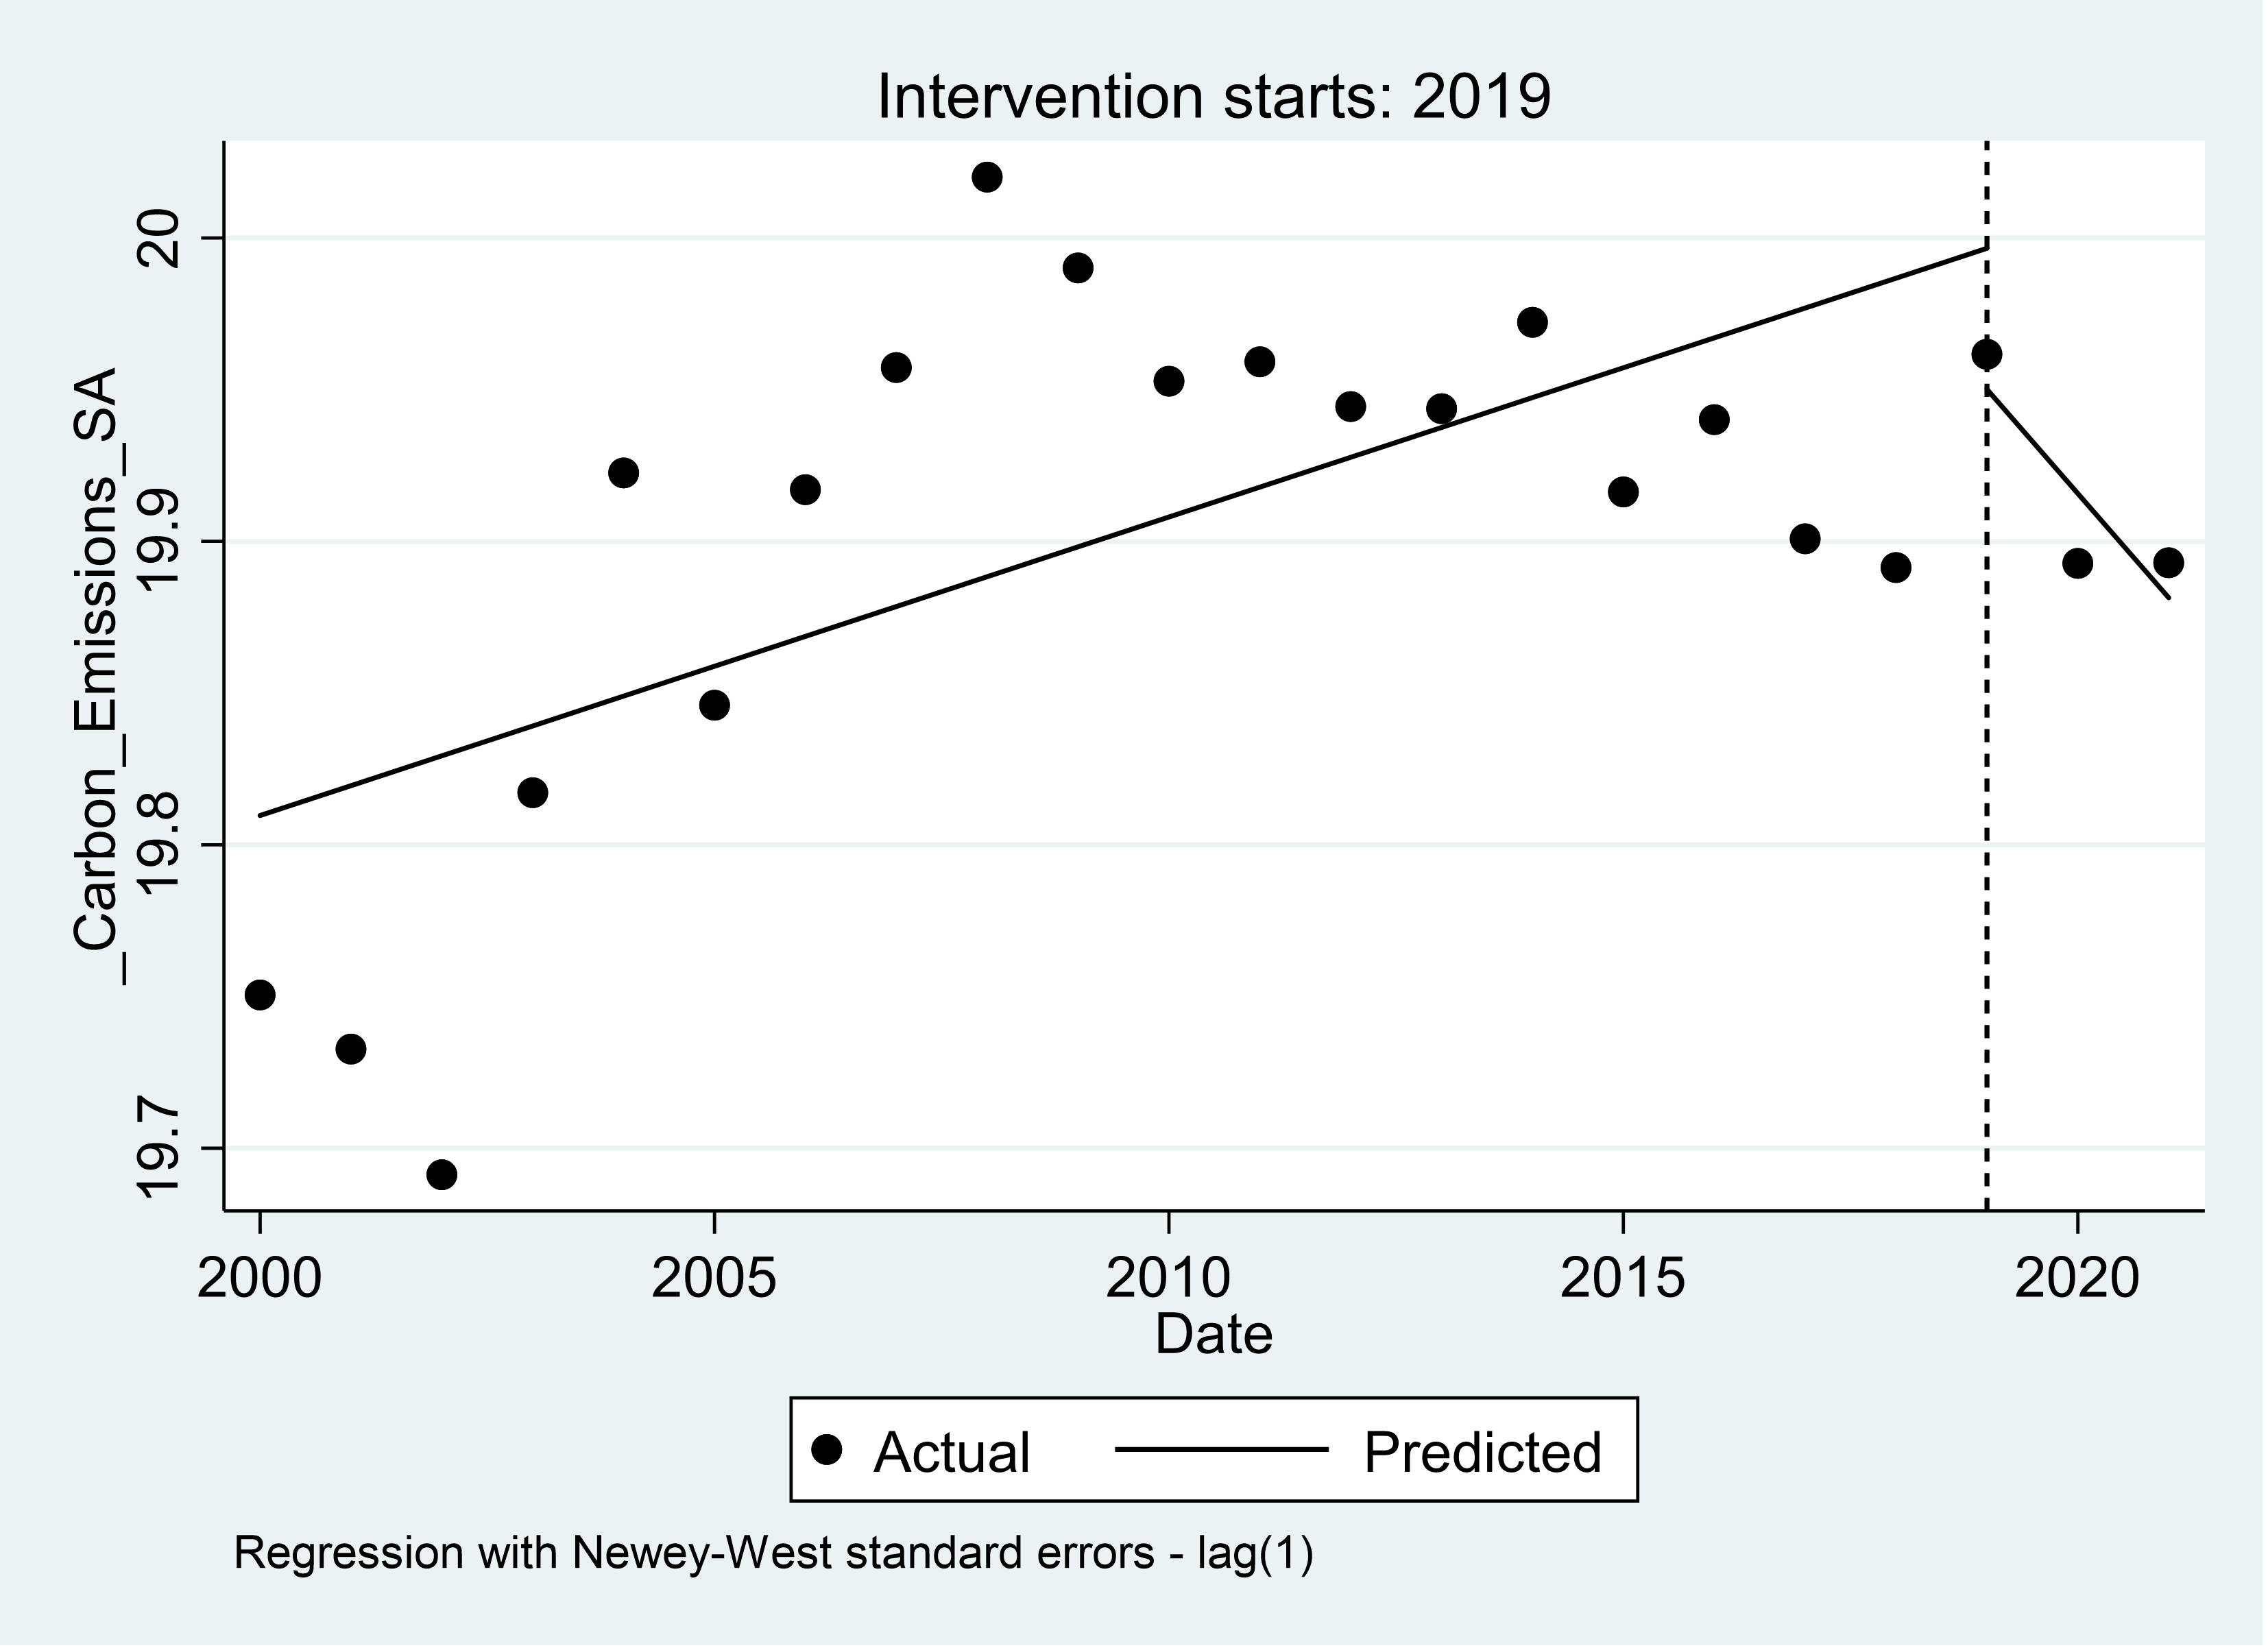
Figure 5: South Africa’s carbon emissions before and after the 2019 carbon tax policy intervention
Carbon leakage in South Africa’s Top five Africa Trading partners
Table 2 shows the results from the regression discontinuity measuring the immediate and long term causal impact of the carbon tax on carbon emissions in South Africa’s top five African trading partners. This will measure the rate of carbon leakage in the trading partners as a result of the implementation of the carbon tax in South Africa. From the results in Table 2, it appears that in the first year of the carbon tax, carbon emissions in South Africa’s trading partners (Mozambique, Namibia, Botswana, Nigeria and Eswatini) increased by 3.52 percent. This is the short-term effect of the carbon tax, which represents a 3.52 percent carbon leakage due to the carbon tax. However, the short term effects are not significant at the 10 percent significance level. The long-term effects of the carbon tax resulted in a 1.003 percent significant increase in carbon emissions in South Africa’s trading partners. This shows that in the long-term, the carbon tax implemented in South Africa results in a 1.003 percent carbon leakage in the combined carbon emissions of Mozambique, Namibia, Botswana, Nigeria and Eswatini. Overall, the post-intervention (carbon tax) trend increased yearly carbon emissions by 3.07 percent. Figure 6 provides a visual display of these results.
Table 2: Regression discontinuity results
| Regression with Newey-West Standard errors | |
| Date | 0.0207***
(6.27) |
| Carbon Tax | 0.0352
(0.79) |
| Carbon Tax * Date | 0.01003*
(1.81) |
| Intercept | 18.367***
(466.10) |
| Post-intervention liner trend | 0.0307***
(6.04) |
| F-test | 60.40*** |
T-statistics of coefficients in brackets ();*(**) [***] denote 10 percent, 5 percent, 1 percent levels of statistical significance, respectively
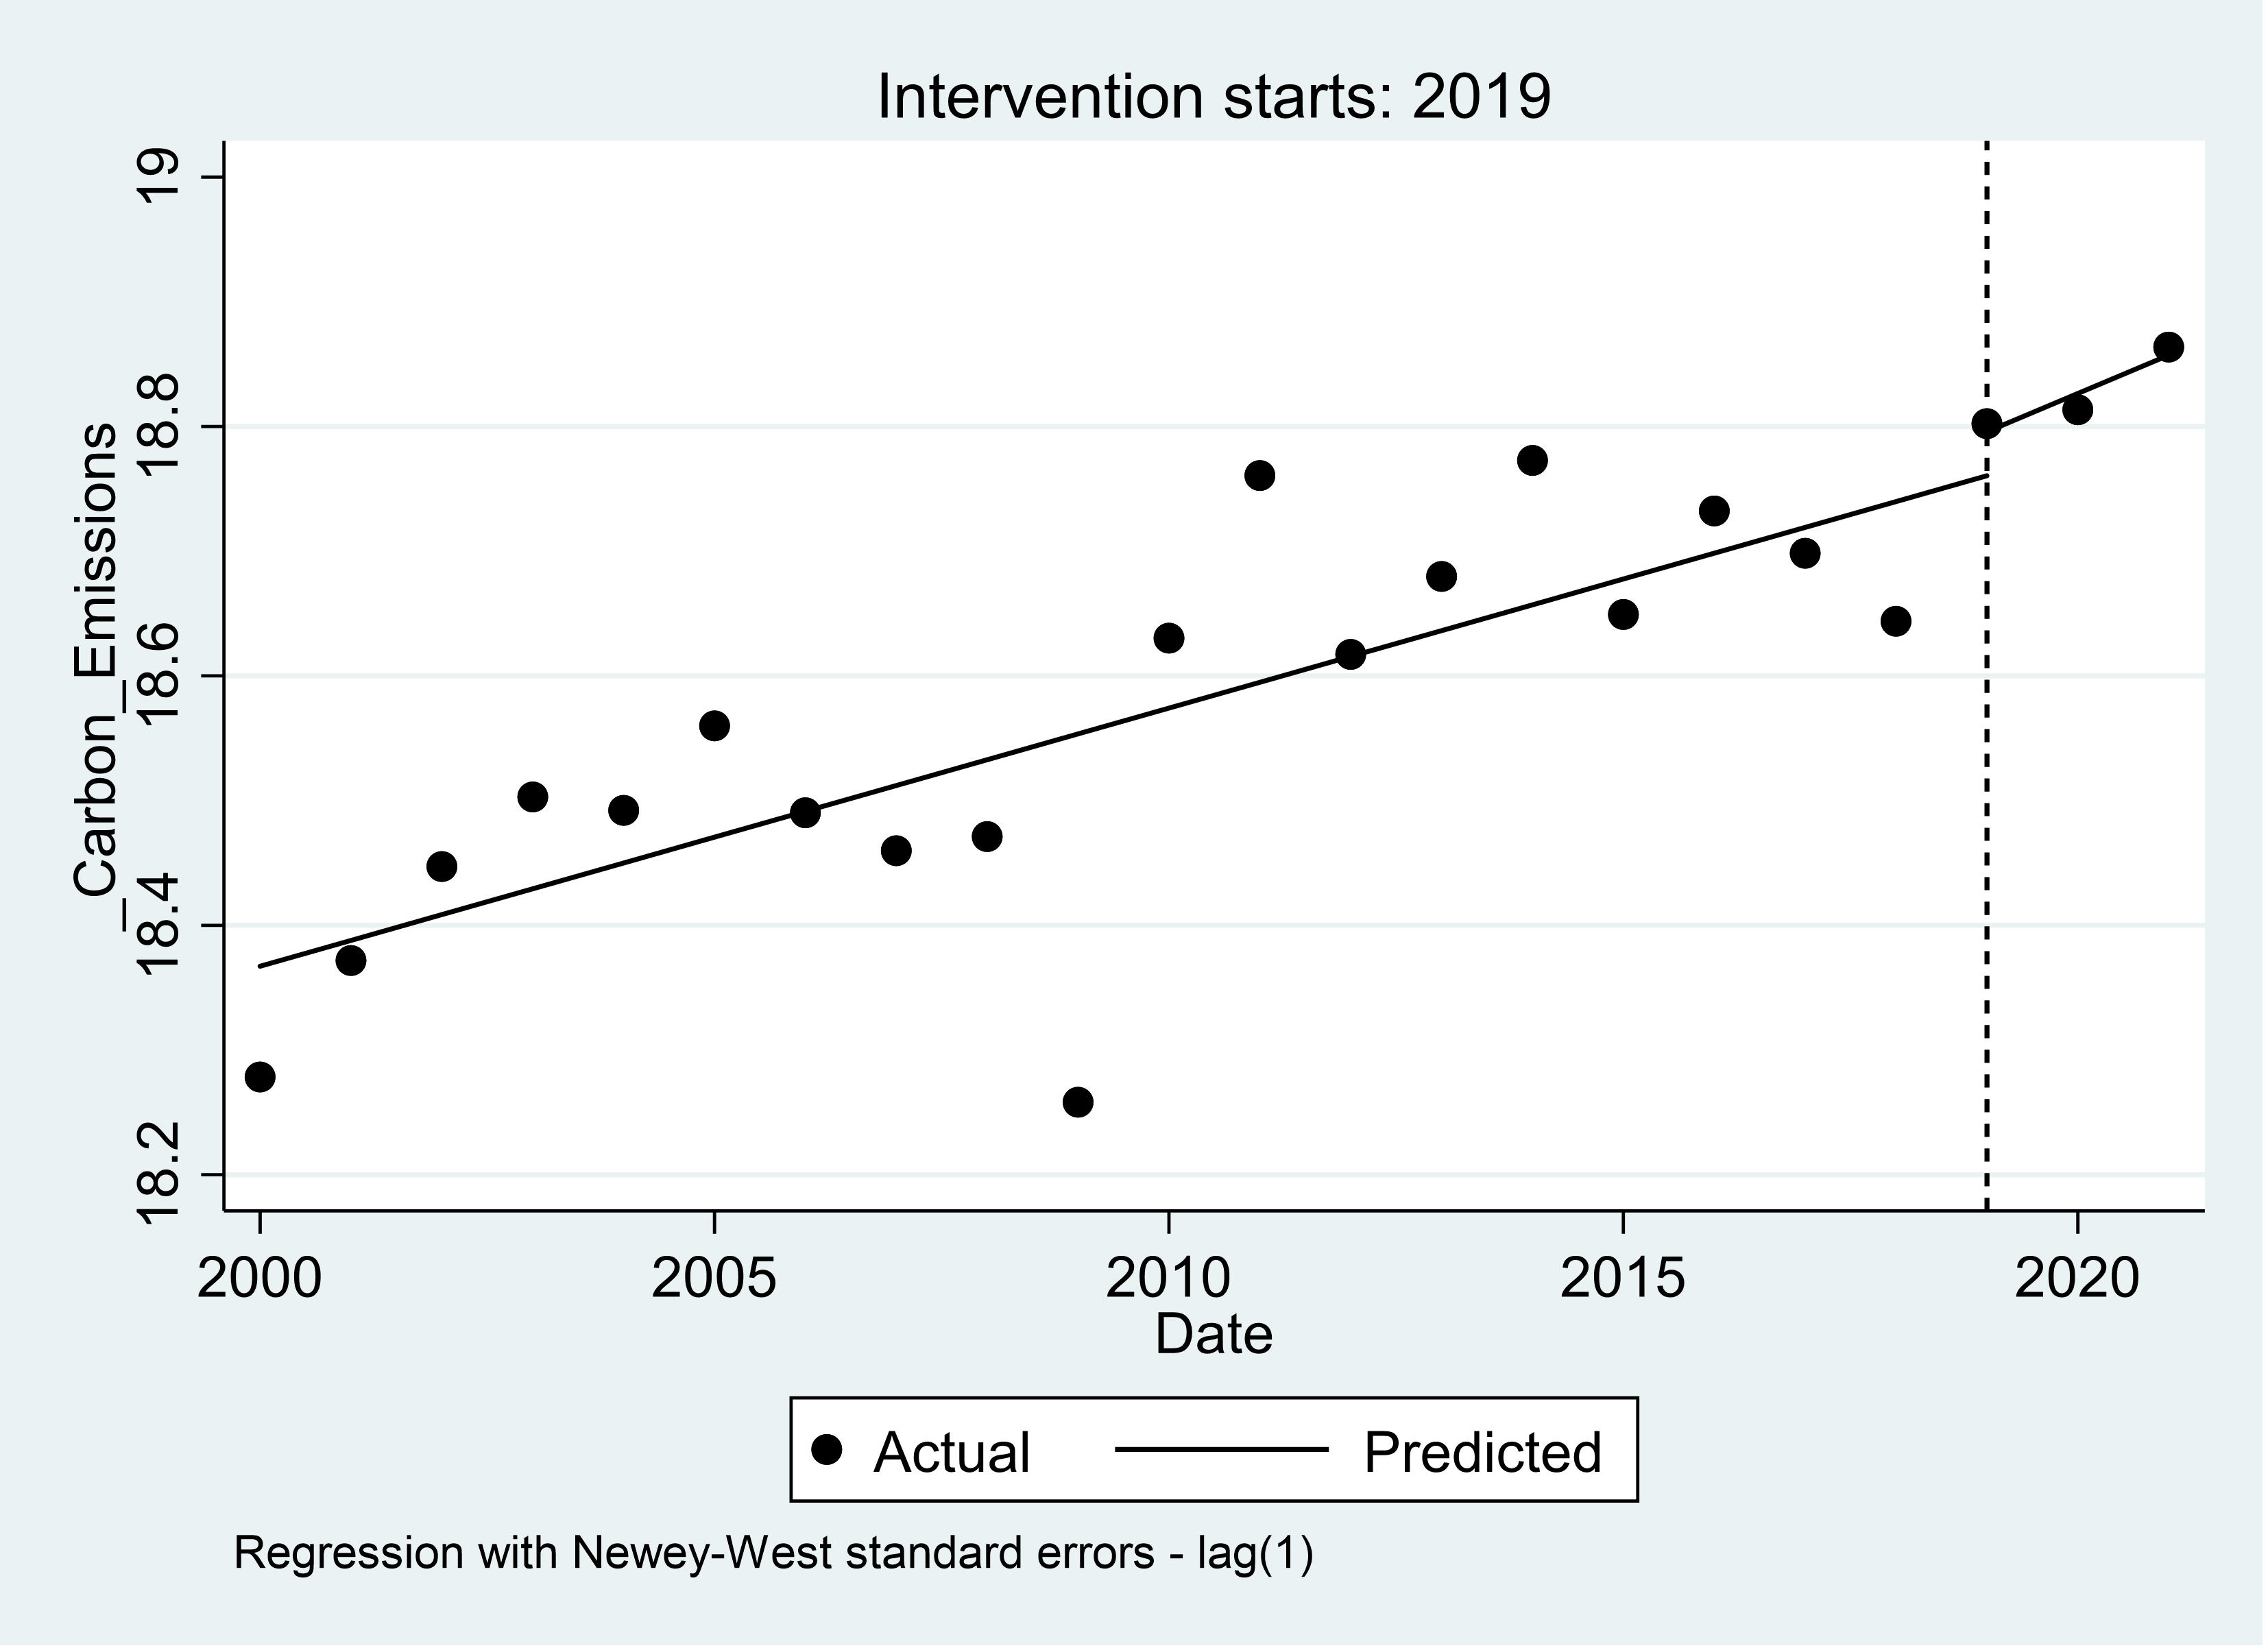
Figure 6: Mozambique, Namibia, Botswana, Nigeria and Eswatini combined carbon emissions before and after the 2019 South African carbon tax policy intervention
CONCLUSION AND POLICY RECOMMENDATIONS
The objective of this study was to use a natural experiment model to estimate the extent of carbon leakage associated with South Africa’s Carbon Tax in its top five trading African partners. The top five trading partners were Mozambique, Namibia, Botswana, Nigeria and Eswatini. This was a highly essential study and arguably a first of its kind, to infer causal impact of the carbon tax on carbon leakages using a regression discontinuity design.
The results from the regression discontinuity have shown that the carbon tax has decreased carbon emissions in South Africa by 4.64 percent in the short-term. However, that was found to not be significant. In the long-term, the carbon tax has decreased carbon emission in South Africa by 4.42 percent which was a significant result and shows the effectiveness of the carbon tax in mitigating carbon emissions. The overall post intervention trend was found to decreased yearly carbon emissions by 3.43 percent.
The results from the carbon leakage analysis have shown that as a result of the carbon tax implementation in South Africa, the carbon emissions in South Africa’s trading partners (Mozambique, Namibia, Botswana, Nigeria and Eswatini) have increased in the short-term by 3.52 percent however the results were not significant. The long-term effects of the carbon tax resulted in a 1.003 percent significant increase in carbon emissions in South Africa’s trading partners. This shows that in the long-term, the carbon tax implemented in South Africa results in a 1.003 percent carbon leakage in the combined carbon emissions of Mozambique, Namibia, Botswana, Nigeria and Eswatini. Overall, the post-intervention (Carbon tax) trend increased yearly carbon emissions by 3.07 percent in the trading partners.
The results from this analysis show that unilateral measures to reduce carbon dioxide emissions should be reassessed, as they can cause increases in carbon emissions in countries which have not implemented the carbon tax or other carbon mitigation policies. It does become important to implement universal carbon emissions to decrease the likelihood of carbon leakages. Policymakers should also consider trade restrictions to prevent the import of carbon-intensive commodities. This can decrease the likelihood of carbon leakages as firms moving from regions with emissions restrictions to region with no restrictions won’t be able to trade. This can incentive such firm to rather develop new technologies which produce output in a clean manner.
Data availability statement
The carbon emissions data for South Africa, Mozambique, Namibia, Botswana, Nigeria and Eswatini were sourced from Ritchie and Roser (2021) at https://ourworldindata.org/co2-and-greenhouse-gas-emissions
Funding Information
The author declares that no funds, grants, or other support were received during the preparation of this manuscript.
Conflict of Interest Statement
The author has no relevant financial or nonfinancial interests to disclose.
Ethical approval
The research involved no human participants or animals; thus, compliance with the ethical standard is unnecessary
REFERENCES
- Arroyo-Currás, T., Bauer, N., Kriegler, E., Schwanitz, V. J., Luderer, G., Aboumahboub, T., . . . Hilaire, J. (2015). Carbon leakage in a fragmented climate regime: The dynamic response of global energy markets. Technological Forecasting and Social Change, 90(Part A), 192-203.
- Babiker, M. H. (2005). Climate change policy, market structure, and carbon leakage. Journal of International Economics, 65(2), 421-445.
- Bor, J., Moscoe, E., Mutevedzi, P., Newell, M., & Bärnighausen, T. (2014). Regression discontinuity designs in epidemiology: Causal inference without randomized trials. Epidemiology, 25(5), 729-737.
- Branger, F., Quirion, P., & Chevallier, J. (2016). Carbon leakage and competitiveness of cement and steel industries under the EU ETS: Much Ado About Nothing. The Energy Journal, 37(3), 109–135.
- Business Partners Limited. (2022). KZN floods: economic impact update. Retrieved October 26, 2023, from https://www.businesspartners.co.za/kzn-floods-economic-impact-update/.
- Imbens, G. W., & Lemieux, T. (2008). Regression discontinuity designs: A guide to practice. Journal of Econometrics, 142(2), 615-635.
- International Monetary Fund. (2023). South Africa carbon pricing and climate mitigation policy. Retrieved July 26, 2023, from https://www.elibrary.imf.org/view/journals/002/2023/195/article-A003-en.xml#:~:text=The%20generous%20tax%2Dfree%20thresholds,about%20%248)%20by%20end%202022.
- Linden, A., & Arbor, A. (2015). Conducting interrupted time-series analysis for single- and multiple-group comparisons. The Stata Journal, 15(2), 480-500.
- Lindsey, R., & Dahlman, L. (2023). Climate change: global temperature. Retrieved October 26, 2023, from https://www.climate.gov/news-features/understanding-climate/climate-change-global-temperature#:~:text=Earth’s%20temperature%20has%20risen%20by,0.18%C2%B0%20C)%20per%20decade.
- Manne, A. (1994). The impact of unilateral carbon emissions limits, in The Economics of Climate Change. OECD, Paris.
- Manne, A., & Martins, J. O. (1994). OECD model comparison project (II) on the costs of cutting carbon emissions. Organisation for economic co-operation and development, No. 146, Working Paper.
- Maria, C. D., & van der Werf, E. (2005). Carbon Leakage Revisited: Unilateral climate policy with directed technical change. CentER Discussion Paper Series No. 2005-68, FEEM Working Paper No. 94.06.
- Naegele, H., & Zaklan, A. (2019). Does the EU ETS cause carbon leakage in European manufacturing? Journal of Environmental Economics and Management, 93, 125-147.
- Nyoka, S. (2022). Durban floods: South Africa floods kill more than 300. Retrieved October 26, 2023, from https://www.bbc.com/news/world-africa-61092334
- Paltsev, S. V. (2001). The Kyoto Protocol: Regional and sectoral contributions to the carbon leakage. The Energy Journal, 22(4), 53-79.
- Pan, W., Kim, M.-K., Ning, Z., & Yang, H. (2020). Carbon leakage in energy/forest sectors and climate policy implications using meta-analysis. Forest Policy and Economics, 115, 102161.
- Paroussos, L., Fragkos, P., Capros, P., & Fragkiadakis, K. (2015). Assessment of carbon leakage through the industry channel: The EU perspective. Technological Forecasting and Social Change, 90(Part A), 204-219.
- Perman, R., Ma, Y., Common, M., Maddison, D., & McGilvray, J. (2011). Natural resource and environmental economics (4th ed.). United Kingdom: Pearson Education Limited.
- Ritchie, H., & Roser, M. (2021). co₂ and greenhouse gas emissions. Retrieved November 16, 2023, from https://ourworldindata.org/co2-emissions#citation.
- South African Revenue Services. (2019). carbon tax. Retrieved October 26, 2023, from https://www.sars.gov.za/customs-and-excise/excise/environmental-levy-products/carbon-tax/.
- Tralac. (2023). South Africa: Intra-African trade and tariff profile 2022. Retrieved November 1, 2023, from https://www.tralac.org/resources/infographic/15181-south-africa-intra-africa-trade-and-tariff-profile.html.