
The Impact of Subsidized Fertilizer Usage on Farmer Welfare in West Java
- Hasim Ashari
- Eka Herissuparman
- M. Apuk Ismane
- 1785-1805
- Jun 17, 2024
- Agriculture
The Impact of Subsidized Fertilizer Usage on Farmer Welfare in West Java
Hasim Ashari, Eka Herissuparman, M. Apuk Ismane
Staff of the Ministry of Agricultural, DKI Jakarta, Indonesia
DOI: https://dx.doi.org/10.47772/IJRISS.2024.805118
Received: 30 April 2024; Revised: 13 May 2024; Accepted: 17 May 2024; Published: 17 June 2024
ABSTRACT
This study aims to recognize the influence of subsidized fertilizer use on the overall well-being of farmers in West Java. A qualitative analysis was employed to examine the data, using descriptive methods such as interviews and field observations. This method describes and summarizes events related to fertilizer use, offering insights into the practical aspects of fertilizer usage. In addition to the qualitative methods, a quantitative analysis was conducted. Descriptive quantitative techniques were used to assess existing policies, distribution mechanisms, and implementation. This study focused on farmers engaged in the cultivation of rice, corn, and soybeans to evaluate the impact of fertilizer subsidies on the competitive power of these agricultural commodities. The research revealed a significant influence resulting from the use of subsidized fertilizers by farmers. The findings highlight the importance of subsidized fertilizers in improving the well-being of farmers and enhancing the competitiveness of agricultural commodities. When farmers used these subsidized fertilizers, their overall well-being improved. In addition, the use of subsidized fertilizers can enhance the competitive strength of food crops. To maximize benefits, it is essential to continuously improve the system. Repairing and refining the subsidy mechanisms will ensure that farmers experience optimal advantages from the use of subsidized fertilizers. The use of subsidized fertilizers plays a crucial role in enhancing the well-being of farmers in West Java and strengthening the competitiveness of agricultural commodities. Policymakers should continue to support and expand such subsidy programs. However, it is crucial to ensure that these subsidies reach the intended beneficiaries effectively. Therefore, policymakers should regularly review and revise the policies, distribution mechanisms, and implementation strategies associated with these subsidies.
Keywords: Fertilizer, Subsidies, West Java, Data Analysis, Prosperity, Farmers
INTRODUCTION
Phenomenon growth is increasingly industrial and the rapid growth in Karawang Regency is very contradictory with the predicate Karawang Regency as National Rice Granary. This matter is seen from the reduced amount of land agriculture in Karawang Regency amounted to 652 Ha in 2015-2017 (BPS Karawang Regency 2017) as well as the increasing switch function of land agriculture becoming non-agricultural. Functional shift land agriculture. This is a threat to the resilience and security of food. However, the development of land agriculture through the utilization of marginal land yet capable balanced with switch function land agriculture is taking place. Apart from this, switch-function land agriculture also causes reduced mastery of land and income-declining farmers.
Agriculture is a very important sector in the Indonesian economy, especially in the District of Cianjur Farmers in the District Cianjur, as in many areas in Indonesia, rely heavily on fertilizer subsidized as one of the main inputs in the production process of agriculture. The Indonesian government has long provided subsidy fertilizer to increase productivity in agriculture and the welfare of farmers. However, the effectiveness of the subsidy program become a subject of study.
Indramayu Regency, which is located in West Java, Indonesia, is a contributor production significant estate of food. This National Food Barn is acknowledged as Indonesia’s National Food Barn, which produced 1,363,312 tons of grain dry milled (DMG) in 2020, equivalent to 782,132 tons of rice, or 25% of the total production of Indonesian nationals. The majority of force workers in Indramayu work in the field of agriculture, and some farmers farm paddy or fishermen. However, this region experiences challenges related to changes use of land and drought. Transition function land agriculture in the district Indramayu resulted decline production of food and threatened the resilient food nation.The transition from non-agricultural land to farming land takes place as aresult of population expansion and is further impacted by policy initiatives aimed at developing priority regions.
Water scarcity poses a significant challenge for farmers in Indramayu, affecting agricultural productivity. Insufficient rainfall and irrigation can lead to crop failure. Indonesia experienced severe droughts in 1997-1998 and 2015, as well as milder droughts in 2019 due to El-Nino events, which have intensified in response to climate change. Relying heavily on fertilizer subsidized as one of the main inputs in the production process of agriculture, the Indonesian government has long provided subsidy fertilizer to increase productivity in agriculture and the welfare of farmers. However, the effectiveness of the subsidy program Still becomes a subject of debate.
Regency Indramayu, is located in West Java, Indonesia, is a contributor production of significant state food. This National Food Barn is acknowledged as Indonesia’s National Food Barn, which produced 1,363,312 tons of grain dry milled (DMG) in 2020, equivalent to 782,132 tons of rice, or 25% of the total production of Indonesian nationals. The majority force works in Indramayu work in the field of agriculture, and some are farmers paddy, or fishermen. However, this region experiences challenges related to changes use land and drought. Transition function land agriculture in the district Indramayu resulted decline production of food and threatened the resilient food nation. Conversion land agriculture This happens in a way experience Because of the population growth and is also influenced by policy acceleration development of Priority Areas Tambourine.
Drought is a problem important to others that has an impact on agriculture in Indramayu. They influence the productivity of plants and can result fail harvests because land agriculture needs water intake so depending on bulk rain and irrigation. Drought extremes that hit Indonesia in 1997-1998 and 2015, including drought light in 2019 due to El-Nino events, increasingly increase along with climate changes.
Various efforts are currently being made to monitor and manage challenges. For example, just uses sensing data to evaluate drought Because of his abilities detect drought with accuracy high, monitoring scale large, and objective results. Apart from that, this is also done study For predict change use of land in the Regency Indramayu and its connections with plan development area priority Tambourine. Indramayu, located in West Java, Indonesia, is an area of agriculture important with diverse practices in agriculture. Following are several points important about condition agriculture:
- Climate and Geography: Indramayu is located along the beach of north Java Island, so the temperature is relatively high, ranging between 22.9°C – 30°C². This region temperate tropical with average daily temperature range between 22.9°C – 30°C, with temperature the lowest is 22°C and the highest is 32°C². This region accepts bulk Rain annually about 1287 mm with about 80 days of Rain.
- Land Use: Land in Indramayu consists of irrigated rice fields (116,675 ha), land dry (87,336 ha), and non-irrigated rice fields (92,795 ha).
- Plants: The main product produced in Indramayu is rice, so making it a rice barn national especially in West Java. Apart from rice, Indramayu is also a rice dish producer mainly oil wood white in West Java with a wide production of 8000 ha. Other plants planted include corn, cassava, beans land, and soybeans.
- Practice farming: Farmers in Indramayu are of age and productive, with low formal education, however, experienced and active in the organization. They practice agriculture ecological, which is to be expected to become a method of adaptation for reducing the loss consequence of change climate. Implementation level practice agriculture ecologically by farmers assessed currently.
- Challenge: Change climate influences sector agriculture, which has an impact on drought or flood. Several practices in agriculture, like returning straw, processing land, and controlling pest disease, are not completely in line with the principles of agriculture ecological. The research area covers three districts in West Java: Karawang, Cianjur, and Indramayu.
The study is expected to be a reference for creators’ policy in formulating strategies and policies for more agriculture effective and sustainability in the future.
- Assess the impact on the well-being of Farmers: analyze the use of fertilizer subsidies that influence the well-being economy of farmers. Analyzing surpluses for farmers and producers, as well as count loss weight die, to obtain an outlook about impact whole.
- Evaluate Power competitive, that is browse subsidy fertilizer influence power competitive plant rice, corn, and soybeans.
This study contributes to a greater understanding good about the connection between subsidy fertilizer and livelihood farmers, as well as gives an outlook valuable to the maker policies and stakeholders’ interests. Identify areas of need improved, and purposeful for increasing the the effective distribution of fertilizer and in the end increasing the well-being of farmers in West Java. This study gives an outlook comprehensive about the connection complex between subsidy fertilizer and prosperity farmers, as well as gives recommendations valuable for refinement and implementation policy.
RESEARCH METHODS
Study design
This research was conducted in West Java Province, namely Regency Karawang, Cianjur Regency, and Indramayu Regency. The area was chosen because it is a rice production center and is also based on the achievement of the realization of subsidized fertilizer based on e-RDKK in the good, medium, and poor categories, while Karawang Regency represents the medium category. The research is planned to be conducted from October 2021 to March 2022
Population and Sample
This study selected several research samples from the central to regional levels. The sample selection was carried out purposively, considering that it could represent a sample of each actor involved in the fertilizer subsidy policy and provide the information needed to answer the research objectives. Research informants included agencies/institutions, representatives of fertilizer companies, fertilizer distributors, kiosk owners, and farming households. The total number of research samples is as follows:
Data collection
The data collected includes primary and secondary data. Primary data from farmer households, shopping place owners, fertilizer distributors, officials at the central level, and company management leaders regarding fertilizer subsidy policies were collected. Primary data collection techniques were performed through interviews and observations at the research location. Secondary data were collected from government websites, literature studies, and various publications regarding fertilizer subsidy policies.
Data analysis
Data analysis was carried out quantitatively and qualitatively. In this research, data analysis predominantly uses qualitative analysis, namely analyzing data rather than using numbers. Qualitative analysis is carried out descriptively qualitatively, namely, providing a description or summary of events obtained from informants through interviews or field observations. Quantitative analysis was added and conducted using quantitative descriptive analysis.
Determining the location for this research, apart from being chosen because it is a rice center area and its spatial area, is also based on the performance achievements of the realization of subsidized fertilizers based on e-RDKK with the categorization of good, medium, and bad. Indramayu Regency represents the good category. The research was conducted from October 2021 to March 2022.
Population and Respondent Sampling
In this study, several research samples were selected from the central to regional levels. The sample selection was carried out purposively or as a purposive sample, with the consideration that it could represent a sample of each actor involved in the fertilizer subsidy policy and could provide the information needed to answer the research objectives. Research informants included agencies/institutions, representatives of fertilizer companies, fertilizer distributors, kiosk owners, and farming households. The complete number of research samples is as follows:
1) Directorate General of Agricultural Infrastructure and Facilities, cq. Directorate of Fertilizers and Pesticides
2) PT. Pupuk Indonesia at the research location (Petrokimis Gresik = 3 representative unit heads, Pupuk Kujang= 3 representative unit heads)
3) Fertilizer distributors in the research location (Indramayu= 2 distributors, Karawang= 2 distributors, Cianjur= 2 distributors)
4) Fertilizer kiosks at the research location, (Indramayu= 2 kiosk owners, Karawang= 2 kiosk owners, Cianjur= 2 kiosk owners)
5) Lowland rice farmers (Indramayu= 8 farmers, Karawang= 8 farmers, Cianjur= 8 farmers) Minimum 60 samples.
This study uses a qualitative method. Qualitative methods are used because they seek to explore phenomena more deeply and objectively (Sugiyono, 2014: 13). Meanwhile, the research design used is descriptive. Descriptive research design means in-depth exploration and targeting of research targets with interviews. A descriptive qualitative design is appropriate when used to research problems of public policy implementation (Bungin, 2011: 69). A descriptive approach was chosen because it can describe various conditions and situations in the field that are the object of research. Therefore, this descriptive research is deemed appropriate because it seeks to explain the Subsidized Fertilizer Policy in West Java Province.
The data sources used in this study were primary and secondary. Primary data are original data, answers to questions directly asked by the author and the informants, and the actions of the people appointed as informants (Sugiyono, 2014: 131). The primary data for this research are the researcher’s direct observations and interviews with informants, including; kiosk owners, fertilizer distributors to officials at the central level, and company management leaders regarding fertilizer subsidy policies. Secondary data were obtained from various reference sources, including books, articles, and other data related to research problems (Sugiyono, 2014: 131).
DISCUSSION AND RESEARCH RESULTS
Analysis of economic aspects in convenience acquires fertilizer, subsidized fertilizer in a given period. The price of subsidized fertilizer is determined by the mechanism of indirect allocation. Paying the difference between the Cost Price Sales (HPP) and the Highest Retail Prices (HET) of the subsidized fertilizers. These fertilizers are sold to the executor of the fertilizer subsidy, PT Pupuk Indonesia Holding Company (PIHC).
Budget Subsidy Development (2017-2021) Over the last five years (2017-2021), the subsidy budget has seen an average decline of 1.48% per year. The most significant decrease in the fertilizer subsidy budget occurred in 2018, amounting to USD 2.7 trillion. This was a decline from 31.2 trillion in 2017 to 28.5 trillion in 2018.
The government’s policy on fertilizer subsidies to farmers is not only related to the procurement and distribution mechanism of fertilizer. More importantly, it concerns the readiness of budget allocation, fiscal policy format, and its impact on the continuity of national fiscal and economic conditions in general (BKF, 2018).
Prior to budget allocation based on a priority scale, Lubis (2005) stated that the reduction in the fertilizer subsidy budget was caused by the existence of a budget allocator development based on a priority scale.
Figure 1. Development Budget Subsidy Fertilizer (Rp. Trillion)
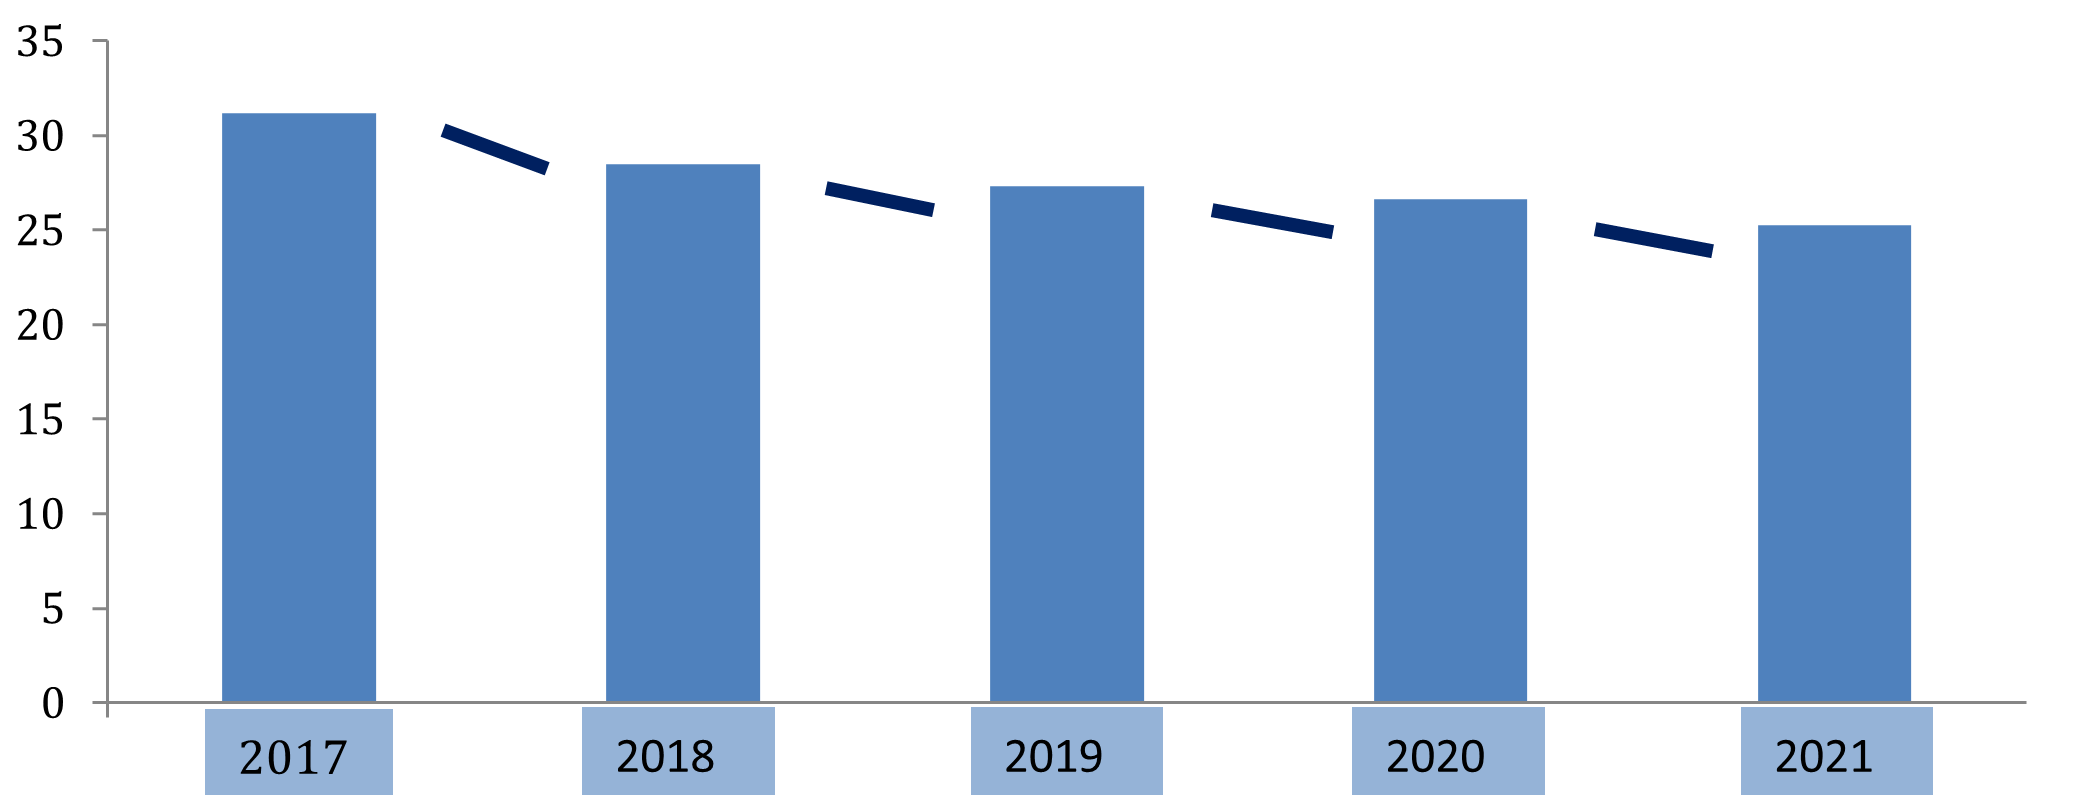
Source: Directorate Fertilizers and Pesticides Ministry of Agriculture 2022
In 2021, the budget for fertilizer subsidies will decrease by as much as 1.35 trillion compared with the 2020 budget. This budget could only fulfill the need for subsidized fertilizer ranging from 8.87 to 9.55 million tons. This is significantly below the annual fertilizer requirement, which ranges from 22.57 to 26.18 million tons. Furthermore, not all types of fertilizers can be provided at subsidized prices. In 2021, only urea and NPK fertilizers were subsidized. These types of fertilizers were chosen on the basis of the expressed needs of the farmers.
Statement from the Director of Fertilizers and Pesticides, Ministry of Agriculture, stating that a decline in the budget for subsidized fertilizer prices occurred because of the government’s limited budget. Each year, the government is only capable of allocating 8–9 million tons of subsidized fertilizer, or IDR 25 trillion up to IDR 32 trillion. The Director further explained the negative impacts of insufficient fertilizer subsidies, including potential supply seepage between regions, the emergence of scarcity issues in various regions, and the potential for inappropriate distribution of subsidized fertilizers. Additionally, there is a potential for distributors to manipulate the highest retail price (HET), which could harm small farmers.
The size of the government’s budget for fertilizer subsidies can be seen from the difference in prices between subsidized and unsubsidized fertilizers. In the decree determining HET prices for 2021, each subsidized fertilizer is priced at IDR 2,250 per kg for Urea, IDR 1,700 per kg for ZA fertilizer, IDR 2,400 per kg for SP 36 fertilizer, and IDR 2,300 for NPK fertilizer. The difference in price with their respective non-subsidized fertilizers amounts to IDR 3,650 per kg for Urea fertilizer, IDR 2,750 per kg for ZA fertilizer, IDR 2,600 for SP 36 fertilizer, and IDR 7,700 for NPK fertilizer.
Table 2. Differences in price fertilizer subsidy with non- subsidies (Rp/kg)
| No | Fertilizer Type | Subsidized Price | Subsidized Price | Difference | |
| 1 | Urea | 2,250 | 5,900 | 3,650 | |
| 2 | Za | 1,700 | 4,450 | 2,750 | |
| 3 | Sp-36 | 2,400 | 5,000 | 2,600 | |
| 4 | NPK | 2,300 | 10,000 | 7,700 |
Subsidized fertilizer price margin
The distribution of subsidized fertilizer at each level has not been adequately addressed. The responsibilities are as follows; Producers are responsible for the procurement and distribution of subsidized fertilizer from Lines I to III. Distributors are responsible for the distribution of the subsidized fertilizer from Lines III to IV. Retailers are responsible for distributing the subsidized fertilizer to farmers and/or farmer groups in Line IV. The government’s provisions for determining the price of subsidized fertilizer are as follows:
Producers must distribute subsidized fertilizer to distributors at Line III warehouses with a redemption price that is considered the Highest Retail Price (HET).
Distributors distribute fertilizer to retailers (Line-IV) with a redemption price that considers HET and implements transportation to retailer warehouses. Retailers must distribute fertilizer to farmers/Poktan in Line-IV warehouses based on RDKK with prices that do not exceed HET.
The HET for 2021 is set on the basis of the Regulation of the Minister of Agriculture Number 49 of 2020 concerning Allocation and Retail Prices Highest Fertilizer Subsidized Agricultural Sector 2021 (Table 22). To understand the price margin of fertilizer at every level of the study location, the formula used is (Azzaino, 1981):
M = H_k – H_p M=Hk−Hp
Where: M = Marketing margin (IDR), Hk = Price paid by the consumer line (IDR/Kg)
Hp = Price paid by the producer line (IDR /Kg)
The price margin of subsidized fertilizer starts from the price set by the PT Kujang and PT Petrokimia fertilizer factories, which are located in Karawang Regency. The fertilizer produced and distributed by PT Kujang includes Urea, NPK, and Organic fertilizers. SP 36 and ZA fertilizers are produced and distributed by PT Petrolina. The fertilizer is distributed to distributors located in the Cianjur District with a margin of IDR 142 per kg for Urea, NPK, and organic fertilizers. The margin for SP 36 and ZA fertilizer is IDR 110 (Table 17). The set price is the factory price, with a transportation cost of IDR 20 per kg borne by the distributor. The fertilizer subsidies received by distributors are later distributed to retailers built by distributors located near the Cianjur regency with a margin per kilogram amounting to Rp. 68 for all types of fertilizer.
This small profit margin is determined by the Standard Operating Procedure (SOP) for subsidized fertilizer distribution. This is consistent with Rizky’s (2016) research, which shows that the distribution mechanism runs by the SOP for subsidized fertilizer distribution. The amount of fertilizer distributed in Karawang is appropriate to the amount needed, as a result, it does not increase the price above the HET. However, under some conditions, retailers sell above the HET because of retail purchases, delivery of fertilizer to farmers, and purchasing credit outside the government’s provisions. This is also stated by Hamid et al. (2012), where built retailers (fertilizer kiosks) can easily manipulate the price of subsidized fertilizer to farmers due to a lack of or weak supervision by KP3.
The initial goal of forming built retailers was to ensure equal distribution of fertilizer to farmers, making it easier for them to obtain subsidized fertilizer. However, on the one hand, the formation of built retailers precisely makes the price of very subsidized fertilizer from what is set based on the HET. The high purchase price of subsidized fertilizer compared with the HET also occurred among farmer respondents. The price difference for each type of fertilizer is Rp. 106 for urea fertilizer, Rp. 454 for SP 36 fertilizer, Rp. 288 for ZA fertilizer, Rp. 239 for NPK fertilizer, and Rp. 13 for organic fertilizer. There are several reasons why farmers pay more to buy subsidized fertilizer, including farmers buying when there is not much fertilizer in the stalls, farmers buying at small parties, and farmers buying with a pay-after-harvest system.
Margin price fertilizer subsidies started from the price set by the factory PT Kujang fertilizer and factory PT Petrokimia fertilizer, which are domiciled in Karawang Regency. The fertilizers produced and distributed by PT Kujang are Urea, NPK, and Organic fertilizers. Fertilizers SP 36 and ZA types are produced and distributed by PT Petrolina. Fertilizers were distributed to distributors located in the District Cianjur with a margin of IDR 142 per kg For fertilizer Urea, NPK, and Organic types. Margin For SP 36 and ZA fertilizer amounting to IDR 110 (Table 17). The price set is the price of the factory, and the cost of transportation borne by the distributor cost transport IDR 20 per kg. Fertilizer subsidies received by distributors were later distributed to retailers built by distributors located near the regency Cianjur with a margin per kilogram amounting to Rp. 68 for all types of fertilizer.
The same results of Rizky’s (2016) research show mechanism distribution run by distributing subsidized SOP fertilizer. The amount distribution of fertilizer in Karawang is appropriate with the amount needed so that it does not cause an enhancement price above HET. However, in several conditions, retailers sell above HET because purchase retail, deliver fertilizer to farmers, and purchase credit outside the provision government. The same thing was also stated by Hamid et al. (2012) where retailers built (kiosk of fertilizer) with its easy-to-play price fertilizer subsidized to farmers because of lack of or weak supervision carried out by KP3.
The initial goal is in its form retailer built with the hope for fertilizer to spread equally from farmer to farmer with it’s easy to get fertilizer subsidized, but on one side with its shape retailer is built precisely to make the price of fertilizer very subsidized from what is set based on HET. His height price to buy subsidized fertilizer compared to HET also occurs in farmed respondents. The difference price for each type of fertilizer is Rp. 106 for Urea fertilizer, Rp. 454 for SP 36 fertilizer, Rp. 288 for ZA fertilizer, Rp. 239 for NPK fertilizer, and Rp. 13 for organic fertilizer. There are some reasons why it is more expensive to buy subsidized fertilizer among them are: that farmers buy on time. There is not much fertilizer in the stalls, farmers buy in party small, and farmers buy with system pay after harvest. There are also cases where farmers do not have money and allotment fertilizer is given to them. The compensation farmer can be one or two packs. The purchase price is the price level of the kiosk, meaning that the farmer will emit fare transportation between IDR 50 and IDR 100 per kilogram (depending on distance).
Table 3 Fertilizer Selling Price Margin Subsidized in 2021
| Fertilizer Type | Producer | Distributor | Fertilizer Kiosk | Farmer | HET 2021 Rp/kg | ||||
| Rp/kg | Margins | Rp/kg | Margins | Rp/kg | Margins | Rp/kg | Margins | ||
| Urea | 2,040 | 0 | 2,182 | 142 | 2,250 | 68 | 2,356 | 106 | 2,250 |
| SP-36 | 2,222 | 0 | 2,332 | 110 | 2,400 | 68 | 2,854 | 454 | 2,400 |
| ZA | 1,522 | 0 | 1,632 | 110 | 1,700 | 68 | 1,988 | 288 | 1,700 |
| NPK | 2,090 | 0 | 2,232 | 142 | 2,300 | 68 | 2,539 | 239 | 2,300 |
| Organic | 590 | 0 | 732 | 142 | 800 | 68 | 813 | 13 | 800 |
Source: Primary Data
Benefits of Fertilizer Subsidies for Farmers
Fertilizer subsidies are an important instrument for farmers to support productivity. The benefits of fertilizer subsidies that farmers need are farmers obtaining fertilizer that price affordable, guaranteed availability fertilizer until remote, quality fertilizer guaranteed because it has SNI standards, it improves interest farmer still farming in a way sustainable, and instrumental guard enhancement productivity agriculture national. Several benefit subsidy fertilizers in a way general according to Hutagaol et al. (2009), PSE-KP (2009), Syafa’at et al. (2006), and World Bank (2009): increasing farmers’ capital, developing the previous fertilizer market not yet works so that push cost distribution, adoption technology with reduce risk in learning technology new, improve effectiveness counseling, and organization farmers, increase productivity farmers, and improvements income business farmer.
1. Positive Impact: A characteristic directly related to subsidy fertilizer is the increasing availability of capital for farmers. With price-subsidized fertilizer, part of the farmer’s capital that should be used for buying fertilizer can be allocated to other inputs. The contribution cost for fertilizer ranges between 9% and 22 % of the total cost, depending on the measurements and technology specified. If farmers initially use a fertilizer with a lower dose, fertilizer subsidies push them to increase the optimal dose.
2. Positive Impact: Subsidy fertilizer can address the fertilizer market that has not worked in any way efficiently or happened market failure (market failure). Poor market structure competitive, asymmetry strength information between seller and buyer so the profit margin as well as cost high distribution, can be suppressed with policy subsidy fertilizer. Argument this is valid if subsidy fertilizer can provide fertilizer with principle six points, that is appropriate quantity, quality, time, price, type, and place.
Subsidy fertilizer is a push adoption technology. This is valid for farmers who do not know how to benefit from fertilizer, including dose-balanced and optimal fertilizer. With existing subsidy fertilizer, farmers do not have worries about using technology new type and dosage fertilizer because the price of fertilizer is subsidized.
3. Positive Impact: The increasing productivity with the use of draft elasticity productivity to price fertilizer and analyzes the impact of subsidy fertilizer on the productivity of several plant foods. In general, elasticity is marked negative, which means a decline price of fertilizer (subsidies price fertilizer) will increase productivity. For example, elasticity productivity paddy to price urea fertilizer, SP36, and ZA are 0.0681, 0.0799, and 0.0086, respectively. If the price of urea fertilizer decreases by 1%, the productivity of the paddy will increase by 0.0681%.
The contribution cost of fertilizer reached 22.10% of total costs production reached IDR 3,834 million / ha. With subsidy fertilizer, the contribution cost of fertilizer decreased to 17.40% of the total cost, which reached IDR 3,615 million /ha. With the assumption productivity is the same (5.50 t GKP/ha), the reduction subsidy fertilizer will lower farmers’ profit by around 12% (PSE-KP 2006).
Budget for allocation of subsidy fertilizer in 2021 amounting to 25.28 trillion equivalent with subsidy amounting to IDR 1.52 million / farmer/year or IDR 766,000/ha/ year. Types of subsidized fertilizer are urea and fonseca. With existing subsidy farmers can save the cost of farming per hectare amounting to IDR 1,926,685 for farmers respondents in the district Cianjur, IDR 2,828,740 for farmers in Karawang Regency, and IDR. 2,288,875 for farmers’ respondents who are in the Regency Indramayu (Table 3). This means that big and small benefit subsidy fertilizer is greatly affected by subsidized fertilizer usage.
Table 4. Deductions cost business farmer with use fertilizer subsidized
| Fertilizer | Cianju | r | Karawang | Indramayu | |||||
| kg | rp | mark | kg | rp | mark | kg | rp | mark | |
| Urea | 101.3 | 3,650 | 369,745 | 247.6 | 3,650 | 903,740 | 242.3 | 3,650 | 884,395 |
| NPK | 202.2 | 7,700 | 1,556,940 | 250 | 7,700 | 1,925,000 | 182.4 | 7,700 | 1,404,480 |
| Total | 1,926,685 | 2,828,740 | 2,288,875 | ||||||
Source : Primary Data
Giving proper fertilizer doses will be influential in increasing production plants. Response plants to giving fertilizer will increase if fertilizer is used appropriate type, dose, time, and method giving (Suwalan et al. 2004). Fertilizer N plays an important role in the enhancement of production in paddy fields, and the main N fertilizer source is urea (Siregar et al. 2011). Statement of this line with the result analysis of farming on-site research, especially seen in farmers’ respondents in Karawang and Indramayu Regencies. The average farmer using a urea fertilizer of 247.6 kg in Karawang Regency can produce as much as 5,735 kg of GKP, and a urea usage of as much as 242.3 kg in the Regency Indramayu can produce as much as 6,036 kg GKP. Temporary farmer respondents in the District Cianjur only used 101.3 kg urea, and the results production the rice only 4,969 kg-GKP per hectare (Table 24). Although in a way the whole usage of fertilizer contributed not much to the cost of business farmers, the impact of the usage of fertilizer can influence productivity. The contribution cost of purchasing fertilizer to the total cost of farming in the district Cianjur amounted to 12.1%, 13% in Karawang Regency, and 12.9% in Regency Indramayu is 12, 9%. From the results analysis of farming in season rain 2021, sight farmer respondents get profit more one more time from cost farming business issued. This matter is represented by more B/C ratio calculations from one or each regency resulting in a B/C Ratio of 1.10 in Cianjur: 1.29 in Karawang, and 1.26 in Indramayu.
Table 4. Analysis farming 1 ha of rice in MH 2021 (value 000 Rp)
| No | Description | Cianjur | Karawang | Indramayu | |||||||||
| Vol | Price | Mark | % | Vol | Price | Mark | % | Vol | Price | Mark | % | ||
| 1 | Farming Costs | ||||||||||||
| Seedlings / seeds | 21.4 | 15000 | 321.3 | 3.1 | 17.7 | 9400 | 166 | 1.5 | 17.1 | 12238 | 208.7 | 1.6 | |
| Tractor | 1282.4 | 12.4 | 981.2 | 8.9 | 1220.4 | 9.2 | |||||||
| Labor | 6631.8 | 64.2 | 5703.5 | 51.5 | 7419.3 | 55.7 | |||||||
| Fertilizer Organic | |||||||||||||
| Urea | 101.3 | 2320 | 235 | 2,3 | 247.6 | 2303 | 570.3 | 5.1 | 242.3 | 2446 | 592.7 | 4.5 | |
| SP 36/TSP | 157.5 | 3200 | 504 | 4.9 | 114.1 | 2400 | 273.7 | 2.5 | 207.6 | 2961 | 614.8 | 4.6 | |
| NPK | 202.2 | 2480 | 501.5 | 4.9 | 250 | 2400 | 600 | 5.4 | 182.4 | 2738 | 499.5 | 3.8 | |
| Fertilizer Inorganic | 0 | 0 | 0 | 0 | 0 | 0 | 0 | 0 | 0 | 0 | 0 | 0 | |
| Drugs | 768.9 | 7.4 | 2689.7 | 24.3 | 2670.2 | 20.1 | |||||||
| Other | 78.3 | 0.8 | 95.9 | 0.9 | 88.7 | 0.7 | |||||||
| Total Cost (value) | 10323.2 | 11080.3 | 13314.3 | ||||||||||
| 2 | Reception | ||||||||||||
| Production (kg) | 4969 | 5735 | 6036 | ||||||||||
| Selling Price (Rp / kg) | 4362 | 4438 | 4764 | ||||||||||
| Reception | 21,674,778 | 25,451,930 | 28,755,504 | ||||||||||
| 3 | Profit | 11,351,578 | 14,371,630 | 15,441,204 | |||||||||
| 4 | B/C Ratio | 1.10 | 1.29 | 1.26 | |||||||||
Analysis according to the Aspects of Regional and Target Equalization
Perspective equality use fertilizer subsidized level user reflected government in form reallocation. The Ministry of Agriculture regarding the determination of fertilizer allocation and HET subsidies in the agricultural sector mentioned that reallocation is done if there is a lack of excess fertilizer in one of the areas, with notice available and proposed allocations need fertilizer. Reallocation can be implemented by the device implementation area affair government in the field of agriculture.
The allocation returns of several fertilizer subsidies can be determined between regions, times, and types of fertilizer. This means reallocation in the region sub-district and district. Reallocation of sub-district areas can occur with a fluent, if not exceeding, quota allocation of fertilizer subsidized regency. If it’s not enough regency, they will try reallocating the need for fertilizer subsidies to the province. The matter occurred in Karawang Regency in 2021. In August 2021, the quota distribution fertilizer subsidies had run out, and farmers were absorbed. The solution government in the area has already sent a letter application to the Minister of Agriculture of the Republic of Indonesia with the number 521.33/4747/ Distance. Application letter addition quota fertilizer subsidized not yet replied. Therefore the local government expects farmers to be patient.
Relocation of subsidized fertilizer can be done in a one-period-year budget. Reallocation can be done once a year as happened in Karawang Regency in 2018. They can also be performed twice a year, as happened in the Regency Cianjur in 2018 and Karawang Regency in 2021. In fact, some eight times local governments have made reallocations, as happened in 2020 in the Regency Cianjur, Karawang, and Intraday. A detailed reason why the reallocation is not visible is stated in the Agriculture Service Decree about reallocation. Consideration of did reallocation of subsidized fertilizer in the decree only reads as follows: Anticipation possibility of lack of subsidized fertilizer because planting begins in 2019/2020.
The reason for the reallocation of fertilizer is, in essence, the shift schedule planting that has been recorded in the RDKK. This means that if the season is dry or excessive rain, then farmers will not plant or will shift the schedule to plant them. Causes of farmers not redeeming fertilizer subsidized. One of the highlights of the three regency examples, visible almost every year that is a reallocation decree utilizing fertilizer subsidies issued monthly in December. They can be interpreted as December being the final month of the One Eye budget (1 year). Temporary year front, farmers will get allotment fertilizer subsidized again. The results of relocation are important for adapting the quantity and type of subsidized fertilizer.
Table 5. Month of Issuance of Reallocation Decree Distribution Fertilizer Subsidized
| Period | 2017 | 2018 | 2019 | 2020 | 2021 |
| Cianjur | |||||
| 1 | January 25, 2017 | May 23, 2018 | May 31, 2019 | February 25, 2020 | January 14, 2021 |
| 2 | June 22, 2017 | August 27, 2018 | September 3, 2019 | March 23, 2020 | July 19, 2021 |
| 3 | September 29, 2017 | December 10, 2019 | July 2, 2020 | November 30, 2021 | |
| 4 | November 20, 2017 | December 26, 2019 | August 25, 2020 | October 4, 2021 | |
| 5 | December 4, 2017 | October 5, 2020 | |||
| 6 | October 12, 2020 | ||||
| 7 | November 27, 2020 | ||||
| 8 | December 15, 2020 | ||||
| Karawang | |||||
| 1 | January 31, 2017 | November 26, 2018 | July 31, 2019 | February 26, 2020 | January 15, 2021 |
| 2 | July 18, 2017 | December 9, 2019 | March 26, 2020 | July 27, 2021 | |
| 3 | October 31, 2017 | December 26, 2021 | June 29, 2020 | ||
| 4 | December 13 , 2017 | August 19, 2020 | |||
| 5 | December 4 , 2017 | October 2, 2020 | |||
| 6 | October 12, 2020 | ||||
| 7 | November 25, 2020 | ||||
| 8 | December 17, 2020 | ||||
| Indramayu | |||||
| 1 | January 25, 2017 | February 15, 2018 | March 5, 2019 | February 24, 2020 | January 8, 2021 |
| 2 | June 22, 2017 | June 26, 2018 | July 8, 2019 | March 23, 2020 | January 15, 2021 |
| 3 | September 29, 2017 | October 30, 2018 | December 8, 2019 | June 26, 2020 | January 18, 2021 |
| 4 | November 20, 2017 | December 21, 2018 | December 31, 2019 | August 18, 2020 | July 14, 2021 |
| 5 | December 4, 2017 | October 6, 2020 | September 27, 2021 | ||
| 6 | October 11, 2020 | November 10, 2021 | |||
| 7 | November 17, 2020 | December 1, 2021 | |||
| 8 | November 25, 2020 | December 17, 2021 | |||
| 9 | December 15, 2020 | ||||
Table 6. Distribution Fertilizer Based on Principle 6 (%)
| No | Appropriate | Cianjur | Karawang | Indramayu | |
| 1 | Amount | 53 | 13 | 27 | |
| 2 | Type | 100 | 100 | 100 | |
| 3 | Time | 27 | 20 | 27 | |
| 4 | Price | 33 | 20 | 40 | |
| 5 | Target | 27 | 0 | 13 | |
| 6 | Quality | 0 | 0 | 0 |
Source; Primary data
Policy distribution of subsidy fertilizer in a way directly or indirectly will be related important with resilience food. Policy subsidy fertilizer will influence the production of food nationally and increase the welfare of farmers. Resilience food national alone has several aspects. First, aspect availability (availability). Refers to sufficient and available food in an amount that can fulfill the need consumption, house stairs, sourced from production domestic nor import. Second, aspect stability availability (stability of supplies) is measured based on the adequacy availability of food and frequency members of House ladder in a day. Something House Ladder said own stability and availability of food if they have availability of food on cutting points and members House Ladder can consump 3 times a day by habit residents in the area. Third, affordability of food (access to supplies) is good in a way physique nor economist, views from convenience House ladder for obtain food, that is measured from ownership land as well as method ability (power buy) house ladder to obtain food. Fourth, consumption food (food utilization) refers to the type of food consumed to fulfill the need for nutrition. They are seen from there is no material the food contains animal protein and/ or vegetable consumed in House Ladder. The components mentioned above become material references if the individual, group, or country is considered its resilience food.
Resilience food is very nationally influenced by policies made by the government, for example, giving incentives to the farmer, gift subsidies, or protection provided by the government to protect domestic production. Request continuous fertilizer increase demand increase in production volumes fertilizer and adjustment policy trading fertilizer in effort guard continuity supply fertilizer domestic. A case of scarcity fertilizer, especially the urea type, is a phenomenon that occurs repeatedly almost every year.
The characterized by soaring price fertilizer at level farmers far above the HET set government. Whereas the production of urea fertilizer from five factories fertilizer for business entities (BUMN) is always at the top need domestic, so without reduced supply for the subsidized market domestic, still there is an excess supply of fertilizer about 1.3 million tons to meet the market non- subsidized fertilizer domestic ones estimated relatively small nor for the market export. However, facts on the ground show that this phenomenon still often supplies rare goods and spikes prices above HET.
Position very fertilizer important in production agriculture push mix hand government to arranging commerce fertilizer. Policy government-related problems. Subsidy fertilizer enforced since 1971 aims to push costs to cover farmers in the procurement of fertilizer so that farmers have no difficulty obtaining fertilizer because of the problem cost. Related to the phenomenon that occurs moment where this happen scarcity of supply and surge price, then it can be said that the program policy very fertilizer built by the government is not working as it should be.
Subsidy burden fertilizer arises as a consequence of existing policy government in frame provision fertilizer for farmers with price sell fertilizer lower from the market price. The main purpose of subsidy fertilizer is in order of price fertilizer in level farmers can remain affordable farmers, they can support enhancement productivity farmers, and support resilience programs food. For example, in the period 2008–2013, the realization subsidy fertilizer for distributed farmers through BUMN producer fertilizer shows a continuing trend increase.
Ascension realization budget subsidy fertilizer year2017–2021related to (1) the increasing volume of subsidized fertilizer, (2) the allocation budget for subsidy fertilizer increase not enough pay subsidy fertilizer year before, and (3) increasingly big subsidy price fertilizer (difference between HPPs with HET). For that’s government return enforce subsidies for fertilizer although still limited to plant food, because based on reality the role of fertilizer is very important in effort enhancement productivity and results in commodity agriculture that makes fertilizer as a means of production very strategic (Directorate Fertilizer and Pesticides, 2022).
The comprehensive policy on subsidized fertilizer includes the following: (1) the development of the fertilizer industry for fulfilling domestic needs and the surplus for exports, (2) market zoning, (3) the application of the Highest Retail Price (HET) according to the region so it does not burden or make it difficult for farmers to obtain it, (4) fertilizer factories receive gas subsidies as rewards for the implementation of production and distribution of subsidized fertilizer up to the retail stall according to HET, (5) the magnitude of the fertilizer subsidy is the same as the magnitude of gas subsidies and the volume of subsidized fertilizer distributed, (6) the implementation of the fertilizer subsidy and its distribution is supervised by the government and the House of Representatives (Simatupang, 2004 in Kariyasa & Yusdja, 2005).
The subsidies provided to the fertilizer industry are, of course, considered by the government as appropriate policies so that farmers can access fertilizer at low prices. However, this has caused many problems in its implementation. This issue, caused by inequality in the field, harms farmers and should become a priority for the government. The causes of inequality in the implementation of the fertilizer policy are comprehensive because there exists a conjecture of enhanced export of illegal fertilizer goods, either directly from the fertilizer producer or through smugglers. This is along with an increase in the margin between the price of urea fertilizer in the world market and that in the domestic market.
Other factors contributing to the scarcity of subsidized fertilizer in the domestic market include the leakage of fertilizer from the subsidized market to the non-subsidized market. This permeation is particularly prevalent in regions adjacent to large plantations. The policy of setting fertilizer prices has resulted in a dualistic nature of the domestic fertilizer market, namely the subsidized and non-subsidized markets. This phenomenon is allegedly due to the weak implementation of the fertilizer supervision system established by the government. Scarcity of supply and price spikes also occur as a result of fertilizer leakage from one region to another within the same market (subsidized market). Some individuals still have a strong preference for certain fertilizer brands, leading them to purchase these brands at higher prices. This behavior results in a scarcity of fertilizer in certain areas. Many fertilizer manufacturers and designated distributors do not have third-line fertilizer storage warehouses in some areas, which allegedly also contributes to the smooth distribution of fertilizer, ultimately causing a scarcity of fertilizer at the retailer or farmer level.
Despite concerted efforts to enhance the well-being of farmers through the provision of subsidized fertilizers, the outcomes have not yet reached a satisfactory level. There is a pressing need for improvements in the management of these fertilizer subsidies to ensure their effective and equitable distribution among the farmers who require them the most. Implementing a policy that involves the use of a ‘Farmer’s Card’ could facilitate a more equitable and need-based distribution of subsidized fertilizers. On the whole, the utilization of subsidized fertilizers holds significant potential for improving the well-being of farmers and enhancing the competitive strength of food crop commodities in West Java. Nevertheless, continuous improvements are necessary to ensure that the benefits of these subsidies can be optimally realized.
Karawang Regency
Karawang Regency is recognized as the largest paddy producer in West Java Province. Despite this, industrial development, which contributes more than 50% to Karawang Regency’s GRDP, has overshadowed its agricultural sector. Both agriculture and industry form the backbone of this region. Karawang Regency has implemented a program to ensure food sustainability and optimize the use of industrial areas. However, the agricultural land spread across the rural region of northern Karawang Regency currently faces several threats. These include urban development, flooding, declining irrigation, planned road development across northern West Java, and the proposed development of Cilamaya harbor. These challenges underscore efforts to preserve agricultural land by minimizing its potential to be repurposed for other uses, such as industry. Karawang Regency is often referred to as a “rice barn city” because of the productivity of its farms, as illustrated in Table 1.1, which shows the use of agricultural land in Karawang Regency. The data reveal that the extent of agricultural land in Karawang Regency has fluctuated. There was an increase of 16,601 Ha in 2013-2014, followed by a decline of 16,047 Ha in 2014-2015, and a further decline of 652 Ha in 2015-2017. Given the agricultural productivity in Karawang Regency, it has earned the moniker “Rice Granary City”. This is evident in Table 1.2, which shows rice production by Regency/City in West Java from 2010 to 2015. Regencies, which are in order second from these data, have productivity results agriculture reached 1.2 million tons/year. Productivity of rice in Karawang Regency fluctuated, with a decrease in 2011-2012 to 1,076,066 tons of 1,135,863 tons, then an increase in 2013 to 1,147,212 tons, and a decline again in 2014 to 1,122,582 tons.
The declining amount of land Agriculture in Karawang Regency is caused by several factors, such as the amount of industry and the proportion of wide paddy fields in the area, as found in Anneke Puspasari’s research on influencing factors switch function land agriculture and its impacts on income farmers in Kondangjaya Village, East Karawang District, Karawang Regency. In addition, factors like level of age, area of land, length of education, and experience farming also influence switch function land agriculture among farmers.
Regencies, which are in order second from these data, have productivity results agriculture reached 1.2 Million Tons/ Year. Productivity of rice in Karawang Regency fluctuated, with a decrease in 2011-2012 to 1,076,066 tons of 1,135,863 tons, then experienced an increase in 2013 to 1,147,212 tons, and experienced a decline again in 2014 to 1,122,582 tons.
Table 6. Rice Production Data according to Regency in West Java. (Tons/ Year), 2010- 2015
| Region | 2010 | 2011 | 2012 | 2013 | 2014 |
| Indramayu | 1,358,441 | 1,415,050 | 1,376,604 | 1,435,938 | 1,361,374 |
| Karawang | 1,133,978 | 1,135,863 | 1,076,066 | 1,147,212 | 1,122,582 |
| Subang | 919,789 | 1,059,905 | 993,661 | 1,022,571 | 964,845 |
| Garut | 894,197 | 907.011 | 925,239 | 917.503 | 972,890 |
| Cianjur | 862.229 | 790,824 | 868,538 | 882,662 | 830,545 |
| Tasikmalaya | 851.108 | 808,908 | 771,451 | 845.027 | 881.026 |
| Sukabumi | 805.924 | 724,025 | 825,788 | 767,688 | 897,485 |
| Ciamis | 724,842 | 684,837 | 604,882 | 662,779 | 448,641 |
| Bekasi | 590.403 | 574,787 | 492,408 | 537,388 | 439,504 |
| Majalengka | 580,638 | 586,691 | 600,975 | 659,403 | 634,620 |
| Bogor | 538,804 | 497,711 | 494,815 | 559,367 | 517,442 |
| Cirebon | 510,419 | 522,965 | 449,301 | 584,335 | 462,977 |
| Bandung | 459,077 | 464,425 | 479,425 | 503.912 | 475,190 |
| Sumedang | 453,303 | 460.212 | 447,546 | 503.912 | 475,190 |
| Brass | 374,925 | 383,962 | 335,867 | 369,242 | 356,550 |
| West Bandung | 267,347 | 222,899 | 230,692 | 252,712 | 256,687 |
| Purwakarta | 238,876 | 217,805 | 194,645 | 203,224 | 198,964 |
| Region | 2010 | 2011 | 2012 | 2013 | 2014 |
| Sukabumi city | 21,682 | 24,382 | 20,821 | 21,721 | 21,971 |
| Bogor city | 8,331 | 9,159 | 6,389 | 3,585 | 2,516 |
| Bandung | 8,177 | 5,668 | 13,524 | 13,654 | 9,729 |
| Bekasi city | 5,708 | 4,583 | 3,750 | 3,926 | 3,522 |
| Depok City | 4,828 | 4,985 | 3,962 | 1,880 | 2,031 |
| Cirebon City | 4,300 | 3,842. | 2,027 | 2,384 | 2,271 |
The declining amount of land Agriculture in Karawang Regency is caused by several factors, such as the amount of industry and the proportion of wide paddy fields in the area, as found in Anneke Puspasari’s research on influencing factors switch function land agriculture and its impacts on income farmers in Kondangjaya Village, East Karawang District, Karawang Regency. In addition, factors like level of age, area of land, length of education, and experience farming also influence switch function land agriculture among farmers.
Farmers in Karawang Regency, blessed with fertilizer subsidies, have index more wealth Good. Currently, stock fertilizer subsidies in the Karawang Regency area reached 7,813 tons. consists of 6,152 tons of urea and 1,661 tons of NPK, In addition, in the Klari Warehouse, the stock fertilizer subsidy moment is 2,400 tons, consisting of 1,589 tons of urea and 811 tons of NPK. Indonesian Fertilizer National has provided a stock fertilizer subsidy of as much as 936,152 tons, consisting of 562,052 tons of urea and 374,100 tons of NPK. The total stock of fertilizer subsidy is equivalent to 382% of the minimum requirements set by the Government, so the condition stock moment this can be fulfilled needs fertilizer subsidies for farmers from three Sundays to the front. Fertilizer subsidy This can only be redeemed by farmers registered via e-allocation or by the provision Regulated government in Minister of Agriculture Regulation (Permentan) Number 10 of 2022. Criteria entitled farmers redeem or accept allocation fertilizer subsidy must become member group tani, registered in SIMLUHTAN (System Information Management Counseling Agriculture), and till land maximum of two hectares. The regulation also stipulates nine commodity strategic rights accept subsidy fertilizer, that is, rice, corn, soybeans, chilies, onions red, onions white, coffee, sugar cane, and cocoa. Thus, farmers who do not comply with the criteria in Minister of Agriculture Regulation 10 of 2022 have no right to accept allocation fertilizer subsidies. Pupuk Indonesia also successfully distributed 4.17 million tons of fertilizer subsidy or 53.1% from allocation. Details distribution is as follows: 2.45 million tons of subsidized urea fertilizer has been distributed and 2.91 million tons of subsidized NPK fertilizer, including NPK for cocoa. Thus, Pupuk Indonesia will distribute around 3.68 million tons of fertilizer subsidy until the end of 2023. Apart from that, Pupuk Indonesia is encouraging farmers To redeem fertilizer at the kiosk official as an effort to avoid abuse price sell, or price ransom.
Policy application fertilizer subsidized with a Farmer’s Card can help distribute fertilizer in a way more fair and appropriate need. Overall, the usage of fertilizer subsidized its potency to increase the well-being of farmers and power competitive commodity plant food in West Java. However, it is necessary to keep going repaired so that the benefits can be felt optimally.
Regency Cianjur
Farmers in District Cianjur who receive fertilizer subsidies face challenges in obtaining adequate fertilizer allocation. Based on Regent’s Decree Cianjur Number 06 of 2021, the total allocation of fertilizer subsidy to Cianjur was only 92,095 tons, while in 2020, Cianjur accepted an allocation amounting to 134,530 tons. The largest decline in allocation occurs in fertilizer subsidy types SP-36 and ZA. In 2020, Cianjur accepted SP-36 allocation is 14,145 tons, whereas in 2021 it will only be 319 tons. For type ZA, in the year previously there were 8,703 tons, whereas in 2021 it will only be 1,650 tons. Likewise for NPK type, in the year previously accepted allocation is 51,130 tons, whereas in 2021 it will only be 31,102 tons. Although Urea and organic allocation also undergo decreased, but not too significant. In addition, this year, the government is increasing the allocation of organic fertilizer. Although allocation is limited, farmers in Cianjur still try to maintain productivity. Although not all farmers receive fertilizer subsidies, the harvest results are still good and sufficient to meet food needs.
Need noted that fertilizer subsidy is only given to farmers who work nine commodity strategies, i.e., rice, corn, soybeans, chilies, red onions, white onions, coffee, sugarcane, and cocoa.
Table 7. Allocation fertilizer subsidized in Cianjur For 2020 and 2021:
| Fertilizer Type | Allocation (tonnes) | Allocation (tonnes) |
| SP-36 | 14,145 | 319 |
| ZA | 8,703 | 1,650 |
| NPK | 51,130 | 31.102 |
SP-36 In 2020, Cianjur received 14,145 tons of SP-36, but in 2021 the allocation decreased significantly to only 319 tons. ZA: Likewise, ZA’s allocation fell from 8,703 tons in 2020 to 1,650 tons in 2021. NPK NPK allocation also experienced a decline from 51,130 tons in 2020 to 31,102 tons in 2021. Although there is a decline, farmers in Cianjur still endeavor to increase productivity, ensuring that sufficient food is harvested.
Indramayu Regency
Farmers in the Indramayu District face challenges in receiving an adequate allocation of fertilizer. Based on the Regent’s Decree Indramayu Number 06 of 2021, the total allocation of fertilizer subsidy for Indramayu was only 92,095 tons, while in 2020, Indramayu received an allocation amounting to 134,530 tons. A decline in allocation occurred in fertilizer subsidies for the SP-36 and ZA types. In 2020, Indramayu received an SP-36 allocation of 14,145 tons, whereas it was only 319 tons in 2021. For the ZA type, there were 8,703 tons in the previous year, whereas there were only 1,650 tons in 2021. Similarly, for the NPK type, the allocation was 51,130 tons in the previous year, whereas it was only 31,102 tons. Although the allocations for Urea and organic fertilizers also decreased, the reduction was not significant. In addition, the government is increasing the allocation of liquid organic fertilizer. Despite the limited allocation, farmers in Indramayu continue to strive to maintain productivity. Although not all farmers receive fertilizer subsidies, the harvest results are still good and sufficient for food needs.
It should be noted that fertilizer subsidies are only given to farmers who cultivate nine strategic commodities, namely rice, corn, soybeans, chilies, red onions, white onions, coffee, sugarcane, and cocoa. Farmers who do not cultivate these commodities no longer receive fertilizer subsidies.
Table 8. Summary allocation fertilizer in the District Indramayu 2020 and 2021:
| Fertilizer Type | Allocation (tonnes) | Allocation (tonnes) |
| SP-36 | 14,145 | 319 |
| ZA | 8,703 | 1,650 |
| NPK | 51,130 | 31.102 |
SP-36 In 2020, Indramayu received 14,145 tons of SP-36; however, in 2021, the allocation decreased significantly to only 319 tons.
ZA: Likewise, ZA’s allocation fell from 8,703 tons in 2020 to 1,650 tons in 2021. NPK: NPK allocation also declined from 51,130 tons in 2020 to 31,102 tons in 2021. Despite a decline in production, farmers in Indramayu Keep endeavoring endeavor increase productivity, ensuring results harvest still sufficient need food.
Impact Policy Fertilizer Subsidized to Enhancement Production Agriculture in West Java
Connection between fertilizer subsidies and welfare for farmers in West Java. In-depth study in the field helps takers policy in making the right decision to use increased productivity agriculture and livelihoods rural.
1. Enhancing the well-being of farmers
Subsidy fertilizer role is important in reducing the cost of production of plant food like rice, corn, and soybeans. With price more fertilizer affordable, farmers can save expenditure. Enhancement budget subsidy fertilizer Hopefully, it can maximize income for the farmer. However, it should be noted that although budget subsidies increased, the prosperity of farmers planting food from 2015 to 2017 tended to decline.
2. Competitiveness commodity plant food
Subsidy Fertilizer also impacts power competitive commodity plant food. With cost more production low commodities like rice, corn, and soybeans become more competitive in the market. Farmers can allocate source Power more efficiently so that results harvest better and powerful competitive product increase. Although there is an effort to increase the well-being of farmers through subsidy fertilizer, the results are not yet fully satisfactory. Perform evaluation and improvement in management subsidy fertilizer to make it more effective and equitable for farmers who need it. Policy application fertilizer subsidized with card Farmers can help distribute fertilizer in a way that is fairer and appropriate to the needs of every farmer.
Although there is an effort to increase the well-being of farmers through subsidy fertilizer, the results are not yet fully satisfactory. Need repair in management subsidy fertilizer to be more effective and equitable for farmers who need it. Policy application fertilizer subsidized with a farmer’s card can help distribute fertilizer in a fair and appropriate manner. Overall, the use of fertilizer subsidized its potency to increase the well-being of farmers and power competitive commodity plant food in West Java. However, it is necessary to keep going repaired so that the benefits can be felt optimally.
CONCLUSIONS
The Karawang Regency in West Java Province plays a significant dual role. It is not only the region’s largest rice producer but also contributes more than 50% to the Gross Regional Domestic Product (GRDP) of the regency through its industrial sector. Karawang Regency has implemented a sustainable food land defense program and optimized the use of industrial areas based on its agricultural and industrial sectors. However, it faces challenges with agricultural land in the northern rural areas, which are threatened by urban development, flood risk, reduced irrigation, and plans to build the northern West Java highway and Cilamaya port. Therefore, efforts to defend agricultural land are crucial to minimize the potential for conversion of agricultural land to other uses, such as industry. With its high agricultural productivity, Karawang Regency has earned the title of the City of Lumbung Padi. Data on rice production show a significant contribution from Karawang Regency in meeting the food needs of the West Java region.
Farmers in the Indramayu Regency face challenges in obtaining adequate fertilizer allocations. In 2021, the allocation of subsidized fertilizer for Indramayu decreased significantly compared with that in 2020, with the largest decrease occurring in SP-36 and ZA fertilizer types. Despite this, farmers in Indramayu strive to maintain their productivity. Note that subsidized fertilizer is only given to farmers who cultivate nine strategic commodities, namely rice.
Similarly, farmers in Cianjur Regency face challenges in obtaining adequate fertilizer allocation. Based on the Decree of the Regent of Cianjur Number 06 of 2021, the total allocation of subsidized fertilizer for Cianjur in 2021 was only 92,095 tons, a decrease from the 134,530 tons received in 2020. The largest decrease in allocation occurred for the subsidized fertilizer types SP-36 and ZA. Despite the limited allocation, the government is increasing the allocation of liquid organic fertilizer. Farmers who do not cultivate the nine strategic commodities no longer receive subsidized fertilizer allocations. However, despite the decrease in allocations, the harvest remains good and meets food needs.
Subsidized fertilizer significantly impacts the welfare of farmers in West Java. This subsidy plays an important role in reducing the production costs of food crops such as rice, corn, and soybeans, enabling farmers to save on fertilizer costs. Even though the subsidy budget has increased, the welfare of food crop farmers from 2015 to 2017 has tended to decline. Therefore, it is necessary to evaluate and improve the management of fertilizer subsidies. Fertilizer subsidies also impact the competitiveness of food crop commodities. With lower production costs, commodities such as rice, corn, and soybeans become more competitive in the market. However, efforts to improve farmers’ welfare through fertilizer subsidies have not yielded completely satisfactory results. The policy of implementing subsidized fertilizer with the Tani Card can help distribute fertilizer more equitably and according to needs. Overall, the use of subsidized fertilizer has the potential to improve farmer welfare and the competitiveness of food crop commodities in West Java, but it needs to be continually improved for the benefits to be optimally felt.
DECLARATION
The Authors have no conflict of interest for this Project.
REFERENCES
- Ashari, Hasyim &Fahmid, Imam & Ali, M &Useng, Daniel. (2023). Study of Subsidized Fertilizer Distribution System in Karawang Regency, West Java-Indonesia. Journal of Advanced Zoology. 44. 300-310. 10.17762/jaz.v44i4.1525.
- Ashok Gulati Pritha Banerjee. 2015. Rationalising Fertilizer Subsidy in India: Key Issues and Policy Options. Indian Council for Research on International Economic Relations.
- AdangAgustian, Hermanto, Ketut Kariyasa, SupenaFriyatnodan Deri Hidayat, 2017. Kajian Kebijakan Subsidi Pupuk : Harga, Distribusi dan Dampaknya terhadap Permintaan Pupuk dan Produksi Tanaman Pangan. Jakarta : Pusat Sosial Ekonomi dan Kebijakan Pertanian, Sekretariat Jenderal, Kementerian Pertanian
- Azzaino, M. 1981. PengantarTataniaga. Ghalia Indonesia. Jakarta.
- Ahmet Ali Koc, T. Edward Yu, Taylan Kiymaz and Bijai Prasad Sharma. 2019. Effects of Government Support and Credits on Turkish Agriculture. emeraldinsight.com/2044-0839.htm
- Ashari, M. L., &Hariani, D. (2019). Analisisefektivitas program kartutani di KecamatanBanjarnegara, KabupatenBanjarnegara. Journal of Public Policy and Management Review, 8(2), 1-21.
- Ahmet Ali Koc, T. Edward Yu, Taylan Kiymaz and Bijai Prasad Sharma. 2019. Effects of Government Support and Credits on Turkish Agriculture. emeraldinsight.com/2044-0839.htm
- Ahmed S Elrys, Mohamed K Abdel Fattah, Sajjad Raza, Zhujun Chen dan Jianbin Zhou. 2019. Spatial Trend in The Nitrogen Budget of The African Agrofood System Over the Past Five Decades. Environmental Research Letters. Environ. Res. Lett. 14 (2019) 124091.
- BPS Kabupaten Karawang Tahun 2017
- BKF. (2016). Kajian Kebijakan Pemerintah, Analisis Kebijakan Subsididiunduhtanggal 22 Agustus 2019 dari http://www.fiskal.kemenkeu.go.id/dwkontenview.asp?id=20160927112742261370982BKF. (2016).
- Burhan, Bungin. (2011). PenelitianKualitatif:Komuniaksi, Ekonomi, Kebijakan Publik dan IlmuSosialLainnya.Jakarta: Kencana.
- Catherine Ragasa dan Antony Chapoto. 2017. Moving in The Right Direction? The Role of Price Subsidies in Fertilizer Use and Maize Productivity in Ghana. Springer Science+Business Media Dordrecht and International Spciety for Plant Pathology.DO1 10. 1007/s1257-017-0661-7
- V. dan C. Muslim. 2007. Revitalisasi Kebijakan Sistem Distribusi Pupukdalam Mendukung Ketersediaan Pupuk Bersubsidi di Tingkat Petani. Jurnal Ekonomi dan Pembangunan XV(2).
- Dharmawan, A. H. (2001). Farm household livelihood strategies and socio-economic changes in rural Indonesia.
- DirektoratJenderalPrasaran dan Sarana Pertanian. (2019). MekanismePenyaluranPupukBersubsidi. Bahan Tayang FGD Kartu Tani. Depok
- E Rustiadi, S Saefullah S, DR Panuju.2004. Perencanaan dan Pengembangan Wilayah. Edisi Juli 2007. Bogor: FakultasPertanian IPB.
- ET Jaja and LI. Barber. 2017. Organic and Inorganic Fertilizers in Food Production System in Nigeria. Journal of Biology, Agriculture and Healthcare, Vol.7 (18): 5155.
- Feryanto, W.K, &Mantau, Z. (2010).Pupukdan subsidi: Kebijakan yang tidak tepatsasaran. Diunduhtanggal 16 Agustus2019 darihttp://feryanto.wk.staff.ipb.ac.id/2010/05/20/koperasi-dan-posisi-tawarpetani/.
- Hadi,P.U., B. Rachman, dan V. Darwis. 2011. Laporan Awal Kajian StrategisKebijakanSubsidiPertanian yang Efektif, Efisien dan Berkeadilan. Kementerian Perencanaan Pembangunan Nasional.
- Holden, S. (2018). The economics of fertilizer subsidies.
- H Kuntyastuti, Sutrisno, SAD Lestari. 2020. Effect of application of organic and inorganic fertilizer on soybean yield in lowland Vertisols. Journal Of Degraded And Mining Lands Management, Vol. 8(1):2439-2450.
- Houssou, N., Andam, K. S., & Collins, A. A. (2017). Can better targeting improve the effectiveness of Ghana’s Fertilizer Subsidy Program?(Vol. 1605). Intl Food Policy Res Inst.
- Khudori. (2008).Ironi negeri beras.Yogyakarta: Insist Press.
- Kementerian Pertanian. (2017). Petunjukpelaksanaanpupukbersubsidi 2019. Jakarta: Ditjen Saran dan PrasaranaPertanian, Kementerian Pertanian.
- Kurniawati, E., & Kurniawan, A. (2018). Persepsimasyarakatterhadappenggunaankartutani di Kabupaten Pati: Kasus di Desa Wotan dan Desa Pakem, KecamatanSukolilo. Jurnal Bumi Indonesia, 7(4), 1-15.
- Lubis, K.A. (2015). Kesejahteraan rakyat dan alokasianggaran. Jakarta: Badan Pendidikan dan
- Muharjono,ZeinSyarif.2006.PembangunanPertanian.Jakarta.UniversitasTerbuka.
- Moko, K. W., Suwarto, & Utama, B. W. (2017). Perbedaanpersepsipetaniterhadap program kartutani di KecamatanKalijambe, KabupatenSragen. Journal of Sustainable Agriculture, 32(1), 9-13
- Mulyadiana, A. T., Marwanti, S., & Rahayu, W. (2018, March). Analysis of the effectiveness of fertilizer subsidy policy and its effect on rice production in Karanganyar Regency. In IOP Conference Series: Earth and Environmental Science(Vol. 142, No. 1, p. 012047). IOP Publishing.
- PSE-KP (Pusat AnalisisSosial Ekonomi dan KebijakanPertanian). KonstruksiKebijakanPupuk 2006. PSE-KP, Bogor.
- PSE-KP (Pusat AnalisisSosial Ekonomi dan KebijakanPertanian). 2009. PengalihanSubsidiPupukkeSubsidiBenih, AnalisisKebijakan. PSE-KP, Bogor.
- Rizky AlifiaWindari, 2016.AnalisisSistemDistribusiPupukBersubsidi PT Pupuk Kujang Cikampek, DepartemenAgribisnisFakultas Ekonomi dan ManajemenInstitutPertanian Bogor.
- Sukana, E. dan N. Tejoyuwono. 1988. PerananPupukdalam Pembangunan Pertanian. Makalah disampaikan pada Diskusi Nasional IV AsosiasiProdusenPupuk Indonesia, Yogyakarta, 20-21 Desember 1988.
- Syafaat, N., M. Rachmat, dan H.P. Saliem. 1999. AlternatifKebijaksanaanPenghapusanSubsidiPupuk dan PemberianInsentifUsahatani Padi. Dalam T. Sudaryanto (Ed.). Analisis dan PerspektifKebijaksanaan Pembangunan Pertanian Pasca Krisis Ekonomi. Monograph Series No. 20. Pusat PenelitianSosial Ekonomi Pertanian. Bogor.
- Susila, W.R. 2010.KebijakanSubsidiPupuk: Ditinjau Kembali. JurnalLitbangPertanian 29(2): 43-49.
- Syafa’at, N., A. Purwoto, M. Maulana, dan C. Muslim. 2006. AnalisisBesaranSubsidiPupuk dan Pola Distribusinya. Laporan Akhir Penelitian, Pusat AnalisisSosial Ekonomi dan KebijakanPertanian, Bogor.
- Siregar A, Marzuki I. 2011. EfisiensiPemupukan Urea Terhadap Serapan N dan PeningkatanProduksi Padi Sawah (Oryza sativa. L.). JurnalBudidayaPertanian, Vol. 7(2): 107-112.
- Suwalan S, Nana S, Bambang S, R. Kusmawa, Ardi. 2004. PenggunaanPupukAlternatif pada Tanaman Padi Sawah di KabupatenGarut, Jawa Barat. KebijakanPerberasan dan InovasiTeknologi Padi. PuslitbangTanaman Pangan, Bogor.
- Kementerian Pertanian (Kementan). 2021. Permentan No. 49/2020. HET PupukBersubsidi. Jakarta.
- K Kakar, TD Xuan, Z Noori 3, S Aryan, and G Gulab. 2020. Effects of Organic and Inorganic Fertilizer Application on Growth, Yield, and Grain Quality of Rice.. Agriculture 2020,. Vol 10 (544): 1-11.
- K, M. Maulana, dan S. Mardianto. 2004. Usulan Tingkat Subsidi Harga EceranTertinggi (HET) yang Relevan Serta Perbaikan Pola PendistribusianPupuk di Indonesia. AnalisisKebijakanPertanian 2(3): 277-287.
- M Gebska, A Grontkowska, W Swiderek and B Golebiewska. 2020. Farmer Awareness and Implementation of Sustainable Agriculture Practices in Different Types of Farms in Poland. Sustainability 2020, 12 (8022): 1-17.
- Madhur Gautam. 2015. Agricuitural Subsidies: Resurging Interest in a Perennial Debate. Ind. Jn. Of Agri. Econ. Vol 70, No 1. 83 – 105.
- NK Arora. 2018.Agricultural sustainability and food security. EnvironmentalSustainability1:17–219
- PSEKP. 2009.Pengalihan Subsidi Pupukke Subsidi Benih. Makalah Analisis Kebijakan. Pusat Analisis Sosial Ekonomi dan Kebijakan Pertanian. Bogor.
- Rachman, B. 2009. Kebijakan Subsidi Pupuk: Tinjauan Terhadap Aspek Teknis, manajemen dan Regulasi. Jurnal Analisis Kebijakan Pertanian, Vol. 7(2), Juni 2009: 131-146.
- Ramli, N. N, M. N. Shamsudin, Z. Mohamed, and A. Radam. 2012. The Impact of Fertilizer Subsidy on Malaysia Paddy/Rice Industry Using a System Dynamics Approach. International Journal of Social Science and Humanity, Vol. 2, No. 3, May 2012:213-219.
- R Tarigan. 2012. Ekonomi Regional: Teori dan Aplikasi. Bumi Aksara. Jakarta.
- Rusastra, I W., R. Kustiari, dan E. Pasandaran. 1997. DampakPenghapusanSubsidiPupukTerhadapPermintaanPupuk dan Produksi Padi Nasional. JurnalAgro Ekonomi 16(1&2): 31-41.
- Ragimun, R., Makmun, M., & Setiawan, S. (2020). Strategi PenyaluranPupukBersubsidi di Indonesia. JurnalIlmiah M-Progress, 10(1).
- Sundari, S., & Halim, S. (2020, May). Analysis of fertilizer subsidy policy in supporting food security in Karawang District, West Java Province policy 2013-1017. In 1st Borobudur International Symposium on Humanities, Economics and Social Sciences (BIS-HESS 2019)(pp. 810-815). Atlantis Press.
- SRSingh,DKKundu,PDey,PSinghandBSMahapatra. 2018. Effect of balanced fertilizers on soil quality and lentil yield in Gangetic alluvial soils of India. TheJournalofAgriculturalScience,156(2): 225 -240.
- Sugiyono. (2014). Metode Penelitian Kuantitatif, Kualitatif, dan R & D. Bandung: Alfabeta.
- Susilowati, S.H., B. Sayaka, E. Suryani, dan Wahida. 1998. Analisis Usahatanidalam Perspektif Insentif Ekonomi Kebijakan Harga Input-Output. Dalam Suryana (Ed.). Analisis Kebijakan Pembangunan Agribisnis di Perdesaan dan Analisis Dampak Krisis. Monograph Series No.18. Pusat Penelitian Sosial Ekonomi Pertanian. Bogor.
- Swastika, D.K.S., Sumaryanto, N. Ilham, dan A. Supriatna. 1999, Respon Petani Terhadap Kebijakan Penghapusan Subsidi Pupuk dan Kenaikan Harga Gabah. Dalam Sudaryanto(Ed.). Analisis dan Perspektif Kebijaksanaan Pembangunan Pertanian Pasca Krisis Ekonomi. Monograph Series No. 20. Pusat Penelitian Sosial Ekonomi Pertanian. Bogor.
- Syafaat, N., M. Rachmat, dan H.P. Saliem. 1999. Alternatif Kebijaksanaan Penghapusan Subsidi Pupuk dan Pemberian Insentif Usahatani Padi. Dalam Sudaryanto (Ed.). Analisis dan Perspektif Kebijaksanaan Pembangunan Pertanian Pasca Krisis Ekonomi. Monograph Series No. 20. Pusat Penelitian Sosial Ekonomi Pertanian. Bogor.
- Sri Sundari dan Supandi Halim. 2019. Analysis of Fertilizer Subsidy Policy in
- Supporting Food Security in Karawang District, West Java Privince Policy 20132017. 1st Borobudur International Symposium on Humanities, Economics and Social Science (BIS-HESS 2019). Advances in Social Science, Education and Research, volume 436: 810-815.
- Sularno, S., Irawan, B., & Handayani, N. (2017).Analisis Pelaksanaan Kebijakan dan DistribusiPupukBersubsidi di Kabupaten Karawang Jawa Barat. Jurnal Agrosains dan Teknologi, 1(2), 73-87.
- T Girma, S Beyene and B Biazin. 2017. Effect of Organic and Inorganic Fertilizer Application on Soil Phosphorous Balance and Phosphorous Uptake and Use Efficiency of Potato in Arbegona District, Southern Ethiopia. Journal of Fertilizers & Pesticides 2017, Vol 8 (3): 1-6.
- Takeshima, H., & Liverpool-Tasie, L. S. O. (2015). Fertilizer subsidies, political influence and local food prices in sub-Saharan Africa: Evidence from Nigeria. Food Policy, 54, 11-24.
- Tempo. 2012. Agustus, Distribusi Pupuk Bersubsidi Diubah. Tempo, Kamis 21 Juni 2012.
- Takeshima, H., & Liverpool-Tasie, L. S. O. (2015). Fertilizer subsidies, political influence and local food prices in sub-Saharan Africa: Evidence from Nigeria. Food Policy, 54, 11-24.
- Yiduo Sun, Ruifa Hu and Chao Zhang. 2019. Does the Adoption of Complex Fertilizer Contribute to Fertilizer Overuse? Evidence From Rice Production in China. Journal of Cleaner Production, Vol 219: 677-685.
- Yichao Wang and Yonglong Lu. 2020. Evaluating The Potential Health and Economic Effects of Nitrogen Fertilizer Application in Grain Production Systems of China. Journal of Cleaner Production, Vol 264: 121635.
- Watiha, A. H., Yusra, A., & Kurniati, D. (2012). Analisissalurandistribusi dan efisiensipemasaranpupukbersubsidi di Kecamatan Selakau Kabupaten Sambas. Jurnal Social Economic of Agriculture, 1(3).
- World Bank. 2009b. Indonesia Agricultural Public Spending and Growth, Policy Note. Indonesia Agriculture Public Expenditure Review, the World Bank, Jakarta.
- Von Uexkull, H.R. 1988. Fertilization Situation in Asia and Its Effect on Small Scale Farms. Agro Chemical News in Brief XI (3): 5-13