
The Options of Investment or Trading in ABMM Stock on The Indonesia Stock Exchange
- I Made Suparta
- Reza Akbar Mauliza
- 2475-2488
- Feb 12, 2025
- Economics
The Options of Investment or Trading in ABMM Stock on the Indonesia Stock Exchange
I Made Suparta*, Reza Akbar Mauliza
Department of Economic Development, Universitas 17 Agustus 1945 Surabaya, Indonesia
*Corresponding Author
DOI: https://dx.doi.org/10.47772/IJRISS.2025.9010199
Received: 30 December 2024; Accepted: 08 January 2025; Published: 12 February 2025
ABSTRACT
This study aims to assess whether ABMM shares are more advantageous as an investment option or for active trading. The analysis utilizes secondary data derived from the financial statements of PT ABM Investama Tbk and stock price charts. The approach encompasses descriptive analysis through fundamental analysis, examining financial performance, alongside technical analysis to evaluate potential price fluctuations. The findings indicate that ABMM shares possess strong potential for both long-term investment and short-term trading strategies. In the long run, the stock demonstrates positive growth opportunities driven by solid financial performance and appealing dividends; however, certain risks need to be acknowledged, including considerable debt levels and potentially overvalued shares. For short-term trading, current bearish market trends combined with identifiable support levels present opportunities for buying shares with the intent of achieving quick profits. For an investor, when the stock price falls, investors can increase the number of shares they own by buying and when the price rises above its fair price, investors can sell it to take profit to get capital gain. Meanwhile, for a trader, after buying shares, the choice is only one of two alternatives, namely taking profit when the stock price rises or cutting loss when the stock price falls.
Keywords: Investment, Trading, ABMM Stock, Fundamental Analysis, Technical Analysis
INTRODUCTION
Based on information from the official website of the Indonesia Stock Exchange (IDX), the capital market is a means to trade various long-term financial instruments, such as stocks, bonds, mutual funds, and other derivative instruments. Based on Law Number 8 of 1995 concerning the Capital Market, activities in the capital market include Public Offerings, Securities trading, and activities of Public Companies related to the Securities they issue, including supporting institutions and professions. Given its dynamic nature, investors need to understand the characteristics of the capital market and prepare strategies to deal with its potential impact on their investments.
Stocks “are one of the most popular financial market instruments. Issuing shares is one of the company’s choices when deciding on corporate funding. On the other hand, stocks are an investment instrument that is widely chosen by investors because stocks can provide attractive levels of return (Bursa Efek Indonesia, 2024)”. Stocks are proof of ownership of capital deposited by individuals or business entities into a company or limited liability company. This ownership gives rights to shareholders, such as obtaining a portion of the company’s profits, rights to the company’s assets, and the right to participate in the General Meeting of Shareholders (GMS(Riyanto, 2018). This is by “Article 52 paragraph 1 of Law No. 40 of 2007 concerning Limited Liability Companies or UUPT”.
Trading is an activity that involves buying and selling goods or services (assets). In financial markets, trading refers to actively conducting transactions, where stocks are traded in a relatively short period to take advantage of price fluctuations. Thus, trading is highly dependent on stock price volatility where stock prices experience very rapid increases and decreases within a certain time (Pangesti, 2024). The relationship between volatility and stock trading opportunities is significant. Higher volatility indicates a larger range of price fluctuations over time, creating an environment where stock prices can change rapidly due to various factors such as new information, shifts in market sentiment, or external events. These swift price movements enable traders to take advantage of short-term profit opportunities by buying and selling strategically. Active traders, including day traders and swing traders, tend to thrive in highly volatile markets because they can find numerous trading opportunities stemming from frequent and considerable price changes. Additionally, increased volatility attracts speculators and liquidity providers, which further boosts market activity. However, the potential for increased profits comes with inherent risks. Quick and unpredictable price shifts may result in significant losses for those investors who cannot effectively manage their trades or who do not have a well-defined strategy. Therefore, navigating volatile markets successfully necessitates a thorough understanding of market dynamics, disciplined risk management practices, and the capability to respond swiftly to evolving market conditions.
Market volatility is closely connected to market efficiency. In an efficient market, all relevant information affecting a product’s value is already factored into its current price. Markets with high liquidity tend to offer more precise price assessments and enhance investor confidence (Ganai, 2021). In light of these features, it can be inferred that ABMM stock is traded within an effective capital market framework. The information transparency and the active involvement of various market participants suggest that ABMM’s stock price accurately reflects its intrinsic value. This efficiency level is crucial for investors, as it empowers them to make informed decisions based on the available information, reducing the risk of substantial price discrepancies or information imbalances.
In line with the government’s efforts to enhance the investment climate in Indonesia, it’s crucial for investors to be vigilant in identifying market opportunities. Novice investors, in particular, should focus on understanding the analyses essential for evaluating stocks suitable for their portfolios. The two main analyses—fundamental and technical—are interconnected, as they both play critical roles in assessing stock suitability for purchase. Fundamental analysis is primarily aimed at evaluating stocks for long-term investments, analyzing elements such as company performance, financial health, and industry conditions. In contrast, technical analysis caters to more short-term trading strategies, emphasizing price movements and market trends to inform buying and selling decisions. Understanding the distinction and application of these analyses will empower investors to make informed decisions in their investment journeys (Agustina, 2021).
Employees and investors with surplus funds are beginning to show interest in using their capital to purchase shares. They are increasingly attracted to investing in companies that are fundamentally sound and have the potential for price appreciation. This is because investing in shares offers the prospect of higher returns, both from dividends and capital gains (Warae et al., 2021). Investors in the capital market typically anticipate profits in two primary ways. Firstly, they look for dividends, which represent the distribution of a company’s profits to its shareholders. Secondly, they also seek capital gains, which are profits realized when the price of their shares increases over time.
Private investment, both foreign and domestic, can make a significant contribution to Indonesia’s recovery from the COVID-19 pandemic. Foreign Direct Investment (FDI) has declined significantly during the crisis and will be needed to achieve Indonesia’s sustainable development goals (OECD, 2021). Foreign companies in Indonesia are more productive, have higher employment ratios, and pay higher wages than Indonesian companies. They also export more of their output and generate important multiplier effects for Indonesia’s domestic economy. Data from PT Custodian Sentral Efek Indonesia (KSEI) in January 2021 showed a significant increase in capital market investors. The number of investors increased from 1,619,372 at the end of 2018 to 2,484,354 at the end of 2019, or an increase of 53.41%. A more significant increase occurred at the end of 2019 to 2020, reaching 3,880,753 investors, even amid the pandemic. This trend shows that the capital market is increasingly in demand by the public as an investment option, especially amidst the negative impacts experienced by the business world due to Large-Scale Social Restrictions during the pandemic (Kementerian Keuangan, 2021).
Every public company (a company that has been listed on the capital market) has a stock code and ABMM is the stock code owned by PT ABM Investama Tbk. This company is part of the PT Tiara Marga Trakindo group which focuses on the business sector in the integrated energy and mining solutions sector. This company was founded on June 1, 2006 with the initial name of PT Adiratna Banu Makmur. In 2009, after being acquired by TMT, the company’s name changed to ABM Investama. This company has six direct subsidiaries and 18 indirect subsidiaries. This company is listed on the main board of the Indonesia Stock Exchange and is headquartered at TMT Building 1, 18th Floor, Suite 1802, Cilandak KKO 1, Jakarta.
PT ABM Investama Tbk (ABMM) took a significant step to become a public company by conducting an initial public offering (IPO) on the Indonesia Stock Exchange (IDX). In this IPO, the company listed 2,753,165,000 shares with the stock code “ABMM”. ABM Investama operates in three main business segments: mining contractors and coal mining, services, and manufacturing. In addition, the company has a fuel and lubricant trading business, which falls under the other business category. This diversified approach helps the company leverage its strategic investments in the integrated mining and energy solutions sector (Rahadian & Sumirat, 2022).
Thus, the object used in this study is ABMM stock from PT ABM Investama Tbk which focuses on examining whether ABMM stock is more suitable as an investment or trading option? So the purpose of this study is to find out whether ABMM stock is more suitable as an investment or trading option at this time.
LITERATURE REVIEW
Trading
In the stock market, individuals can choose to be either a trader or an investor, or they can blend both approaches. A trader strategically capitalizes on price movements by purchasing stocks when prices are low and selling them when prices rise, aiming for profit through capital gains. Given the high risks associated with trading, traders often set limits to mitigate potential losses, such as selling a few percent below their purchase price if they anticipate further declines, thereby minimizing capital loss. Ultimately, traders focus on short-term price trends and fluctuations.
A trader makes more use of technical analysis, namely stock price movements. Buying and selling transactions are carried out briefly (Stockbit, 2022). The short time varies greatly from minutes, hours, days, and a maximum of a week. Technical analysis is closely related to market action, the forces of demand and supply that cause prices to rise, fall, and even remain the same (Murphy, 1999).
Investing
An investor must be able to take advantage of long-term price trends. If there is a tendency for the stock price to rise, then the investor can choose the stock to be used as an investment stock. Two benefits can be obtained by someone if they decide to become an investor, namely capital gain and dividends (MNC Sekuritas, 2024); PT BRI Danareksa Sekuritas, 2022; Bursa Efek Indonesia, 2024). Capital gain is the difference between the selling price of the stock and the purchase price of the stock. An investor who holds the stock in the long term and uses stock price trend analysis will be able to get capital gain. Dividends are a corporate action in the form of distributing the profits obtained by the company to shareholders and the dividends are distributed at least once a year. Thus, an investor who can choose the best stocks to buy will be able to provide these two benefits to investorstions to generate profits.
Investors in choosing the stocks they buy utilize fundamental and technical analysis. Fundamental analysis utilizes financial reports and financial ratios of the company. The technical analysis used is in the form of long-term price trends. The principle of fundamental analysis is that investors buy stocks with good fundamentals at a reasonable price level and even better if the price is below the reasonable price. If the market price is far above the reasonable price, then investors can sell the shares (Otoritas Jasa Keuangan, 2016).
Fundamental analysis seeks to estimate a share’s future value by examining various economic factors, known as fundamentals. This approach involves analyzing the overall economy, the specific industry of the company, and the company itself. The key idea behind this analysis is that, although stock prices may not reflect their true value in the short term, they tend to align with their intrinsic value over the long run. Investors can profit by purchasing shares at prices lower than their true value or by selling shares when their market price exceeds their actual worth (Petrusheva & Jordanoski, 2016).
Trading and Investing Illustration
Figure 1 illustrates the distinctions between trading and investing. A trader capitalizes on price fluctuations to achieve capital gains by buying low and selling high. For instance, the trader purchases at a price of 100 and later sells at 200. Subsequently, the trader buys back when the price drops to 150 and sells it again at 300. After waiting for another price drop, the trader buys at 100 once more and sells at an impressive 400. In contrast, an investor takes a longer-term approach. After buying at 100, the investor typically holds onto the stock as the price rises, only to buy more during price dips, such as at 150 or 100, to increase their ownership. Over time, the investor accumulates more shares, ultimately selling at a much higher price, as indicated in Figure 1, where the selling price reaches 400. The capital gain for investors can be substantial, particularly when combined with the dividends received annually.

Figure 1. Trading and Investment Illustration
Source: Filbert (2016)
METHODOLOGY
This research is a qualitative research, which includes fundamental analysis with a period of 2021-2023 and technical analysis with a period of 2021-2024 on ABMM stock price fluctuations. This study utilizes secondary data sourced from the financial statements of PT ABM Investama Tbk. This study is descriptive, applying a fundamental analysis approach to decide on investment choices and technical analysis to choose trading. Fundamental analysis includes studying a company’s financial statements and its prospects to determine its intrinsic value (Murphy, 1999). In the context of the stock market, fundamental analysis provides stock recommendations for investment decisions (Filbert, 2016). Meanwhile, technical analysis focuses on measuring stock performance and predicting future price movements using historical data. This approach involves various tools, such as line charts, bar charts, and candlestick charts. Technical analysis is generally used by short-term investors or traders to make decisions in a shorter investment period (Otoritas Jasa keuangan, 2016). The research design is as shown in Figure 2.
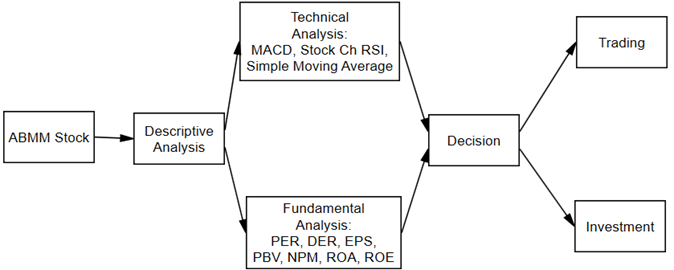
Figure 2: Research Design
Source: Developved by Author (2024)
RESULTS AND DISCUSSION
Stocks represent proof of ownership in a company, allowing shareholders to claim a portion of the company’s assets and profits proportional to the number of shares they own. This ownership entitles investors to dividends, which are a share of the company’s earnings distributed to shareholders, and gives them a voice in certain corporate decisions, such as voting on company policies or electing the board of directors. Ultimately, owning stocks can provide financial growth through capital appreciation and income generation.
Fundamental Analysis
Profitability Ratio
Profitability ratios are essential indicators of how effectively a company produces profits from its operations. They play a significant role in evaluating management performance and the company’s overall financial health. Among the commonly used ratios, Return on Assets (ROA) reflects how well a company uses its assets to generate profit, while Return on Equity (ROE) indicates the profit level received by shareholders. These ratios are crucial for stakeholders as they provide valuable insights into the company’s operational efficiency and its ability to generate profits (Safitri et al., 2023).
Table 1 shows the ROA, ROE and NPM that PT ABM Investama Tbk was able to achieve during 2021-2023..
Table 1. ROA, ROE, and NPM
(2021-2023)
| Year | ROA (%) | ROE (%) | NPM (%) |
| 2021 | 17,96 | 52.17 | 14,48 |
| 2022 | 17.25 | 55.37 | 18,67 |
| 2023 | 14,63 | 41,58 | 19,36 |
Source: PT ABM Investama Tbk (2024)
a. Return on Asset (ROA
Return on Asset (ROA) is a financial ratio that measures a company’s efficiency in generating profits relative to its total assets. This ratio provides a clear picture of how effectively a company is utilizing its assets to generate revenue. A higher ROA indicates that a company is more efficient in converting its investment in assets into profits, which is an important consideration for investors and stakeholders analyzing a company’s operational efficiency.
Based on Table 1, in 2021, ROA was 17.96%, indicating that the company generated a net profit of 17.96% of its total assets that year. In 2023, ROA fell to 14.63%, slightly down from the previous two years which were stable at 17%. However, this figure is still considered good in terms of the company’s asset management that year.
b. Return on Equity (ROE)
Return on Equity (ROE) is a key financial metric used to assess how effectively a company is generating profits from its shareholders’ investments. It reflects the ability of a company to use the capital provided by shareholders to produce profits. A higher ROE indicates that the company is efficiently converting equity financing into net income, which is often viewed positively by investors. Conversely, a lower ROE may suggest that the company is not utilizing its equity as effectively, raising concerns about its profitability and financial management. Overall, ROE is an important indicator for investors to evaluate a company’s performance and potential for growth.
Based on Table 1, in 2021 ROE was recorded at 52.17%, indicating that the company managed to generate a profit of 52.17% of its equity. However, in 2023, ROE decreased to 41.58%. Although there was a decline from a stable level in 2021 to 2022, which was in the range of 52%–55%, this value still reflects excellent performance in managing the company’s capital.
c. Net Profit Margin
Net profit margin is a financial ratio that evaluates how effectively a company converts its total revenue into net profit. This metric underscores a company’s ability to manage costs while maximizing profits derived from its revenue. According to Table 1, in 2021, the company’s net profit margin (NPM) was 14.48%, meaning the company generated a profit equal to 14.48% of its total sales revenue that year. The following year, 2022, saw an increase to 18.67%, and by 2023, the NPM reached 19.36%. This upward trend indicates that the company has performed well in recent years and has successfully increased its sales.
Financial performance
- Net Profit: ABMM has recorded positive profits for three consecutive years, with net profits continuing to increase each year. In 2023, net profit shows significant growth.
- Net Profit Margin (NPM): The company’s NPM reached 19.36% in 2023, indicating a good level of profitability. This figure has increased compared to previous years which experienced a decline. This increase shows that the company has been effective in increasing its profitability and controlling costs more efficiently.
- Return on Equity (ROE): The company’s ROE is very good, reaching 41.58% in 2023, and 55.37% in 2022, indicating the company’s efficiency in generating profits from its equity.
Liquidity
Liquidity ratios assess a company’s ability to meet its short-term obligations and evaluate how quickly it can convert its assets into cash to cover those obligations. These ratios offer insights into a company’s financial health and its efficiency in managing current assets and liabilities. A strong liquidity position indicates that the company can readily pay off its short-term debts, which is crucial for sustaining operations and avoiding financial distress (Wardhani, 2024).
Table 2. Current Ratio and Quick Ratio (2021 – 2023)
| Year | Current Ratio (times) | Quick Ratio (times) |
| 2021 | 1,65 | 1,52 |
| 2022 | 1,15 | 1,06 |
| 2023 | 0,99 | 0,90 |
Source: PT ABM Investama Tbk (2024)
a. Current Ratio
The current ratio is a financial measure that evaluates a company’s ability to meet its short-term obligations using its current assets. This ratio provides insight into the company’s liquidity and its effectiveness in meeting its short-term financial obligations quickly.
Based on Table 2, the company’s current ratio in 2021 was 1.65 times. This shows that the company manages its assets effectively so that it can cover its short-term obligations by 1.65 times, which reflects a strong level of liquidity. Conversely, in 2023, the current ratio fell to 0.99 times. This decline indicates that the company is no longer able to adequately cover all its obligations with its current assets, indicating a less favorable financial condition.
b. Quick Ratio
The quick ratio is an important indicator of a company’s ability to meet its short-term obligations using its liquid assets, excluding inventory. This ratio provides a more cautious view of liquidity than the current ratio. The quick ratio, also known as the acid-test ratio, is a measure of a company’s short-term liquidity. This ratio helps assess how well a company can meet its short-term obligations without relying on the sale of its inventory. A higher quick ratio indicates better liquidity. According to Table 2, the quick ratio in 2021 was recorded at 1.52 times, indicating that the company is in a solid position with sufficient liquid assets to cover its current obligations. However, from 2022 to 2023, the quick ratio has declined significantly, dropping to 1.06 times in 2022 and further to 0.90 times in 2023. This downward trend highlights concerns about the company’s liquidity, indicating that the company may have difficulty meeting its short-term debt obligations.
Solvency
The solvency ratio is a crucial indicator that measures a company’s long-term financial stability and risk. Often called the “leverage ratio,” it highlights the proportion of debt in a company’s financial structure. By assessing this ratio, investors can gain insights into the company’s ability to meet its long-term obligations using its assets. A higher solvency ratio suggests that a company is more capable of covering its debts, while a lower ratio may indicate potential financial difficulties. This makes the solvency ratio an important tool for evaluating the financial health and sustainability of a business (Wardhani, 2024).
Table 3. Net Interest-Bearing Debt to Equity, Net Interest-Bearing Debt to EBITDA
(2021 – 2023)
| Year | Net Interest-Bearing Debt to Equity (times) | Net Interest Bearing Debt to EBITDA (times) |
| 2021 | 0,41 | 0,37 |
| 2022 | 1,00 | 1,09 |
| 2023 | 1,11 | 1,68 |
Source: PT ABM Investama Tbk (2024)
a. Net Interest Bearing Debt to Equity
In Table 3, the Net Interest-Bearing Debt to Equity value was 0.41 in 2021, indicating that interest-bearing debt was relatively low compared to the company’s equity. However, this changed in 2022 when the ratio rose to 1.00, suggesting the company started to leverage debt more aggressively to support its operations. By 2023, the ratio further increased to 1.11, reflecting an even greater reliance on interest-bearing debt within the company’s capital structure.
b. Net Interest Bearing Debt to EBITDA
Table 4. Debt to Equity Ratio and Debt to Asset Ratio (2021 – 2023)
| Year | Liabilities to Equity (times) | Liabilities to Assets (times) |
| 2021 | 1,08 | 0,37 |
| 2022 | 1,52 | 0,47 |
| 2023 | 1,37 | 0,48 |
Source: PT ABM Investama Tbk (2024)
In Table 3, the Net Interest-Bearing Debt to EBITDA value for 2021 was recorded at 0.37, indicating that the company has a strong capacity to meet its debt obligations from earnings before interest, tax, depreciation, and amortization. However, from 2022 to 2023, this figure increased significantly to 1.68, which could indicate potential challenges for the company in meeting its debt commitments, especially if there is no substantial revenue growth.
c. Liabilities to Equity
In Table 3, the Liabilities to Equity ratio in 2021 is recorded at 1.08, which suggests that the company’s liabilities are nearly equal to its equity. By 2023, this ratio has increased to 1.37, indicating that the company’s liabilities have grown relative to its equity. This trend suggests that while the company’s financial obligations are still greater than its equity, there has been a noticeable increase in leverage over the period. It may be worthwhile for stakeholders to analyze the implications of this rising ratio on the company’s financial health and stability.
d. Liabilities to Assets
In Table 3, in 2021, the Liabilities to Assets value was recorded at 0.37, indicating that only a small portion of the company’s assets were financed by debt. However, in 2022 to 2023, this ratio increased to 0.48. This increase indicates that almost half of the company’s total assets are now financed by debt, which can increase the company’s financial risk.
ABMM Stock Valuation
PT ABM Investama Tbk has listed and traded its shares on the Indonesia Stock Exchange since December 6, 2011.
Table 5. Book Value per Share and Price to Book Value (2021 – 2023)
| Year | Book Value per Share (BVS) (IDR) | Price to Book Value (%) |
| 2021 | 1.850 | 77 |
| 2022 | 3.528 | 93 |
| 2023 | 4.250 | 80 |
Source: PT ABM Investama Tbk (2024)
a. Book Value per Share:
In Table 4, there is an increase in the book value per share from IDR 1,850 in 2021 to IDR 4,250 in 2023. This increase indicates a significant growth in the company’s equity value, which reflects an increase in the company’s assets compared to its liabilities.
b. Price to Book Value (%):
The percentage of stock price to book value fluctuates, with the highest value in 2022 (93%) and the lowest in 2021 (77%). In 2023, this percentage drops to 80%, indicating that even though book value is increasing, the market may be valuing the stock lower than its book value.
Table 6. Price to Earning Ratio (PER) and Number of Shares Outstanding (2021-2023)
| Year | Book Value per Share (IDR) | Stock Price per Book Value (%) |
| 2021 | 1.850 | 77 |
| 2022 | 3.528 | 93 |
| 2023 | 4.250 | 80 |
Source: PT ABM Investama Tbk (2024)
c. Stock Price per Earnings (%):
The stock price-to-earnings ratio shows a relatively stable trend with a slight decrease from year to year, namely from 1.85 in 2021 to 2.10 in 2023, after peaking at 2.13 in 2022. This indicates that even though the stock price has increased, the company’s revenue has not grown as fast as the stock price, which could indicate that investors are more focused on stock price expectations than actual revenue growth.
d. Number of Shares Outstanding:
The number of shares outstanding remained constant at 2,753,165,000 shares throughout the period, indicating no change in the company’s capital structure over the three years.
Technical Analysis
On Wednesday, November 27, 2024, PT ABM Investama Tbk’s stock price fluctuated between Rp3,550 and Rp3,650. Over the past 52 weeks, the stock reached a high of Rp5,750 and a low of Rp3,210, with the last closing price recorded at Rp3,620. The company boasts a market capitalization of Rp9.77 trillion, and it has seen an average daily trading volume of approximately 3.35 million shares over the past month. This information, combined with previous metrics about the stock price relative to earnings and dividends, can provide a clearer picture for investors considering the stock’s performance and value within the market.
The ratio of the stock price to Earnings Per Share (EPS) for the last twelve months is 3.50%, suggesting that the stock price is relatively low compared to other stocks in the market. Additionally, the ratio of the annual dividend to the current stock price is 8.31%, providing an estimate of the dividend yield that shareholders can expect to receive. This combination of ratios can help investors assess the value and profitability of the stock about its peers.
1. General Trends
A market trend is the direction that stock prices typically move during a given period. The trend is separated into three directions: uptrend (bullish), downtrend (bearish), and sideways. This movement will include multiple decisions, including whether to buy, sell, or hold (Kantaria & Tanna, 2022).
Currently, ABMM shares are experiencing a downtrend phase, as indicated by the consistent decline in price and the inability to remain above a critical support level of IDR 4,220. This breach of a significant support level reflects weakening buying interest and suggests a bearish sentiment in the short term. Such price behavior is often associated with broader market conditions, sector-specific challenges, or company-related developments that may influence investor confidence.

Figure 3. ABM Investama Tbk Stock Chart (2021 – 2024)
Source: Trading Views (2024)
However, when observing the longer-term price trend from 2021 to 2024, there is a clear upward trajectory, demonstrating a general tendency for price increases over this period. This historical trend indicates that despite the current downtrend, ABMM shares have exhibited resilience and potential for recovery in the past. Such a pattern may provide opportunities for long-term investors, especially those who can identify favorable entry points during periods of temporary price weakness.
For investors, this phase presents an opportunity to evaluate the stock’s fundamentals and broader market conditions. If the underlying factors that drove the upward trend from 2021 to 2024 remain intact—such as strong financial performance, positive industry outlook, or strategic corporate initiatives—then the current decline may represent a potential entry point for long-term investment.
Both investors and traders need to monitor key technical indicators and support-resistance levels closely. For investors, focusing on the company’s intrinsic value and growth potential can guide decisions, while traders can leverage short-term price volatility to capitalize on rebounds or momentum shifts. Ultimately, understanding both the short-term downtrend and the long-term upward trend of ABMM stock can help in formulating an informed investment strategy.
2. Support and Resistance Levels
In most studies, Support and Resistance (SAR) levels are identified as the minima or maxima that occur within a predefined, constant time interval (Zapranis & Tsinaslanidis, 2012). These levels serve as crucial indicators in technical analysis, as they represent price points where the stock has historically had a hard time moving beyond (resistance) or has found significant buying interest (support). By identifying these levels, traders can make informed decisions about potential entry and exit points, as well as set stop-loss orders to manage risk effectively. Understanding SAR helps traders anticipate market behavior and implement strategies accordingly.
Based on Figure 3, strong support level is located around Rp 3,870. If the stock price reaches this level, there is a possibility of a technical rebound. The nearest resistance level is at Rp 4,220, which previously functioned as support but is now the upper limit of price movement. When the price of a stock reaches a support level, it typically signals an opportune moment for investors and traders to consider buying ABMM shares. Support is a price level where a stock tends to find buying interest strong enough to prevent further declines, often due to market psychology or historical trading activity. At this point, the price is perceived as undervalued, attracting investors who view it as a favorable entry point. Conversely, when the price reaches a resistance level, it suggests a potential selling opportunity for traders. Resistance is a price point where selling pressure outweighs buying interest, often halting upward price momentum. For traders, this level represents a chance to secure profits before a possible price reversal.
In the case of ongoing price fluctuations, a decline in stock prices can present a strategic opportunity for investors and traders alike. Long-term investors may choose to increase their holdings during dips, taking advantage of the lower prices to accumulate shares with the expectation of long-term growth. For traders, such declines can serve as a buying opportunity, aiming to capitalize on short-term price recoveries by selling the shares at higher prices to secure a profit.
Understanding the dynamics of support and resistance, coupled with careful monitoring of market trends and volumes, is essential for making informed decisions. However, investors and traders should also consider other technical and fundamental indicators to validate these levels and to better align their strategies with broader market conditions and their risk tolerance.
3. Technical Indicators
a. MACD Indicator Method
Shows a sell signal for medium-term swing trade positions, indicating that bearish momentum is still dominant.

Figure 4. ABMM Stock Chart with MACD indicator
Source: (Trading Views, 2024)
Note:
Blue line : MACD line
Orange line : trigger/signal line
Green candlestick : buy volume
Red candlestick : sell volume
According to Figure 4, the MACD line remained stable throughout 2021, with the signal line hovering around 15 until the year’s end. However, in March 2022, a noticeable shift occurred as the MACD line crossed above the signal line, peaking at 300. A downtrend followed between May and June 2022, where the MACD line fell below the 15 mark. This was succeeded by a dramatic surge, leading to an all-time high of over 500 by the end of 2022, marking the most significant level seen in the past three years. After reaching that peak, the trend turned volatile, displaying fluctuations that continued until October 2024.
b. Stochastic RSI (StochRSI) Method
The Stochastic indicator is currently showing a neutral condition, meaning there are no strong buy or sell signals. This indicator is a combination of two popular indicators, namely the Relative Strength Index (RSI) and the Stochastic Oscillator. Some of the main benefits of this indicator are:
- Identify Oversold and Overbought conditions, When the indicator shows a value below 20, it indicates that the market is Oversold, which can be a signal to buy. Conversely, when the indicator value is above 80, the market is considered Overbought, which can be a signal to sell.
- Confirmation of market trend, If Stoch RSI is above the 50 line, it indicates that the market trend is up. Conversely, if StochRSI is below the 50 line, the market trend is expected to be down.
- Divergence occurs when price movement and indicators do not move in the same direction, signaling a potential reversal in market trends. This phenomenon can provide crucial insights into market conditions, aiding traders in making informed decisions.
For instance, as highlighted in Figure 5, the Stoch RSI line has shown monthly fluctuations since 2021, indicating periods of oversold and overbought conditions across the three indicators for investors. This information is essential for identifying possible entry and exit points in trading strategies.
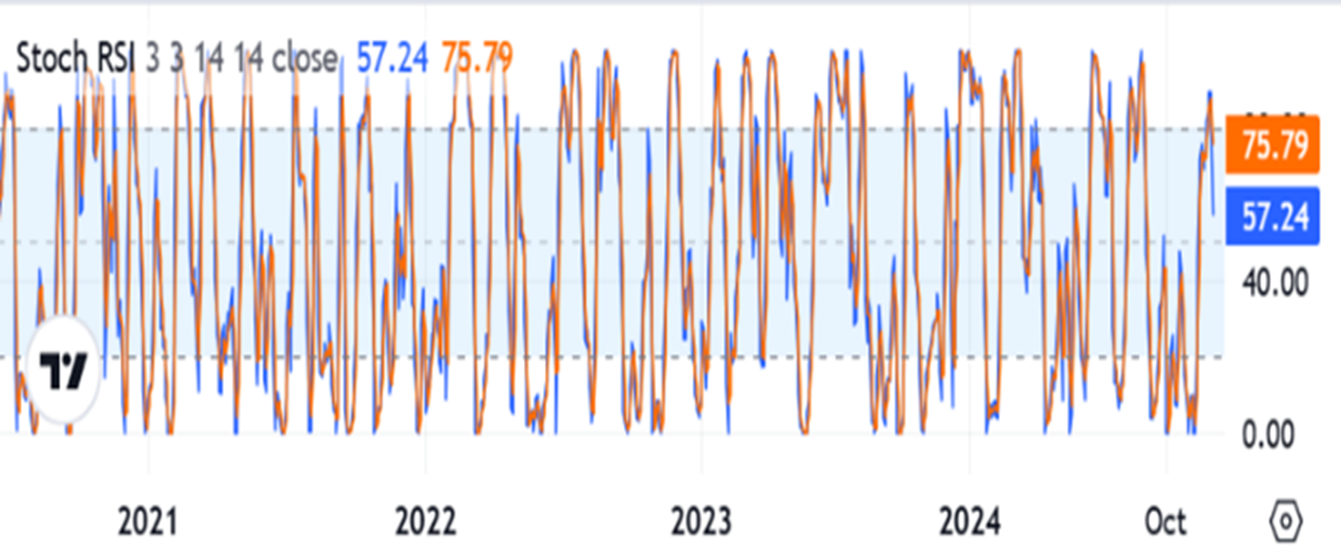
Figure 5. ABMM Stock Chart with Stochastic RSI indicator
Source: (Trading Views, 2024)
Note:
Overbought limit 80.00.
Oversold limit 20.00
Moving Averages
The Moving Average (MA) method is a popular tool in technical analysis. It is one of the most essential and frequently utilized techniques, playing a key role in analyzing market trends. Technical analysts believe that historical prices and volume provide important and useful information for projecting upcoming price changes in the stock market (Kantaria & Tanna, 2022). This shows that the current price is below the short-term and long-term averages, which confirms the presence of a bearish trend. The Moving Average (MA) indicator is designed to help identify market trends. An uptrend is indicated when the stock price rises above the Moving Average line, signaling a bullish environment. On the other hand, a downtrend is observed when the price falls below the Moving Average line, suggesting a bearish outlook. Essentially, the MA serves as a useful tool for discerning whether the market is in a bullish or bearish phase based on price movement in relation to the indicator (Hasan et al., 2024).

Figure 6. ABMM Stock Chart with SMA indicator
Source: (Trading Views, 2024)
Note:
Green line = Bullish
Red line = Bearish
Blue line = Simple Moving Average
5. Trading Volume
Stock trading volume refers to the total amount of shares traded on any particular day. Trading volume refers to the difference between outstanding share transactions for specific types of shares on the stock market during a given period. Investors use this statistic to track a company’s stock activity and price swings (Rahayaan & Durya, 2022). Trading volume shows quite high fluctuations, especially when the price approaches the support level. This could be an indication that many traders are monitoring the price movement in that area.
6. Market Sentiment Analysis
Market sentiment towards ABMM shares currently tends to be negative due to the continued price decline and uncertainty regarding the company’s financial performance.
CONCLUSION
Based on the analysis conducted on ABM Investama Tbk (ABMM) shares, it’s clear that this stock can be suitable for both long-term investment and short-term trading. The choice between the two approaches ultimately hinges on your individual risk profile and investment objectives. If you’re leaning towards long-term stability and growth, then investing in ABMM might be the better option. Conversely, if you prefer to capitalize on short-term price fluctuations, a trading strategy could be more appropriate.
a. For Long Term Investment:
ABMM shares have good long-term growth potential with positive financial performance and attractive dividends. However, the risks associated with high debt and overvalued stock prices must be considered. ABMM could be an option for long-term investors looking for dividends and growth potential.
b. For Short Term Trading:
With the current bearish trend and the existence of support levels that can be utilized for trading, ABMM is more suitable for short-term trading strategies. The opportunity for a rebound in the support area of Rp3,870 provides an opportunity for traders to take a buy position with a profit target in a short time.
For an investor, when the stock price falls, investors can increase the number of shares they own by buying and when the price rises above its fair price, investors can sell it to take profit to get capital gain. Meanwhile, for a trader, after buying shares, the choice is only one of two alternatives, namely taking profit when the stock price rises or cutting loss when the stock price falls.
REFERENCE
- Agustina, R. (2021). Analisis Fundamental, Acuan Investasi Saham Jangka Panjang. DINAMIS: Jurnal Pengabdian Kepada Masyarakat, 1(1), 14–25. https://doi.org/10.33752/dinamis.v1i1.360
- Bursa Efek Indonesia. (2024). Saham. https://www.idx.co.id/id/produk/saham
- Filbert, R. (2016). Trading Vs Investing: Strategi Meraih keuntungan Melalui Trading dan Investasi Secara Bersamaan. PT Gramedia.
- Ganai, K. A. (2021). Spillover Effects of Stock Options Trading on the Volatility of Underlying Stocks. Archives of Business Research, 9(5), 47–58. https://doi.org/10.14738/abr.95.10197
- Hasan, S., Nurhasanah, S., & Santoso, W. P. (2024). Analisis Teknikal Menggunakan Moving Average (MA), Moving Average Convergence-Divergence (MACD), dan Relative Strength Index (RSI) Untuk Mengoptimalkan Dalam Pengambilan Keputusan Investasi Pada Saham Sektor Manufaktur Index LQ45 BEI Tahun 2022-2023. El-Mal: Jurnal Kajian Ekonomi & Bisnis Islam, 5(4), 3318–3334. https://doi.org/10.47467/elmal.v5i4.2029
- Kantaria, K., & Tanna, H. (2022). An Empirical Study on Investment and Trading Decision Based on Moving Average Crossover Strategy Applied on Selected Indian Stocks: Pre and during COVID-19. International Management Review, 18, 2022.
- Kementerian Keuangan. (2021). Aktivitas Pasar Modal Indonesia Di Era Pandemi. Kementerian Keuangan.
- MNC Sekuritas. (2024). 3 Keuntungan Investasi Saham. https://www.mncsekuritas.id/pages/3-keuntungan-investasi-saham/
- Murphy, J. J. (1999). Technical Analysis of The Financial Markets: A Comprehensive Guide to Trading Methods and Aplications (First edit). Penguin Group. https://drive.google.com/file/d/1OcDrGakDhaejT7J7xGEE3HHKy7xmrafy/preview
- (2021). Kajian Kebijakan Investasi OECD Indonesia 2020.
- Otoritas Jasa keuangan. (2016). Pasar Modal: Seri Literasi Keuangan Perguruan Tinggi. In Sustainability (Switzerland). Otoritas Jasa keuangan dan Industri Jasa keuangan. https://sikapiuangmu.ojk.go.id/FrontEnd/images/FileDownload/203_3 Pasar Modal-compressed.pdf
- Pangesti, R. A. A. (2024). Volatilitas Adalah: Pengertian, dan Faktor Pengaruhnya Terhadap Harga Saham. https://www.investasiku.id/eduvest/saham/pengertian-volatilitas-saham
- Petrusheva, N., & Jordanoski, I. (2016). Comparative analysis between the fundamental and technical analysis of stocks. Journal of Process Management. New Technologies, 4(2), 26–31. https://doi.org/10.5937/jpmnt1602026p
- PT ABM Investama Tbk. (2024). ABM Investama Annual Report. https://abm-investama.com/menu/15/annual-report
- PT BRI Danareksa Sekuritas. (2022). Memahami Investasi Saham: Keuntungan, Risiko dan Tipsnya. https://www.brights.id/id/blog/memahami-investasi-saham
- Rahadian, D., & Sumirat, E. (2022). The Financial Performance and Stock Valuation of Coal Mining Company in Indonesia (Case Study: Pt. Abm Investama Tbk (ABMM)). International Journal of Current Science Research and Review, 05(12), 4533–4555. https://doi.org/10.47191/ijcsrr/v5-i12-18
- Rahayaan, A. L., & Durya, N. P. M. A. (2022). Analysis of Trading Volume Activity Before And After The Announcement Of Covid-19 at PT Indosat. International Journal of Economics, Social Science, Entrepreneurship and Technology (IJESET), 1(5), 316–325. https://doi.org/10.55983/ijeset.v1i5.212
- Riyanto, A. (2018). Hak-Hak Pemegang Saham Di Indonesia. Binus. https://business-law.binus.ac.id/2018/02/17/hak-hak-pemegang-saham-di-indonesia/
- Safitri, A., Lestari, U. P., & Nurhayati, I. (2023). Analisis Dampak Penerapan PSAK 73 Atas Sewa Terhadap Kinerja Keuangan Analisis Dampak Penerapan PSAK 73 Atas Sewa Terhadap Kinerja Keuangan Pada Industri Manufaktur , Pertambangan dan Jasa yang Terdaftar di Bursa Efek Indonesia Tahun 2018. December. https://doi.org/10.35313/irwns.v10i1.1447
- Stockbit. (2022). Apa Itu Trader Saham?Pengertian dan Strateginya. https://snips.stockbit.com/investasi/apa-itu-trader-saham
- Trading Views. (2024). ABM Investama Tbk Trading Chart.
- Warae, Y., Suroso, & Muda, I. (2021). Revealing the Value Relevance of Accounting Information and Decision To Purchase Shares (Phenomenology Study on Increasing Share Prices Pt. Antam, Tbk in the Pandemic Covid-19). Archives of Business Research, 9(5), 89–101. https://doi.org/10.14738/abr.95.10142
- Wardhani, H. A. (2024). Analisis Kinerja Keuangan dan Prediksi Kebangkrutan Pada PT ABM Investama Tbk Tahun 2018-2022. 20312010, 1–23.
- Zapranis, A., & Tsinaslanidis, P. E. (2012). Identifying and evaluating horizontal support and resistance levels: An empirical study on US stock markets. Applied Financial Economics, 22(19), 1571–1585. https://doi.org/10.1080/09603107.2012.663469