
The Role of Ease of Doing Business in Attracting Foreign Direct Investment in the SADC Region
- Lawrence Dumisani Nyathi
- Mbheki Mlobane
- 2587-2602
- Jun 26, 2024
- Economics
The Role of Ease of Doing Business in Attracting Foreign Direct Investment in the SADC Region
Lawrence Dumisani Nyathi, Mbheki Mlobane
National University of Science and Technology,
PO Box AC 939, Ascot, Bulawayo, Zimbabwe.
DOI: https://dx.doi.org/10.47772/IJRISS.2024.805188
Received: 15 May 2024; Accepted: 25 May 2024; Published: 26 June 2024
ABSTRACT
This study seeks to analyze the role of ease of doing business in attracting foreign direct investment in the SADC region. The main goal of the study is to present new findings to corroborate whether ease of doing business factors are a significant and positive stimulus for Foreign Direct Investment (FDI). The study also proves to the role of ease of doing business to boost foreign direct investment in the SADC Region to enhance economic growth amid indications that foreign direct investment (FDI) streams in the SADC Region are diminishing rather than other economic communities all through the world, regardless of SADC’s endeavours to encourage an empowering environment for FDI. The research also verifies some hindrances such as negative gamble discernments, a troublesome business environment, and pervasive corruption as key elements given for SADC’s inability to attract and keep up with FDI. The study used panel data and therefore applied a Pooled Ordinary Least Squares (OLS) regression or a fixed effects model. The results revealed that gross fixed capital formation, political stability, corruption and gross domestic product were statistically significant towards FDI inflows into the SADC region. The study recommended that the SADC region should develop responsible foreign capital regulation which offers incentives for localized investment and lower unemployment rate by producing jobs and real income that can be used to either fuel economic growth or be saved in financial institutions.
Keywords: ease of doing business, foreign direct investment, SADC region, investment, capital
JEL Classification: O01; P00
INTRODUCTION
From 2003 to 2020, the World Bank’s annual publications in the Doing Business Report have been used to provide objective measures of business regulations and their enforcement across 190 economies and selected cities at the subnational and regional levels (The Ease of Doing Business in the East African Community, 2023). This comparison has driven various economies and regions to embark on various economic reforms to create a conducive business environment and hence ease of doing business. According to (World Bank Annual Report, 2019)many economies are actively reforming their economic regulations and thus were concluded to seen as high attractive for investment.
While on the same note, the (World Bank Annual Report,2019) Business Report articulate that to correctly measure ease of doing business the focus is put on domestic small and medium-sized companies. Quantitative indicators on regulations for starting a business, dealing with construction permits, getting electricity, registering property, getting credit, protecting minority investors, paying taxes, trading across borders, enforcing contracts, and resolving insolvency have been used to gauge ease of doing business especially by the World Bank worldwide.
SADC region has an oscillating regional economic integration since 2000. The World Bank’s 2019 Doing Business findings indicated that the average regional score was 57.25 % as compared to other regional economic communities such as East African Community (EAC) which had 56.94% while for Middle East and North Africa (MENA) scored higher average of 58.30%. The drive to excellent business performance has been necessitated by business reforms that regional economic communities have been undertaking to create a conducive business environment for investment, competitiveness, and wealth creation. Some of the business reforms have been inspired by the World Bank Doing Business Report, while others were carried out to comply with regional and international commitments. More significantly, certain reforms were undertaken in response to private sector advocacy or the initiatives of respective governments.
Figure 1: Ease of Doing Business Score for SADC Region.
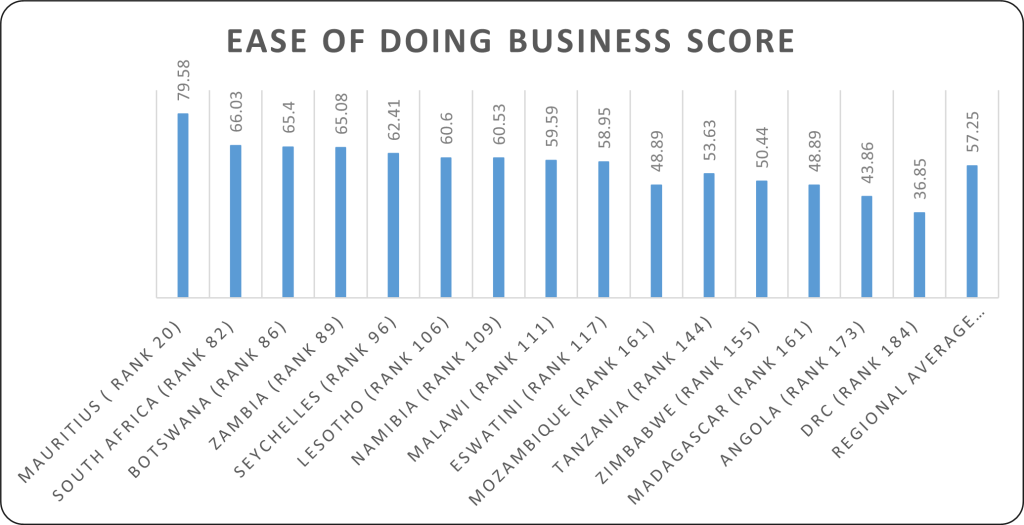
Source: Doing Business Database
Mauritius is the most improved country as shown by figure 1 above at 79.58% percentage score followed by South Africa at 66.03% percentage score. Botswana’s doing business has significantly improved at 65.40% given the operation of the diamond mining activities. Meanwhile, Zimbabwe is one of the poor scorers at 50.44% which reflects the difficult business environment. DRC is least ranked nation in the SADC Region at 36.85%. While ease of doing business initiatives seem to be permeating in the economies of Southern African nation’s corruption still remains an impediment to economic growth (Straightforwardness Global Report, 2015). Ease of Doing Business Report (2019) postulates that the perpetuating corruption raises the cost of continuing to work thus halting foreign direct investment.
Compared to other financial hubs across the world, SADC Region has appreciated a drop in Foreign Direct Investment flows. The FDI flow trend revealed that between 2010-2014 and 2015-2019, foreign direct investment inundation to SADC decreased by 36%, while debasement expanded by 57% and EOB increased by 1.2%. (World Bank, 2019).
Figure 2: Foreign direct Investment in SADC Region (2003-2018)
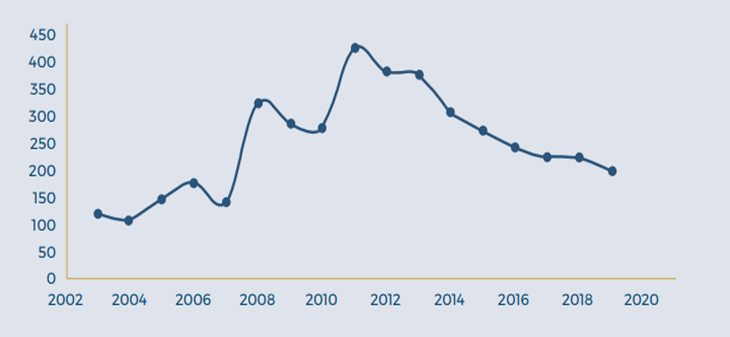
Figure 2 shows the number of FDI projects per year. FDI projects dramatically surged starting in 2008 in the region and peaked in 2011 largely driven by expansion of mining projects and emerging markets and then progressively declining after that (Financial Times, 2020).
Figure 3: FDI by country in the SADC region (2003-2019)
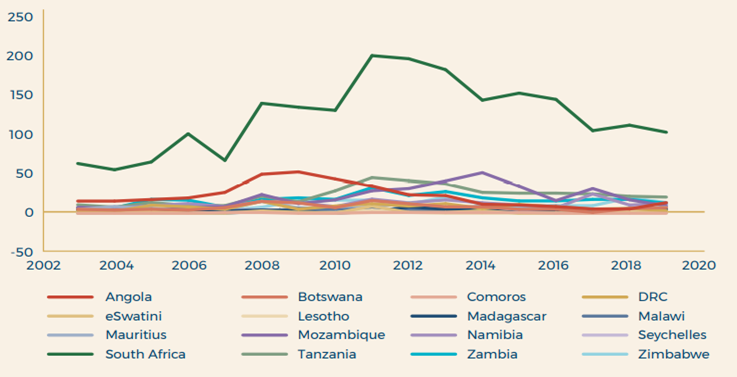
Source: Markowitz (2020)
Figure 3 (which displays FDI projects by country) demonstrate that South Africa has drawn noticeably more foreign direct investment (FDI) than the rest of the area, again because of its advanced, diversified economy. When compared to the rest of the region, only South Africa, Angola, Mozambique, Tanzania, and Zambia have had large increases in foreign direct investment (FDI), while Malawi, Seychelles, eSwatini, Lesotho, and Comoros have seen decreases.
However, foreign direct investment (FDI) streams in the SADC Region are diminishing rather than other economic communities all through the world, regardless of SADC’s endeavours to encourage an empowering environment for FDI. Negative gamble discernments, a troublesome business environment, and pervasive corruption are the key elements given for SADC’s inability to attract and keep up with FDI (UNCTAD, 2020;World Bank,2019) Therefore, the study pursues to evaluate the role of ease of doing business to boost foreign direct investment in the SADC Region from to enhance economic growth from 2010-2020.
RESEARCH OBJECTIVES
Primary objective
The primary objective of this study is to determine the effect of ease of doing business on Foreign Direct Investment (FDI) in SADC region from 2010-2020.
Secondary objectives
- To determine the nature of the relationships between Ease of Doing Business and FDI in the SADC region.
- To assess the effect of corruption on Foreign Direct Investment (FDI) in the SADC region.
- To determine the effect of Political stability on Foreign Direct Investment (FDI) in the SADC region.
- To suggest solutions to increasing FDI inflows to the SADC region.
REVIEW OF LITERATURE
Theoretical framework
Theory of Economic Regulation
Few articles have had the impact of George Stigler’s “The Theory of Monetary Guideline,” published in 1971, in the field of administrative methodology. By modifying market disappointments, Stigler broke through the potential that guidelines evolve solely to drive up public premium. He argued vehemently that, on the whole, “enterprise obtains guidance and plans and works primarily for its advantage.” Stigler evaluated the commercial value of each of these four items. Although sponsorships undoubtedly give businesses immediate cash advantages, Stigler argued that they are typically not the ideal option for business because they typically need to be distributed to all local organizations, including competitors.
Financial experts viewed regulation in the 1960s and the middle of the 1970s primarily as a mechanism put in place to resolve market disappointments rather than as a tool to be used by businesses looking to impede professional competition. Stigler’s analysis was downshifting, energizing financial specialists and administrative researchers to the possibility that guideline could assume the quite opposite part from that intended (Stigler,1971). The Hypothesis of Financial Guidelines, with all of its limitations and flaws, is significant in this focus because it may be necessary to train reformers and leaders to strengthen administrative and guiding principles in order to increase work efficiency and, ultimately, monetary development.
Ownership-Location-Internalization (OLI) or the Eclectic Paradigm to FDI
One of the most persuasive and comprehensive theories of FDI developed in the 1970s is Possession Area Assimilation (OLI), also known as The Diverse Worldview. Dunning developed the theory through a series of distributions (Dunning 1980;1981;1988). The OLI hypothesis outlines the conditions that must be met for businesses to participate in global creation and the approach that will be taken to meet the needs of international business sectors. According to the OLI worldview, a company with ownership benefits but no assimilation or region-specific benefits will be in the best position to limit (permit) its worldwide output (Dunning, 1980).
In this situation, exporting would be preferable to serving the uncharted market. Only businesses that can demonstrate ownership, assimilation, and region-specific benefits should use FDI to serve a foreign market. This approach has provided significant information about the geological dispersions of MNEs, but it has limitations because it cannot explain how foreign firms can outcompete domestic companies in providing their own business sectors. In addition, it fails to provide any information regarding the origins of MNE nations (Cleeve, 2012).
REVIEW OF EMPIRICAL LITERATURE
Relationship between ease of doing business and Foreign Direct Investment (FDI)
(Bayraktar, 2015), emerging economies that have outperformed expectations and have done better than expected have a far higher likelihood of attracting more speculative capital. According to (Gillanders & Parviainen, 2018), Cross-line trade and better business management practices have been seen to promote foreign direct investment (FDI) in rural countries, but not in the world’s poorest countries, especially those in SSA.
(Festus et al., 2016) found out that a significant influencer of FDI inflows is the length of time it takes to launch a firm and the cost of arranging an affiliation. Meanwhile, (Haidar, 2012)research of 172 economies using board data from 2006 to 2010 revealed that every unit rise in entrepreneurial standards results in a 0.15 increase in foreign direct investment inflows.
In his study of 40 sub-Saharan African countries, (Lumumba-Kasongo, 2013)discovered some intriguing links between FDI inflows and on-going employment. Using FDI as the relapse and seven board informational indexes for the nations, moving forward pointers were used as regressors. In determining FDI inflows in the district, factors like the cost of starting a firm and the cost of leasing a building were seen as crucial. The expert discovered that the cost of starting a firm, the time it took to enroll a property, and the time it took to transmit were not significant. While on the same note, (Mahuni & Bonga, 2017) focused on the differences between Work-related boundaries that have an impact on FDI inflows for Zimbabwe have revealed that the country has a difficult work-related climate in areas like contract implementation that chokes FDI inflows.
Furthermore, (Nangpiire et al., 2018)found out that FDI is attracted to Asian economies by how simple it is to register a property, start a firm, receive a development grant, and obtain finance. On the same note, Shahadan (2014) who tracked down that simplicity of carrying on with work markers and rankings were huge in making sense of FDI streams into nations like Iran, India, Bangladesh, Pakistan, Afghanistan, and Sri Lanka.
According to(Matete, 2021), cross line trade and assets enrollment make favourable impacts on FDI while getting a development license and getting credit have negative effects. This is because there is a generally certain relationship between carrying out work and unfamiliar direct speculation. (Vogiatzoglou & Nguyen, 2016) found that favorable business administration circumstances have a significant impact on FDI and are particularly important for FDI that is internally bound.
Lastly,(Vogiatzoglou, 2016) showed the impacts and meaning of simplicity of doing boundaries on drawing in FDI. The review showed that administrative and business proficiency was associated with country’s explicit traits reflecting effectiveness, refinement, and quality. Further, (Jayasuriya, 2011) revealed the same findings and established that improvement of in simplicity of carrying on with work positioning affected FDI in emerging economies from 2006-2009.
Corruption and Foreign Direct Investment (FDI)
According to limited precise studies ((Busse & Hefeker, 2007);(Asiedu, 2006);(Mathur & Singh, 2013), saw corruption and FDI inflows are negatively interrelated. According to(TOSUN & YURDAKUL, 2016), saw contamination in Turkey does not “help” to show that foreign direct investment (FDI) suffers as a result of appearance corruption over both short- and long-term time periods. According to certain financial experts ((Kardesler & Yetkiner, 2009); Jensen et al., 2010; Helmy, 2013), perceived degradation has benefits and is the real essential lubricant for the rigid association’s loud wheels.
Quazi, Vemuri, and Soliman (2014) discovered support for the speculation surrounding aid, i.e., devaluation activities involving FDI inflows in Africa. Most likely, Africa’s administrative climate is powerless overall, which helps explain the context in which the helping with giving speculation was permitted. Moustafa (2021) discovered a beneficial relationship between saw debasement and FDI, supporting the impact of defilement on “making everything flow well.” Many factors, including the cross-relationship of lease-producing resources with saw depreciation and FDI, and the use of FDI information in light of the equilibrium of installments that had developing monetary streams and ghost FDI portions, helped to explain this positive connection.
According to the detailed work by Bellos and Subasat (2012), over the period of 1990–2003, apparent debasement did not prevent MNCs from entering specific changing nations; on the contrary, it encouraged them to do so. According to a World Bank (2015) study, restrictions on FDI flows to East African manufacturing clusters were brought on by depreciation. a lack of progress in implementing fundamental reforms, and the presence of low-quality businesses. Yet, the review did not discover a link between political gamble and FDI flow (Muli and Aduda, 2017).
Amarandei (2013) focused on countries in Eastern and Central Europe and discovered a link between FDI and defilement. Corruption significantly affects a nation’s financial industry sectors by reducing the risk of investing in unproven portfolios, as demonstrated by Jain et al. (2017). The effects of speculating on unfamiliar portfolios are indirect, with the worst unfavorable effects occurring at intermediate contamination levels. Canare (2017) discovered that defilement reduces FDI inflows using board data from Asia and Pacific countries. In essence, Karim et al. (2018) shown that defilement is a crucial pointer in Southeast Asia’s section of unfamiliar interest.
According to Dreher and Gassebner (2013), defilement gives wasteful organizations the ability to get around difficult regulations and improve revenue flow. This could spur speculation from the shadows and serve as a safety net against insufficient forces, so boosting economic growth in nations with temperamental general laws (Cooray and Schneider, 2018). Ali et al. (2020) hypothesized a skewed relationship between debasement, the monetary system, and unrestrained financial movement. Concentrations also demonstrated that FDI attraction depends on combating debasement (Amarandei, 2013; Canare, 2017; Kurul, 2017).
Belgibayeva & Plekhanov (2016) claim that FDI fluctuates depending on how polluted the host country is. It is intriguing that many studies usually find proof that defilement has a favorable impact on FDI. The results of Subasat and Bellos (2013) are consistent with the “make everything go smoothly” hypothesis, which postulates that a decline in debasement levels would lead to a decline in FDI inflows. FDI stocks are fundamentally impacted by contamination, as stated by Barassi and Zhou (2012). Finally, Blundell-Wignall and Roulet (2017) found that debasement largely had little impact on FDI, either good or negative.
Political stability and Foreign Direct Investment (FDI)
Abala (2014) showed that devaluation was the cause of the country’s deficiencies, which prevent FDI inflows on FDI streams to the assembly hubs of East African states, and that political security matters for FDI in Kenya. Strong political systems make things easier, according to studies by Lee, Biglaiser, and Staats (2014).
Meanwhile, Hoa and Lin (2016) noted that political flimsiness, rather than typical assets and non-tradables, prevents FDI inflow to the non-asset tradable assembling as well as company administrations. According to Hayakawa, Kimura, and Lee (2013), postulate that political reliability and FDI inflow go hand in together. Rashid, Looi, and Wong Nottingham (2016), findings revealed that political stability had a significant impact on FDI inflows in the selected countries. Their results suggested that economic growth, political stability, and transparency all demonstrated significant long-term relationships with FDI inflows.
According to recommendations made by Yang et al. (2018), Luiz and Ruplal (2013), Driffield, Jones, and Crotty (2013), and De Beule and Duanmu (2012), political security deters FDI entry in a number of countries.
METHODOLOGY
The study adopted the empirical model of (Magbondé & Konté (2022) drawing from theoretical and empirical models of Cezar and Escobar (2015); Dutta and Osei-Yeboah (2013); Dutta and Roy (2011); and Islam et al. (2020). Foreign direct investment, or FDIit, is a dependent variable whose value represents the ratio of FDI to the GDP of country i at time t is modelled as a function of economic fundamentals including ease of doing business score (EDBS); political stability (POL); corruption (COR) and a set of control variables which include inflation rate (INFLR); real interest rate (RIR); gross domestic product (GDP); gross domestic saving (GDS) and Zimbabwe’s gross fixed capital formation (GFCF).
The model is specified as follows;
FDIit = α + β1FDEDit + β2INFLRit + β3RIRit + β4GDPGRit + β5GDSit + β6GRGCYit + ϵit
Cross-sectional and time dimensions are both taken into account by the suggested models to be estimated in this study. Furthermore, the research is going to use panel data largely it is compatible with Pooled Ordinary Least Squares (OLS) regression, a random effects model, or a fixed effects model. Below is a presentation of the theoretical regression model using panel data:
FDIit = α + Xitβ + ϵit …………………………………………..1
Where Xit = (X1t, X2t… Xkt ); β = (β1, β2… βk)
i = 1,2…., N t = 1,2……, T
and ϵit = πi + μt + ν
Diagnostic Tests
The research the research will apply the following econometric tests:
The Hausman test
The Hausman test will run in order to determine what the fixed effects and the random effects model. According to the null hypothesis, the random effects model is favoured over the fixed effects model. If the p-value was found to be significant (<0.05), the fixed effects model was to be adopted; if the p-value was found to insignificant, the random effects model was to be adopted.
Multi-collinearity
A Pearson connection test was used to check for multi-collinearity between the logical variables. If multi-collinearity, a high degree of correlation between two or more variables, is evident, there is a need to take corrective action.
Heteroskedasticity
The study is going to employ the Breusch-Pagan / Cook- Weisberg heteroscedasticity test to determine whether there was an uneven variance of the error term, or heteroscedasticity, in the residuals. In contrast to the alternative hypothesis, which asserts that the residuals are homoscedastic, the null hypothesis states that the residuals are heteroscedastic. In cases when the F-statistical probability is less than 0.05, the null hypothesis is to be rejected.
RESULTS
Multi-collinearity
Based on the findings in Table 1 above there is a clearly indication that explanatory variables are not highly linked because all of the values are less than 0.8, which excludes multicollinearity among the variables utilized for estimation.
Table 1: Correlation matrix
| FDI | EDBSR | RIR | GDP | GDS | GFCF | POLS | CORPI | |
| EDBSR | -0.5468
0.0000 |
1.0000 | ||||||
| INFLR | -0.3853
0.0000 |
0.2784
0.0008 |
1.0000 | |||||
| RIR | -0.1022
0.2246 |
0.3077
0.0002 |
-0.2838
0.0006 |
1.0000 | ||||
| GDP | -0.0879
0.2246 |
0.0071
0.9334 |
-0.0676
0.4225 |
0.0597
0.4789 |
1.0000 | |||
| GDS | -0.3619
0.0000 |
-0.0762
0.3657 |
0.3318
0.0001 |
-0.0846
0.3148 |
0.1578
0.0598 |
1.0000 | ||
| GFCF | -0.1521
0.0699 |
0.0198
0.8146 |
0.1215
0.1482 |
-0.0584
0.4887 |
0.3460
0.000 |
0.2774
0.0008 |
1.0000 | |
| POLS | 0.7185
0.000 |
-0.6773
0.000 |
-0.1941
0.0202 |
-0.3310
0.0001 |
0.0934
0.2673 |
0.0451
0.5929 |
0.1190
0.1569 |
1.0000 |
| CORPI | 0.7897
0.0000 |
-0.7728
0.0000 |
-0.2668
0.0013 |
-0.3112
0.0002 |
-0.0804
0.3399 |
-0.0793
0.3462 |
0.0869
0.3023 |
1.0000 |
Source: Author Compilation from Stata 14
Heteroskedasticity Test
Table 2
| Breusch-Pagan / Cook- Weisberg test for heteroskedasticity | |||
| Ho | Variables | Chi2(1) | Prob>chi2 |
| Constant Variance | Fitted value of FDI | 3.69 | 0.0348 |
Source: Author Compilation from Stata 14
The results of the Breusch-Pagan test for heteroskedasticity show that the model is not subjected to heteroscedastic. Since the residuals are homoscedastic, we reject the Ho in favour of the alternative hypothesis and insist that there is no heteroscedasticity because the probability of 0.0548 is less than 0.05 and it concluded that the results are accurate and can be interpreted.
Hausman Test
Table 3: Hausman Matrix
| H0: Effects are Random
H1: Effects are fixed |
|
| Chi2(11) = (b-B)'[(V_b-V_B)^(-1)](b-B) | Prob>chi2 |
| 17.77 | 0.0230 |
Source: Author Compilation from Stata 14
Based on the Hausman test the p value was found to be less than 0.05, it is however regraded to be significant. Therefore since, the p-value of 0.0230 is less than 0.05, we reject the null hypothesis that the effects are random, and conclude that the effects are fixed.
Fixed Effects Model Results
Table 4: Regression results (Fixed Effects Model (OLS))
| R-squared: within = 0.6204
: Between = 0.3597 : Overall = 0.3820 Prob> F = 0.000 Number of observations = 143 |
||||
| FDI | Coefficient | Standard error | t | P-value |
| EDBSR | 0.0522696 | 0.0436478 | 1.20 | 0.233 |
| INFLR | -0.06623 | 0.2296281 | -0.29 | 0.774 |
| RIR | 0.348388 | 0.2275507 | 1.53 | 0.128 |
| GDP | -0.4384681 | 0.159711 | -2.75 | 0.007* |
| GDS | 0.2551971 | 0.1335132 | 1.91 | 0.058* |
| GFCF | 0.3998212 | 0.1307509 | 3.06 | 0.003*** |
| POLS | 0.8793665 | 0.682254 | 12.89 | 0.000*** |
| CORPI | 2.231495 | 1.687398 | 1.32 | 0.188 |
| Cons | -34.60812 | 10.07149 | -3.44 | 0.001*** |
| Significant at 1%***
Significant at 5** Significant at 10%* |
||||
From the observation in the above table, the regression model then becomes:
FDIit= -34.60812+0.8793665POLSit+0.3998212GFCFit+0.2551971GDSit-0.4384681it
The study’s findings demonstrate that the model has a good explanatory power because the R2 within is 0.6204, which indicates that 62.04% of variations in FDI are explained by the independent variables.
DISCUSSION OF FINDINGS
A t-statistic of 1.20 that is less than 1.96 and a p-value of 0.233 show that ease of doing business is statistically insignificant in affecting FDI, suggesting that ease of doing business is not a driver of foreign direct investment. The results of this study are in contrast with those of Matei and Drumasu (2015), who found that cross-line trade was positively related to foreign direct investment inflows.
Furthermore, the results demonstrate a significant positive relationship between foreign direct investment and political stability. A t value of 12.89, which is much higher than 1.96, and a p-value of 0.000 further support the idea that political stability is crucial for attracting foreign direct investment to the SADC area. This implies that increasing political stability by one unit will result in an increase of 0.841998 in foreign direct investment, holding other variables constant. The findings of this study are consistent with those of Abala (2014), who showed that the devaluation of the country was to blame for the country’s shortcomings, which restrict FDI inflows on FDI streams to the assembly centres of East African states, and that political security mattered for FDI in Kenya. Investors feel safe when political stability prevails in one country thus ensuring safety of their investment.
Going forward, gross fixed capital formation and foreign direct investment were positively related with a positive coefficient of 0.3998212. The finding that gross fixed capital formation had a positive impact on attracting foreign direct investment inflows into that SADC region was supported by a t value of 3.06, which is higher than 1.96, and was indicated by a p-value of 0.003. Foreign direct investment will rise by 0.2857328 for every unit increase in gross fixed capital formation, assuming all other independent variables remain constant. While on the same note, gross domestic savings depicted a positive coefficient of 0.2551971, which demonstrates that there is a positive association between gross domestic savings and foreign direct investment. A z-value of 1.91, which is statistically below the usual range of z-values of 1.96, supports this motion. This suggests that gross domestic savings is not a driver of foreign direct investment. African countries with SADC region in focus has never enjoyed surpluses from their economies though known for being rich in mineral resources and fertile virgin land. A lot of factors have led to low or no domestic savings such as week institutions and political leadership which prioritises to invest outside Africa.
Moreso, the findings showed a negative relationship between the two variables when assessing the role of gross domestic product in luring foreign direct investment. The results of the regression analysis indicated that gross domestic product has a negative coefficient of -0.4384681 and a p value of 0.007, proving its importance in luring foreign direct investment to the SADC region. This is further supported by a t-value of -2.75, which is higher than -1.96. This indicates that, ceteris paribus, a unit decline in gross domestic product will lead to a 0.4384681 unit decline in foreign direct investment in the SADC region. Gross domestic product has signified a growing economy supporting by strong expansionary policies that opening more business for SADC economies. Furthermore, strengthening GDP suggests that economies are laying incentives for lure foreign direct investment which is now scarce and operates under stringent rules.
Findings regarding corruption’s effects on attracting foreign direct investment revealed that it has a marginally beneficial effect. A p-value of 0.188, which showed how corruption is statistically negligible in comparison to foreign direct investment in the SADC region, and a z value of 1.32, which is lower than 1.96, serve as additional evidence for this. The findings of this study support those of Jain et al (2017), who asserted that debasement has been demonstrated to considerably reduce the risk of investing in unproven portfolios. New portfolios are indirectly impacted by hypothesizing, with midway defilement levels having the most destructive detrimental impacts. According to Canare’s (2017) review of board data from Asia and the Pacific, defilement decreases FDI inflows. Corruption reduces local and foreign investments, increases poverty level, May affects the inequality of revenues and poverty through its effect on growth, on fiscality and the targeting of social programs. Corruption has damaged economic development is SADC region will the illicit of flow of money and precious minerals thus depriving economic growth.
Examining the impact of inflation on FDI inflows in the SADC region led to the discovery of a weakly significant negative link, which is strongly supported by a negative coefficient of -0.06623. With a p-value of 0.774 and a t value of 0.29, both of which are below 1.96 it can be seen that inflation has little impact on FDI in the SADC region. SADC region has been on an overdrive to redress macroeconomic stability to contain inflation pressures to put foreign direct investment. High inflationary economic environment has witnessed low foreign direct investment because return of investment is not definite. For investors, returns on investments should be at least as high as the inflation rate.
Lastly, the regression results indicated an insignificant positive relationship between real interest rates and foreign direct investment. A p-value of 0.128 and a t value of 1.53, which is less than the traditional z value of 1.96, respectively, supports the conclusion that real interest rates have a positive inconsequential impact on enticing foreign direct investment inflows into the SADC region. Interest rates a direct effect towards foreign direct investment. Economies with low interest rates has attracted foreign direct investment to boost economic growth. Meanwhile, high interest rates has drove capital to attractive economies and it has made borrowing to fund new capital projects very expensive. In turn, higher interest rates can place downward pressure on the value of some investments, such as more speculative high growth companies and even those offering long-term income streams such as property and infrastructure assets.
CONCLUSION
This study concluded that that there is a truly insignificant link between Ease of Doing Business and Foreign Direct Investment. Political stability and Gross fixed capital formation, ceteris paribus, all have a positive relationship. This implies that an increase in political stability and gross fixed capital formation will result in an increase in foreign direct interest in the SADC region. Foreign direct investment was found to have a negative link with GDP. Diverse factors, such as the Real Interest Rate, Gross Domestic Savings, and Inflation, have little impact on foreign direct investment inflows into the SADC region.
RECOMMENDATIONS
The study makes the following recommendations:
- The SADC region should develop responsible foreign capital regulations which offer incentives for localized investment, and lower unemployment rates by producing jobs and real income that can be used to either fuel economic growth or be saved in financial institutions.
- The SADC region should make sure that the institutional framework safeguards the property rights of a wide range of society’s citizens in order to encourage FDI and develop policies that aim to achieve macroeconomic, institutional, and political stability in order to increase the attractiveness of the nation to foreign investors.
- Governments in the SADC area should work to strengthen transparency on all macroeconomic issues, combat corruption in all facets of the economy, and inspire foreign investors to put their money in their nations.
- The SADC region must develop policies and strategies that are intended to provide empirical evidence that goes beyond the ease of doing business report, which only considers eleven areas of regulation. This information will maintain the level of foreign direct investment.
Future research needs to consider other groupings and zones, additional factors that affect foreign direct investment, member states of SADC countries on an individual level as well as utilizing time series data.
REFERENCES
- Asiedu, E. (2006). Foreign Direct Investment in Africa: The Role of Natural Resources, Market Size, Government Policy, Institutions and Political Instability. The World Economy, 29(1), 63–77. https://doi.org/10.1111/j.1467-9701.2006.00758.x
- Bayraktar, N. (2015). Importance of investment climates for inflows of foreign direct investment in developing countries. Business and Economic Research, 5(1), 24–50.
- Belgibayeva, A., & Plekhanov, A. (2016). Does corruption matter for sources of foreign direct investment? http://eprints.bbk.ac.uk/15260/
- Busse, M., & Hefeker, C. (2007). Political risk, institutions and foreign direct investment. European Journal of Political Economy, 23(2), 397–415.
- Cleeve, E. (2012). Political and institutional impediments to foreign direct investment inflows to sub‐Saharan Africa. Thunderbird International Business Review, 54(4), 469–477. https://doi.org/10.1002/tie.21477
- Dunning, J. H. (1980). Toward an eclectic theory of international production. The International Executive, 22(3), 1–3. https://doi.org/10.1002/tie.5060220301
- Dunning, J. H. (1981). Explaining the international direct investment position of countries: Towards a dynamic or developmental approach. Weltwirtschaftliches Archiv, 117(1), 30–64. https://doi.org/10.1007/BF02696577
- Dunning, J. H. (1988). The Eclectic Paradigm of International Production: A Restatement and Some Possible Extensions. Journal of International Business Studies, 19(1), 1–31. https://doi.org/10.1057/palgrave.jibs.8490372
- Ease of doing business report 2019. (n.d.). Bing. Retrieved 5 April 2024, from https://www.bing.com/search?q=ease+of+doing+business+report+2019&qs=UT&pq=ease+of+doing+business+report+2019&sc=10-34&cvid=B1BE79E5B3E947F1A052F44C75EBE120&FORM=QBRE&sp=1&ghc=1&lq=0&sm=csrmain
- Festus, L., Kasongo, A., Moses, M., & Yu, D. (2016). The South African labour market, 1995–2015. Development Southern Africa, 33(5), 579–599. https://doi.org/10.1080/0376835X.2016.1203759
- Financial times 2020. (n.d.). Bing. Retrieved 5 April 2024, from https://www.bing.com/search?q=financial+times+2020&qs=n&form=QBRE&sp=-1&ghc=1&lq=0&sm=csrmain&pq=financial+ times+2020&sc=1120&sk=&cvid=EB10777A99CF4B72989966C8311F1CFA&ghsh=0&ghacc=0&ghpl=
- Gillanders, R., & Parviainen, S. (2018). Experts’ Perceptions Versus Firms’ Experiences of Corruption and Foreign Direct Investment. The Manchester School, 86(2), 195–218. https://doi.org/10.1111/manc.12199
- Haidar, J. I. (2012). The impact of business regulatory reforms on economic growth. Journal of the Japanese and International Economies, 26(3), 285–307.
- Jayasuriya, D. (2011). Improvements in the World Bank’s ease of doing business rankings: Do they translate into greater foreign direct investment inflows? World Bank Policy Research Working Paper, 5787. https://papers.ssrn.com/sol3/papers.cfm?abstract_id=1923545
- Kardesler, E., & Yetkiner, I. H. (2009). The impact of corruption on FDI: An application of efficient grease hypothesis to EU countries. Working Papers in Economics. https://www.econstor.eu/handle/10419/175903
- Lumumba-Kasongo, T. (2013). Africa-Asia Relations since the End of “Unipolar” Globalization: Focus on Education and Research. African and Asian Studies, 12(1–2), 118–139.
- Magbondé, G. K., & Konté, M. A. (2022). Developing countries’ economic fundamentals and FDI inflows: The moderating role of institutions. Cogent Economics & Finance, 10(1), 2028976. https://doi.org/10.1080/23322039.2022.2028976
- Mahuni, K., & Bonga, W. G. (2017). Nexus between doing business indicators and foreign direct investment for Zimbabwe: A time series analysis. Journal of Economics and Finance, 2(2), 1–8.
- Matete, D. (2021). The relationship between corruption, ease of doing business and FDI inflows in SADC countries. https://open.uct.ac.za/handle/11427/35861
- Mathur, A., & Singh, K. (2013). Foreign direct investment, corruption and democracy. Applied Economics, 45(8), 991–1002. https://doi.org/10.1080/00036846.2011.613786
- Nangpiire, C., Rodrigues, R. G., & Adam, I. O. (2018). Ease of doing business and foreign direct investment inflow among Sub-Sahara African countries. International Journal of Business and Emerging Markets, 10(3), 289. https://doi.org/10.1504/IJBEM.2018.093006
- Stigler 1971. (n.d.). Bing. Retrieved 5 April 2024, from https://www.bing.com/search?q=stigler+1971&qs=SC&pq=stigler%2c+1971&sc=5-13&cvid=D2FEC5F02FF14097BC9C7E0D14A32AD0&FORM=QBRE&sp=1&ghc=1&lq=0&sm=csrmain
- The Ease of Doing Business in the East African Community. (2023).
- TOSUN, U., & YURDAKUL, M. O. (2016). AN INQUIRY ON THE LIKELY EFFECTS OF CORRUPTION ON THE FOREIGN DIRECT INVESTMENTS IN TURKEY. Hacettepe University Journal of Economics & Administrative Sciences/Hacettepe Üniversitesi Iktisadi ve Idari Bilimler Fakültesi Dergisi, 34(4). https://search.ebscohost.com/login.aspx?direct=true&profile=ehost&scope=site&authtype=crawler&jrnl=13018752&asa=Y&AN=120705991 &h=21oiH2EFsxpZm1dSxdfI6WkvPtB4InePShz4oDzmWhD1d7B84xiuwM%2B1R%2Fi6on19O1quK GNOkNsRP73WdEa7vw%3D%3D&crl=c
- Unctad 2020. (n.d.). Bing. Retrieved 5 April 2024, from https://www.bing.com/search?q=unctad+2020&qs=MT&pq=unctad%2c+2020&sc=6-12&cvid=E10538A58BA8445FAC983974A58FA624&FORM=QBRE&sp=1&lq=0&sm=csrmain
- Vogiatzoglou, K. (2016). Ease of doing business and FDI inflows in ASEAN. Journal of Southeast Asian Economies, 343–363.
- Vogiatzoglou, K., & Nguyen, P. N. T. (2016). Economic openness and economic growth: A cointegration analysis for ASEAN-5 countries. The European Journal of Applied Economics, 13(2), 10–20.
- World bank 2019. (n.d.). Bing. Retrieved 5 April 2024, from https://www.bing.com/search?q=world+bank+2019&qs=MT&pq=world+bank+2019&sc=9-15&cvid=3FC57F6AF33441C28B0ECD19304C139C&FORM=QBRE&sp=1&ghc=1&lq=0&sm=csrmain
- World Bank Annual Report 2019. (n.d.). Retrieved 5 April 2024, from https://thedocs.worldbank.org/en/doc/435871587148191699-0330212020/Annual-Report-2019
- Adepoju U.K., (2017), Ease of Doing Business and Economic Growth, University of Ottawa, Ottawa,Ontario.
- AFDB socio economic database (2019) ,AFDB Socio Economic Database, 1960-2020, African Development Bank.
- Aghion P., D. Comin, P. Howitt and I. Tecu (2009) “When Does Domestic Saving matter for Economic Growth?” Harvard Business School Working Paper No:09-080
- Amadeo K., (2019), Economic Growth, Its Measurements, Causes, and Effects, The Balance, Dotdash publishing family.
- Ang, J.B. (2008). Are Financial Sector Policies Effective in Deepening the Malaysian Financial System? Contemporary Economic Policy, 62:623-635.
- Ani R., (2015), Effect of Ease of Doing Business to Economic Growth among Selected Countries in Asia, Asia Pacific Journal of Multidisciplinary Research, Vol. 3, No. 5, December 2015
- Apunda, R. (2009). Effect of Corruption on Economic Growth, University of South Africa.
- Bonga W. G (2014). An Empirical Investigation of the Nature of Corruption in Zimbabwe. Doctorate Thesis, Atlantic International University, Honolulu, Hawaii.
- Deniz P., Ozturkler H., (2010) Effect of Income Inequality on Aggregate Saving: A Panel Analysis. International Conference on Economics and Politics – I: Global Crises And Economic Governance, 15-16/04/2010, At Malatya, Turkey
- Djankov, S., McLiesh, Ramalho and Shleifer (2010), “The Regulation of Entry: A Survey“, CEPR Discussion Papers7080, C.E.P.R. Discussion Papers.
- Doing Business Report (2019), Training for reform, A world Bank Group flagship Report, 16th Edition, World Bank Group.
- DokerCA ,Turkmen A, Emsen O.S (2017), What Are the Demographic Determinants of Savings? An Analysis on Transition Economies (1993-2013), GLOBALConference OnBusiness, Economics, Management And Tourism, 26-28 November 2015, Rome, Italy Dovi, E, (2009) ,Boosting domestic savings in Africa, African renewal.
- Du Plessis G, (2008). An explorations of the determinants of South Africa’s personal savings rate-Why do South African Households save so little?, University of Pretoria
- Eifert, P. Benjamin (2009) “Do regulatory reforms stimulate investment and growth? Evidence from the doing business data, 2003-07.” Centre for Global Development, Working Paper No. 159.
- Friedman, M. (1957). A Theory of the Consumption Function. Princeton University Press, Princeton University, Princeton.
- Gebeyehu, W. (2010). Causal Links Among Saving, Investment and Growth and Determinants of Saving in Sub-Saharan Africa: Evidence From Ethopia. Ethopian Journal of Economics, 1-34
- Gobna, W.O. and Nurudeen, A. (2009). Long Run Determinants of Inflation (1981- 2007); Evidence from Time Series Data. The Nigerian Journal of Economics and Management Studies. 4(1): 87-106
- Haidar, I. J (2012). ‘‘The impact of business regulatory reforms on economic growth.” Journal of the Japanese and International Economies 26, 285–307.
- Hishongwa E. N., (2015), The relationship between saving mobilisation, investment and economic growth in Namibia, Stellenbosch University, South Africa.
- Jane M. Birungi J.M., (2013). The Effect Of Selected Macroeconomic Variables On Government Revenues In Rwanda, School Of Business University Of Nairobi 157-178.
- Jayasuriya, Dinuk (2011). ‘‘Improvements in the World Bank’s Ease of Doing Business Rankings; Do they translate into greater foreign direct investment inflows?” Development Policy Centre, Discussion Paper 8.
- Kapingura (2015). Determinants Of Savings In The SADC Region: The Role Of Foreign Capital And Financial Development, The Journal of Applied Business Research, Volume 31, No 6, South Africa.
- Kaufman.D.,(2019). World-Governance-Indicators, Natural Resource Governance Institute (NRGI),World-Bank-Group.,
- Khan I.M., Khan K.M., Teng J.Z., Nauman M., (2017). Determinants of National Saving: Evidence from South Asian Countries, European Academic ResearchV(8):4158-4189 ·
- Khan M.I, Teng J.Z, Khan M.K., Jadoon A.U, Rehan M., (2017). Factors Affecting the Rate of Gross Domestic Saving in Different Countries, European Academic Research, ISSN
- Khan M.K, Abasimi I., Teng J.Z, Rehan M, (2016). Determinants of Gross Domestic Saving: An Evidence from Asian Countries, Researchgate
- Kibet, L.K., Mutai, B.K., Ouma, D.E., Ouma, S.A. and Owur, G. (2009). “Determinants of household saving: case study of smallholder farmers, entrepreneurs and teachers in rural areas of Kenya”, Journal of Development and Agricultural Economics, Vol. 1 No. 7, pp. 137- 143.
- Kinugasa T and Mason A (n.d). The Effects of Adult Longevity on Saving, Researchgate
- KivançHalil ARIÇ (2015). Determinants of savings in the APEC countries, Cumhuriyet University, Turkey
- Kivindu M.M. (2013). Factors Determining Gross Domestic Savings In Kenya, University of Nairobi, Kenya.
- Konstantinos T, (2015). Determinants of national savings in Greece during the period 1990- 2010. MPRA Paper 56773, University Library of Munich, Germany
- Kothari, C.R. (2004). Research Methodology: Methods and Techniques. 2nd Edition, New Age International Publishers, New Delhi.
- Kudaisi, B. V. (2013). Savings and its Determinants in West Africa Countries (1980-2006), Journal of Economics and Sustainable Development.
- Marek H. (2012). The Doing Business Indicators, Economic Growth and Regulatory Reform. Policy Research Working Paper; 6176.
- Mbuthia, A. N. (2011). Households’ saving decisions in Kenya. Kenyatta University Press, 1- 173.
- Mckinnon, R.I. (1973). Money, Capital and Banking in Economic Development, Brooklyn Institution, Washington D.C
- Modigliani, F. (1970). “The Life-Cycle Hypothesis Of Saving And Inter-Country Differences In The Saving Ratio”, Oxford, Pp. 197-225.
- Ndirangu, E. P.M. and Muturi, W. (2015). Determinants of Gross Domestic Savings in Kenya (1970-2013). International Journal of Economics, Commerce and Management, III(7), pp.
- Nindi A, Odhimbo N.M , (2014), Savings and investment in Malawi, Investment Management and Financial Innovations, 11(4), 2014
- Nwachukwu., T.E and Odige, P., (2009)., What Drives Private Savings in Nigeria?., A paper presentation at the African Economic Society (AES) conference, Cape Town., South Africa.
- Okafor, L. M. (2010). Saving less when there is more? Foreign debt and savings in developing countries. Journal of economic policy reform, 13(3), 213-223.
- Okere, P., &Ndugbu, M. (2015). Macroeconomic Variables and Savings Mobilization In Nigeria. International Journal for Innovation Education and Research, 3(1), 105-116.
- Olando, A. (2021). The Association between ease of doing business attributes and net foreign direct investment flows into Kenya’s manufacturing sector [Thesis, Strathmore University]. http://hdl.handle.net/11071/126031
- Delwar H. (2012). Differential impacts of foreign capital and remittance inflows on the domestic saving in the developing countries: A dynamic heterogeneous panel analysis.
- Report On The Ease Of Doing Business In The East African Community (EAC) 2023.
- Saunders, A., Lewis, A. &Thornhill, A., (2009). Research Methods for Business. s.l.:s.n.
- Shaheen, S., Maryam, F and Javed, F. (2013). Impact of foreign capital inflows on domestic saving of Pakistan. Institute of Interdisciplinary Business Research, 4(10), 2013, 443-457.
- Southern African Development Community (SADC) Doing Business 2019 Indicators
- Tedla G, (2016). Determinants of Gross Domestic Saving: An Empirical Evidence from East Africa, Addis Ababa University
- Temitepo L.A.L. (2014). The effects of foreign resources inflow and savings on the economics growth of South Africa: A VAR. Journal of economics &Behavioural studies Vol 6 No.3.pp 232-241.
- Touney M (2008). Determinants of Domestic Saving Performance in Egypt: An empirical study, Journal of commercial studies and researchers.
- United Nations Economic Commission for Africa (2011). Addressing the Challenges of Macro-economic Policy Convergence in the SADC Region, United Nations
- Vogiatzoglu (2016). Relationship Between Ease Of Doing Business And Foreign Direct Investment, Addressing And Implementing Measure To Increase FDI in Kenya
- World Bank, (2016). World Development Indicators, http://datatopics.worldbank.org/world- development-indicators/ (Accessed 26/08/2019)
- World Bank, Washington, DC. © World Bank. https://openknowledge.worldbank.org/handle/10986/12020 License: CC BY 3.0 IGO.”