
Tokopedia Digital Engagement Monitoring through Trend Analytics: Case Study of Indonesia
- Dianta Hasri Natalius Barus
- 2275-2283
- Apr 18, 2024
- Business Management
Tokopedia Digital Engagement Monitoring through Trend Analytics: Case Study of Indonesia
Dianta Hasri Natalius Barus*
Program Vokasi, Universitas Katolik Parahyangan, Indonesia
*Corresponding Author
DOI: https://dx.doi.org/10.47772/IJRISS.2024.803159
Received: 03 March 2024; Revised: 14 March 2024; Accepted: 19 March 2024; Published: 18 April 2024
ABSTRACT
Purchases are initiated on the Tokopedia platform by more than 120 million monthly users. There is a 43% decline in the prominence of Tokopedia between 2020 and 2023. The decrease in search engine traffic on Google has led to this outcome. Their comprehensive advertising strategy, which combines traditional and digital marketing methods, is probably the reason for Tokopedia’s high Google ranking.
The reversal of the declining trend line and its subsequent ascent are anticipated outcomes of the cross-average analysis during the upcoming semester. Nevertheless, attaining the identical degree of recognition as in 2020 will prove difficult on account of the limited volume.
Decreased efficacy or communication intensity could contribute to a decline in the prevalence of digital media. Spiking interest among the target market and refining communication strategies could potentially improve this. To analyze the pertinent market volume and popularity trends for exposure, additional research is required.
Keywords: E-Commerce, Market Trends, Digital Analytic, Marketing, Google Trend
INTRODUCTION
The internet facilitates the establishment of prompt and dependable connections between businesses and their target audience. E-commerce has emerged as the primary medium through which numerous businesses accomplish their objectives. It enables businesses of any size to penetrate the vast Indonesian market. Unexpectedly, the number of e-commerce consumers in Indonesia has increased. E-commerce refers to the digital exchange of goods and services between businesses and consumers, facilitated by computer networks [1]. E-commerce efficiently diminishes administrative expenses and transaction duration while augmenting the level of interaction between organizations and their clientele. E-commerce endeavors to improve the caliber of products and services, thereby reducing the consumption of resources. Middle market demand has been the primary driver of Indonesia’s e-commerce sector’s substantial growth over the past decade.
Internet development has been driven by customer input, commercial objectives, and innovation. Information and technology play a pivotal role in stimulating innovation, which in turn generates heightened public engagement and interest in digital media [2]. Organizations have recognized digital media as an indispensable tool for augmenting their capabilities and expanding their market presence.
Social networking sites serve as a vital component of new media by facilitating user communication and content creation. Social media services are constructed upon a technical software framework that has its roots in the Web 2.0 era. Social media platforms play a pivotal role in shaping the daily purchasing decisions of consumers by virtue of the extensive volume of information they offer [3].
The pervasive impact of the internet and the advancements of Web 2.0 continue to have a profound effect on numerous facets of our everyday existence, most notably on the purchasing decisions of consumers. The substantial transformation in information consumption patterns, which has been precipitated by the proliferation of social media platforms and electronic devices (particularly mobile phones), is evident not only in China nonetheless in numerous other countries.
Indonesia has the highest volume of electronic commerce traffic among Southeast Asian countries. It is anticipated that Indonesia will experience double-digit growth by 2025. It caters to both the middle-class consumer base and a productive populace [4]. Amidst the Covid-19 pandemic in 2022, an estimated 36 percent of e-commerce consumers in Southeast Asia have been recognized as newcomers. Indonesia witnessed a 37% surge in new consumers, while Vietnam experienced the most substantial expansion at 41%.
Shopee and Tokopedia have been the leading rivals in their respective sectors and are involved in an intense rivalry. More than 120 million people visit Tokopedia and Shopee monthly, and this figure is continuously increasing, particularly since the Covid-19 pandemic has reached its endemic phase.
The middle market is the primary focus of the e-commerce industry in Indonesia, demonstrating substantial parallels in their customer base. A considerable proportion of the middle market consists of individuals who are predominantly in their prime working years. The primary rationale behind the utmost motivation of e-commerce is to target this demographic characteristic.
Tokopedia is among two e-commerce websites that consistently attracts over one hundred million visitors per month. Over the past two years, Millennials have emerged as the most significant client demographic within the e-commerce sector. During the years 2020 to 2021, electronic commerce expenditures increased due to the Covid-19 pandemic. E-commerce serves as the principal catalyst for digital business operations across enterprises of varying scales, affording vendors an extensive array of marketing prospects [5].
STUDY LITERATURE
A significant proportion of online consumers in the Indonesian market demonstrate a pronounced sensitivity to price fluctuations. As a result, numerous organizations opt to utilize discounts as their primary strategy, as it increases sales directly. Additionally, social media impacts the purchase intent of clients. According to some studies, only a subset of social media platforms is substantially associated with increased sales. It has been observed that when a company opts to promote the price reduction gathering on social media channels, these elements mutually influence one another. In electronic commerce, discount strategies are frequently implemented as a promotional instrument to attract customers and generate rapid sales. In Indonesia, discounts are implemented as a means of stimulating impulsive buying behavior among consumers, irrespective of the extent of the reduction.
By employing a discount strategy, immediate sales may increase substantially. Exercise caution and abstain from excessively utilizing discounts, as this could potentially jeopardize the long-term branding of the organization. Frequent discounts provided by companies may induce purchasers to question the products’ quality and value. Moreover, this could potentially have an adverse effect on consumer perception, particularly regarding products priced moderately to higher. E-commerce businesses frequently employ discount strategies to rapidly capture their intended audience and boost revenue. Discounts are frequently employed to motivate customers to engage in impulsive buying, regardless of the magnitude of the reduction in price.
Comprehension of the consumer journey within an organization is an essential component of digital marketing strategy. From initial exposure to advertisements to the moment of purchase, companies analyze the customer voyage to comprehend the relationship with the customer. By utilizing funnel marketing, businesses can examine each phase of the customer’s purchasing journey. A modification of the Awareness, Interest, Desire, and Action model constitutes funnel marketing. The sequence in which consumers become cognizant of a product, cultivate curiosity, and aspire to execute a purchase. It offers organizations a framework within which to develop a marketing approach [6].
The awareness stage refers to the initial point at which a consumer is exposed to our advertising. It provides users with the opportunity to obtain pre-launch information regarding the brand and its products. Consumers will proactively seek out the promotions that the brand or company is offering. Individuals peruse the online presence or webpage of the organization to identify any products or services that may capture their attention. In the third stage, customers locate the products they require within the store and proceed to add them to a shopping cart. Upon careful deliberation and assessment, the consumer will ultimately progress to the concluding phases, wherein they engage in action by converting. The average sales conversion rate in the industry is approximately 5%.
It is imperative that online consumers are provided with comprehensive and unambiguous information pertaining to the products they intend to purchase. According to research, 94% of purchasers consider product information crucial for increasing their interest and intent to purchase. Consumers have a greater propensity to prefer and place value on businesses that offer credible and easily accessible information through all of their sales channels.
An increasing number of consumers in several Asia-Pacific countries are interested in purchasing unique and authentic products. In 2021, there was a notable increase in the volume of keyword searches pertaining to phrases such as “official” and “legitimate.”
Communication via word-of-mouth WOM has emerged as a significant determinant within the tourism and travel sectors [7]. This phenomenon has arisen due to the rapid progression of modern technologies. The impact of e-WOM on customer purchasing decisions in the tourism and hospitality sectors is substantial. In recent decades, the pervasive adoption of ICT has altered the behaviors of tourists and the tourism industry. There has been a consistent upward trend in the utilization of third-party intermediaries for online hotel reservations, and this trend is expected to continue. Particularly during the advance purchase phase, infomediaries in the hospitality industry significantly facilitate the interchange of information through electronic word-of-mouth [7]. 73% of respondents to a previous survey prefer to peruse online reviews of hotels rather than relying solely on the establishment’s self-description. According to a survey, a considerable proportion of prospective hotel customers, in hundreds of millions, peruse online reviews.
Existing research indicates that many internet consumers, specifically 78%, are influenced by reviews on the internet when making purchasing decisions. Consumer feedback received online has emerged as a significant information resource pertaining to travelers, serving a critical function in social research and the acquisition of transportation services [8]. Over the past several decades, tourism has expanded consistently to become one of the world’s most significant and swiftly expanding economic sectors. It is anticipated that international immigration will increase by 57% by 2030, reaching a total of more than 1.8 billion individuals.
An examination of travel websites and social media platforms is of utmost importance to comprehend the growing influence of electronic word-of-mouth (e-WOM) across diverse social networks and its impact on hotel patrons’ purchasing decisions. e-WOM is a form of marketing in which a product or service is promoted through word-of-mouth using technology.
The level of support and establishment of trust that consumers are willing to extend when purchasing new products or services from alternative sources is significantly impacted by trust. Customers’ apprehensions regarding the dangers and unpredictability of purchasing goods and services may be alleviated by establishing a trustworthy relationship between businesses and consumers [9]. Scholarly inquiries into consumer behavior frequently scrutinize the dependability of information sources, with a particular emphasis on contrasting the effects of WOM and traditional word-of-mouth communication. The dependability of the information sources that consumers consult can have a substantial effect on the purchasing decisions of consumers when it comes to services and products. This presents a potential avenue for increasing the likelihood of cooperative behavior among both consumers and merchants, as well as their own likelihood of engaging in such conduct. In addition, customer social relationships are characterized by the amount of time spent shared, the depth of emotions expressed, and the degree of mutual trust. The dissemination of information possesses the capacity to attain increased influence, reliability, and trustworthiness when coupled with robust social connections [10]. As stated in this argument, it is critical to perceive the impact that offline and online word-of-mouth (WOM) communication may have. When disclosing information to clients, it can be categorized into two fundamental classifications.
METHODOLOGY
This research employs a quantitative methodology. A total of 209 weekly data points were utilized to analyze the prevalence trends of Tokopedia on Google for the period 2020 to 2023. The data was converted into weekly units. After analyzing data acquired from Google Trend, a comparison is made between the levels of prevalence, trends, and potential.
FINDINGS
The research findings were based on analyzing huge data from 209 weeks of popularity indicators from Google Trends about Tokopedia in Indonesia, revealing some intriguing results for further study.
The weekly data is turned into monthly, quarterly, semester, and yearly averages. This is meant to achieve a more dependable trend pattern by using moving averages.
The monthly average statistics will indicate the fluctuation of Tokopedia’s popularity in the current month. The mean displacement will be beneficial for monitoring in the near run. Quarterly data, separated into four sections annually, offers insights into popularity every three months. Marketers may use this for studying shifts in customer perception and Tokopedia’s strategies in engaging with its target audience. The semester average data reflects the average performance over a six-month period, aiming to assess Tokopedia’s trajectory during significant events like Ramadan in terms of sustaining its popularity. The yearly average statistics is valuable for assessing Tokopedia’s popularity performance throughout the course of their one-year marketing campaign.
Table 1. Tokopedia Digital Trend Analytic 2020-2023
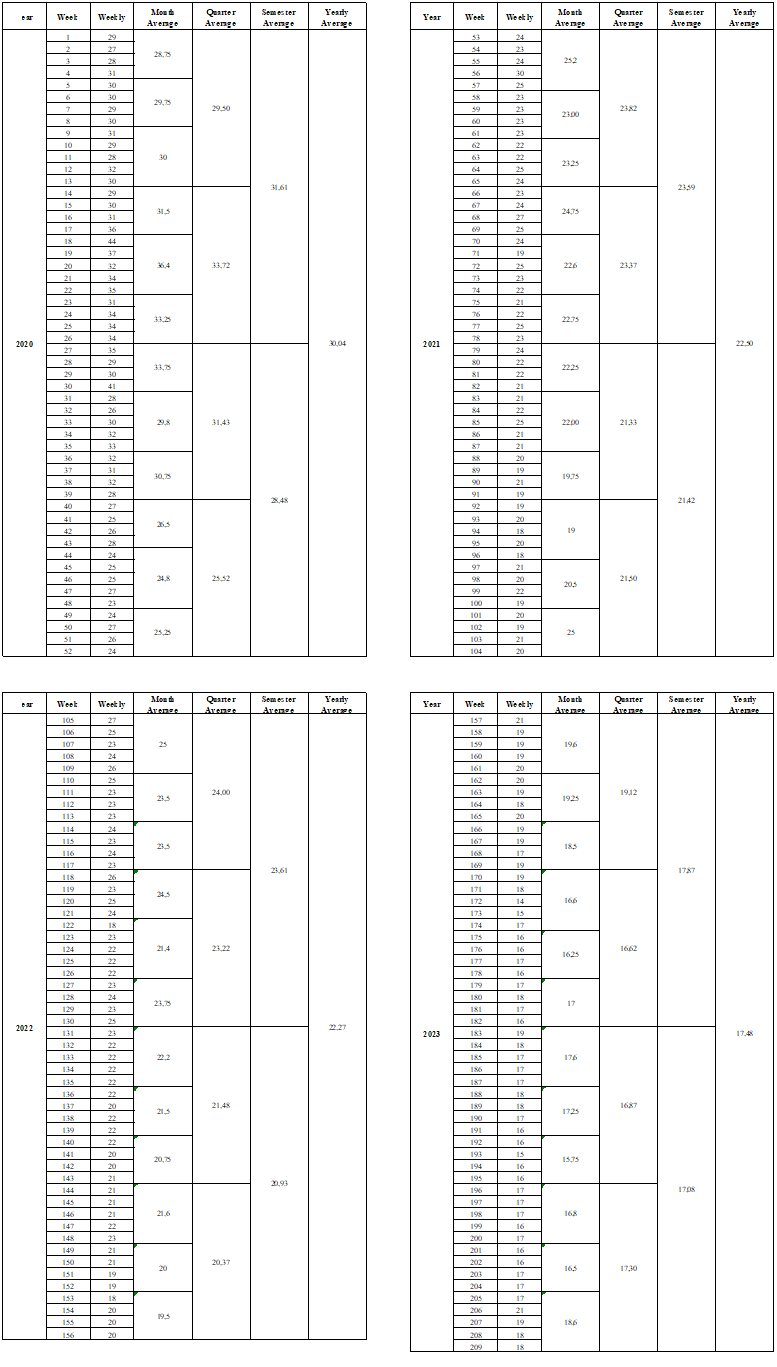
Table 1 displays four main data sections: the aggregation and computation of average data from 2020 to 2023 (January to December). The yearly average popularity of Tokopedia has notably declined from 30.04 in 2020 to 17.48 in 2023. This suggests a decrease in Tokopedia’s popularity in Indonesia. Fluctuations vary annually. 2020 to 2021 were the peak year for Covid-19 in Indonesia, leading to tight community operation limitations that impacted Tokopedia’s activities.

Fig. 1. Tokopedia’ Monthly Popularity Average
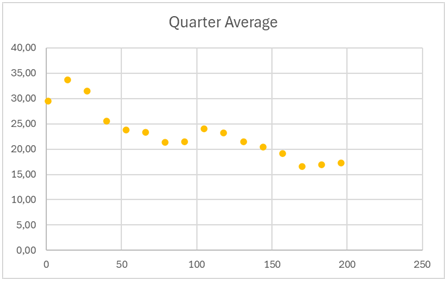
Fig. 2. Tokopedia’ Quarterly Popularity Average

Fig. 3. Tokopedia’ Semester Popularity Average
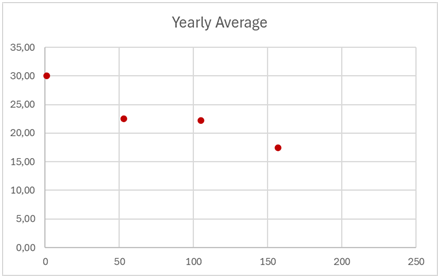
Fig. 4. Tokopedia’ Yearly Popularity Average
Figure 1 displays a depiction of the monthly average data. The data is analyzed and presented using the scatter graph technique to facilitate the examination of indicator trends. There were variations over the observation period, but overall, there was a monthly drop during the last 4 years. Figure 2 displays a scatter plot showing the indicators’ movement every three months. Typically, the indicators’ trend mirrors that of Figure 1, but using a three-month average provides a clearer and more analyzable representation.
Otherwise, Figure 3 displays the average statistics for the current semester. Tokopedia saw a temporary increase in the first semester of 2022, but it lacked enough market interest to sustain the growth, leading to a subsequent decrease in popularity. At the other side, Figure 4 shows that Tokopedia’s popularity peaked in 2020, declined in 2021, attempted to recover in 2022, but faced a further decrease in 2023 due to weak market demand.
The scatter analysis will assist academics in visualizing the fluctuations in Tokopedia’s popularity patterns. A cross-test technique will provide a strategic perspective of the object’s future popularity position, enabling them to implement required communication interventions to achieve certain popularity indicators.
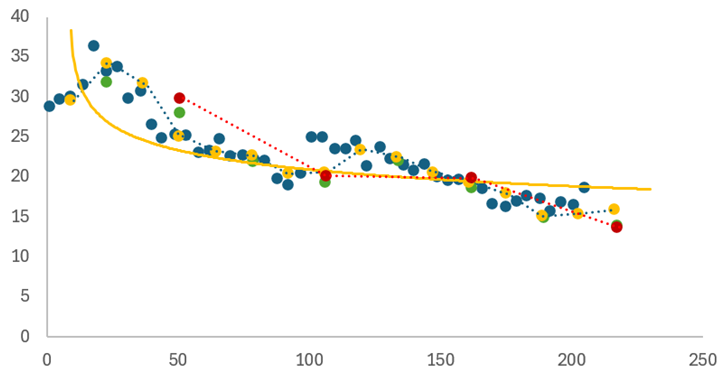
Fig. 5. Tokopedia’ Trend Test
Figure 5 displays the visualization results of the average cross-data test each period, including month, quarter, semester, and year. Three trend lines were derived from the data and intersected at many places.
The data indicates that Tokopedia’s overall popularity has significantly decreased over the last four years. However, the trend line suggests that there will be a rise in the indicator next semester. The yearly indicator displays a decreasing trend due to insufficient volume to enhance Tokopedia’s standing.
CONCLUSION
Tokopedia’s popularity has decreased by 43% from 2020 to 2023, according to academics. This is a result of the declining amount of search traffic on Google.
According to the cross-average analysis, the falling trend line is expected to reverse and show a rise in the next semester. However, due to the small volume, it will be challenging for Tokopedia to reach the same level of popularity as in 2020.
Decreased popularity in digital media might result from diminished communication intensity or decreased efficacy. Enhancing communication tactics and boosting target market interest might enhance this. Additional study is necessary to analyze the relevant popularity trends and market volume for exposure.
REFERENCES
- Laudon, K., dan Laudon, J. Management Information Systems: International Edition, 11/E. Pearson Higher Education (2009)
- Barus, D.H.N., 33 Strategi Marketing Terpenting Dekade Ini. Gramedia Pustaka Utama. 2024.
- iPrice, https://iprice.co.id/insights/mapofecommerce
- Lv, Junjie & Wang, Zichen & Huang, Yuqing & Wang, Tong & Wang, Yuanzhuo. How Can E-Commerce Businesses Implement Discount Strategies through Social Media?. Sustainability (2020)
- Kim, N.; Kim, W. Do Your Social Media Lead You To Make Social Deal Purchases? Consumer-Generated Social Referrals for Sales Via Social Commerce. Int. J. Inf. Manag (2018)
- Jallow, H., & Dastane, O. Effect of Sales Promotion Schemes on Purchase Quantity: a Study of Malaysian Consumers. Management and Marketing Journal (2016)
- Papathanassis, A.; Knolle, F. Exploring the adoption and processing of online holiday reviews: A grounded theory approach. Tour. Manag. 2011, 32, 215–224.
- Mauri, A.G.; Minazzi, R. Web reviews influence on expectations and purchasing intentions of hotel potential customers. Int. J. Hosp. Manag. 2013, 34, 99–107.
- Hussain, S.; Ahmed, W.; Jafar, R.M.S.; Rabnawaz, A.; Jianzhou, Y. eWOM source credibility, perceived risk and food product customer’s information adoption. Comput. Hum. Behav. 2017, 66, 96–102.
- Ismagilova, E.; Slade, E.L.; Rana, N.P.; Dwivedi, Y.K. The effect of electronic word of mouth communications on intention to buy: A meta-analysis. Inf. Syst. Front. 2020, 22, 1203–1226.