
Understanding the Impact of Demographic Factors and Education Policy on Enrollment Trends: A Study in China
- XuXu
- Jereco Jims J. Agapito
- Mike Vincent F. Baccol
- 2900-2916
- Apr 24, 2024
- Education
Understanding the Impact of Demographic Factors and Education Policy on Enrollment Trends: A Study in China
XuXu1, Jereco Jims J. Agapito2, Mike Vincent F. Baccol3
1,3Graduate School of Business, University of the Visayas, Philippines, Dionisio Jakosalem St, Cebu City, Philippines
2Eastern Visayas State University Ormoc City Campus, Brgy. Don Felipe, Ormoc City, Philippines
DOI: https://dx.doi.org/10.47772/IJRISS.2024.803201
Received: 04 March 2024; Revised: 19 March 2024; Accepted: 23 March 2024; Published: 24 April 2024
ABSTRACT
This study addresses the complex interplay between demographic factors and educational enrollment trends in China, with a focus on understanding how population dynamics and education policies influence enrollment patterns. Utilizing a cross-sectional design and time series data from 2010 to 2020, the research examines the effects of population size, structure, distribution, and birth rate on enrollment trends, moderated by education policy assessments. The findings reveal significant correlations between demographic factors and enrollment trends. Specifically, as population size increases, enrollment tends to decrease, while decreasing birth rates are associated with increased enrollment. Urban areas show higher enrollment rates compared to rural areas, reflecting disparities in access to educational resources. However, the study finds mixed evidence regarding the influence of population average age on enrollment trends. Moreover, the research investigates the moderating effect of education policy assessments on demographic factors. While education policies have a positive moderation effect on population size and birth rate, the study suggests limited impact on the relationship between population average age and enrollment trends. This study provides valuable insights for educational planning and policy development, emphasizing the need for strategic adjustments to accommodate changing population dynamics and ensure continued access to quality education. Additionally, the predictive model developed in this study offers a practical tool for understanding enrollment patterns and guiding policy decisions in the educational sector. However, the study acknowledges limitations related to generalizability and the complexity of external factors influencing enrollment trends, highlighting avenues for future research to enhance the predictive model and deepen understanding of enrollment dynamics.
Keywords: Enrollment trends, demographic factors, education policy, population dynamics
INTRODUCTION
The decline in birth rates in China, as evidenced by the National Bureau of Statistics (2023) from 2001 (17 million births) to 2022 (9.6 million births), coupled with an overall mortality rate of approximately 7.2 deaths per 1,000 people per year as reported by the World Bank (World Bank, 2022), collectively shape the demographic landscape and have significant implications for the education system. While much attention has been rightfully directed towards the declining birth rates, it’s essential to recognize the concurrent influence of mortality rates on population dynamics and, consequently, on educational enrollment rates.
Mortality rates, particularly in the context of an aging population, play a critical role in shaping the size and composition of the population available for education (Xie, 1996). As mortality rates impact the number of individuals within certain age cohorts, they indirectly affect the demand for educational services across various age groups. In China, with an aging population and a declining birth rate, the mortality rate contributes to a decrease in the number of young individuals entering the education system, thereby influencing enrollment rates at different educational levels.
The interplay between declining birth rates, increasing mortality rates among certain age groups, and the resultant demographic shifts poses multifaceted challenges for educational institutions, particularly regarding enrollment planning and resource allocation. With a shrinking pool of potential students due to both declining birth rates and mortality rates, educational institutions, including private higher vocational colleges, must strategically adapt their recruitment and retention strategies to attract and retain students in an increasingly competitive landscape.
Moreover, the impact of mortality rates on enrollment rates extends beyond demographic considerations. High mortality rates among certain age groups may also reflect underlying socioeconomic factors, such as access to healthcare, economic stability, and social support systems. These factors can influence educational participation rates, particularly among vulnerable populations, and require targeted interventions to address disparities in educational access and attainment.
In light of these complex dynamics, understanding the nuanced relationship between mortality rates and enrollment rates is crucial for informing educational policies and resource allocation strategies. Educational institutions and policymakers must consider not only the implications of declining birth rates but also the broader demographic context, including mortality rates, to develop proactive and adaptive responses to evolving enrollment challenges.
Statement of the Problem and Objectives
- Analyze the long-term effects of population size and birth rate on enrollment trends.
- Explore the influence of population average age on enrollment trend.
- Examine the influence of population distribution on enrollment trends. Study the difference effect of population distribution in urban and rural on enrollment trend.
- Explore if the education policy assessment truly moderated the Population size, Population average age, and Birth rate over the enrollment trend.
- Generation prediction model according to the results of the study.
Research Hypothesis
The relationship between population size and enrollment trends has been a subject of significant scholarly investigation, particularly in the field of education and economics (Allen et al., 1995; Liu, 1998; Edelman et al., 1988; Siegel et al., 1986). Researchers have explored the complex dynamics between these variables, seeking to understand how demographic changes influence patterns of enrollment in educational institutions. Graves and Kuehn (2021) conducted a seminal study examining the impact of population size on school enrollment in urban areas. Their findings suggested a positive correlation between population growth and increased enrollment in both primary and secondary education. The study emphasized the need for urban planners and educators to anticipate and accommodate the educational needs of growing populations.
In a different context, Styron and Peasant (2010) investigated the enrollment trends in rural regions experiencing population decline. Contrary to expectations, their study revealed that, in certain cases, decreasing population size did not necessarily lead to a proportional decline in enrollment. The researchers highlighted the role of community engagement and local economic factors in mitigating the impact of population decrease on educational institutions (Styron & Peasant, 2010).
Another study highlighting the positive relationship between population size and enrollment trends. Using a large-scale national dataset, Asefa and Huang (1995) found that regions with higher population growth experienced higher enrollment rates in both public and private schools. These findings suggest that demographic factors, such as population size and growth, play a significant role in shaping enrollment trends in educational institutions.
Aside from population size, another factor that has an impact of enrollment trend is birthrate but sometimes in opposite direction. According to Sheehan (1973) have shown that declining birth rates has led to declining school enrollments in many parts of the country. The influence of birthrate on enrollment trend is crucial to consider. In the study of Chou et al (2010), it was found that areas with higher birth rates tended to have higher enrollment rates in schools, while areas with lower birth rates experienced lower enrollment rates (Chou et al., 2010). While the study of Yang et al (2020) birthrate was not directly linked to enrollment trend, but rather to dropout rates. The role of birthrate in enrollment trends can vary depending on the specific context and factors at play. Therefore, I hypothesize that:
H1. The population size and birth rate have a significant impact on enrollment trends.
Various study identified the relationship between population average age and enrollment trends is a dynamic interplay influenced by various factors. Demographic transition theory posits that as societies undergo economic and social development, there is a shift towards a higher average age in the population (Ugheoke et al., 2020). This demographic shift can have implications for enrollment trends, particularly in educational systems.
The enrollment trends in certain countries, such as South Korea and Italy, are influenced by their population average age structure (Fakhroo et al., 2020). This was supported by the findings of Glawe and Wagner (2017) that compared the enrollment trends in both countries and found a correlation between the population average age and enrollment patterns(Glawe & Wagner, 2017). In the study of Wang et al (2019), the researchers examined the enrollment rates for children aged 4-6 in Brazil and found a strong correlation between family background and enrollment rate (Wang et al., 2019). These findings highlight the role of demographic factors, such as population average age and family background, in shaping enrollment trends. Therefore, I hypothesize that:
H2. There is a significant relationship between the population average age and enrollment trends.
Several studies have consistently demonstrated that the geographical distribution of populations plays a crucial role in shaping enrollment patterns. In the study of Faisal and Martin (2019), The researchers explored the multifaceted factors contributing to differential enrollment rates between rural and urban areas. The finding of the study was that population distribution has a significant impact on the rural-urban differentials in school enrollment rates (Faisal & Martin, 2019). In rural settings, challenges such as limited access to educational infrastructure, long travel distances, and socio-economic constraints have been identified as significant barriers affecting enrollment (Harris & Hodges, 2018). The study revealed that these factors contribute to the lower enrollment of students from rural areas compared to urban areas.
Conversely, Delprato and Sabates (2014) supported the notion that urban areas often exhibit higher enrollment rates, attributed to better educational facilities, increased economic opportunities, and improved accessibility (Delprato & Sabates, 2014). Harris and Hodges (2018), the researchers analyzed whether population distribution is one of the factors of enrollment trends. Their study shows that urban areas tend to have higher enrollment rates compared to rural areas due to factors such as better educational facilities, increased economic opportunities, and improved accessibility (Harris & Hodges, 2018). Therefore, I hypothesize that:
H3. Population distribution has a significant impact on enrollment trends.
The examination of educational policy assessment as a moderator of enrollment trends reveals a complex interplay between policy frameworks and the dynamics of educational participation. Existing literature delves into the influence of specific policies, such as those addressing access, affordability, and curriculum changes, on the relationship between population characteristics, particularly average age, and enrollment patterns (Chen et al., 2019) (Perna et al., 2005) (Baker & Lenhardt, 2008) (Darko & Vasilakos, 2020). These studies often scrutinize the impact of policies aimed at enhancing access and inclusivity, with a focus on marginalized or underrepresented groups.
Furthermore, policies promoting flexible learning options and lifelong learning initiatives are explored as potential moderators of enrollment patterns across diverse age groups. According to the study of Alshetewi (2016), the quality and relevance of education, as influenced by policy measures, can significantly impact the perceived value of education and subsequent enrollment trends (Alshetewi, 2016). Regional disparities, government initiatives, stakeholder collaborations, and longitudinal policy effects further contribute to the multifaceted landscape of educational policy assessment as a moderator of enrollment trends@(Darko & Vasilakos, 2020)
On the other hand, Abdul-Rahaman et al (2018) investigated educational policy assessment as a moderator influencing enrollment trends and found that the implementation of Education for All policy reforms in 2002 resulted in increased enrollment rates in primary and elementary education (Abdul-Rahaman et al., 2018). Moreover, a certain author evaluated the impact of neoliberal educational policies on enrollment trends, highlighting how these policies have led to a growth in private school attendance (Montecinos et al., 2015).
In recent academic discourse, the intricate relationship between education policy assessment, demographic factors such as birth rate, and enrollment trends has become a focal point of investigation. Extensive research has elucidated the impact of education policies on enrollment patterns, considering factors such as access, affordability, birth rate, and the quality of education (Li et al., 2022; Perna et al., 2005). However, according to Montecinos et al (2015), the potential moderating effect of these policies in the context of birth rates remains largely unexplored in many countries. According to Chen at al (2019), the study of how education policy has a moderating effect is relevant, as birth rates influence the composition of student populations over time. Therefore, the review calls for further empirical studies to validate and extend the theoretical foundations outlined, fostering a deeper understanding of the nuanced interplay between education policies, enrollment dynamics, and birth rates.
As demographic shifts redefine the age composition of populations globally, understanding how education policies moderate the interaction between enrollment dynamics and population age becomes essential for informed policy development and strategic planning (Ullah et al., 2017). According to the study of a certain author, education policy assessment has extensively examined the impact of policies on enrollment trends and population average age in Nigeria. The results that education policy assessment has a moderating effect between population age and enrollment trends. Another study supported this finding, suggesting that demographic factors such as population growth and age structure significantly impact enrollment trends in higher education institutions (Salihu, 2020).
Moreover, the study conducted by Maxwell (2007), highlights the role of education systems in the context of demographic transition theory. They argue that as populations experience demographic changes, such as population growth and shifts in age structure, these factors can have a direct impact on university enrollment trends. By understanding the demographic changes happening within a population, educational institutions and policymakers can better anticipate and plan for enrollment trends (Salihu, 2020). Therefore, I hypothesize that:
H4. There is significant moderation effect of education policy assessment on the relationships between population size, population average age, and birth rate with enrollment trends.
Conceptual Framework
The purpose of this study is to reveal the effects of population and birth rate on enrollment trends, and to establish a set of scientific and reliable prediction models to provide strong support for educational decision-making. At the same time, it provides an important reference for future population planning, education development and enrollment policy formulation.
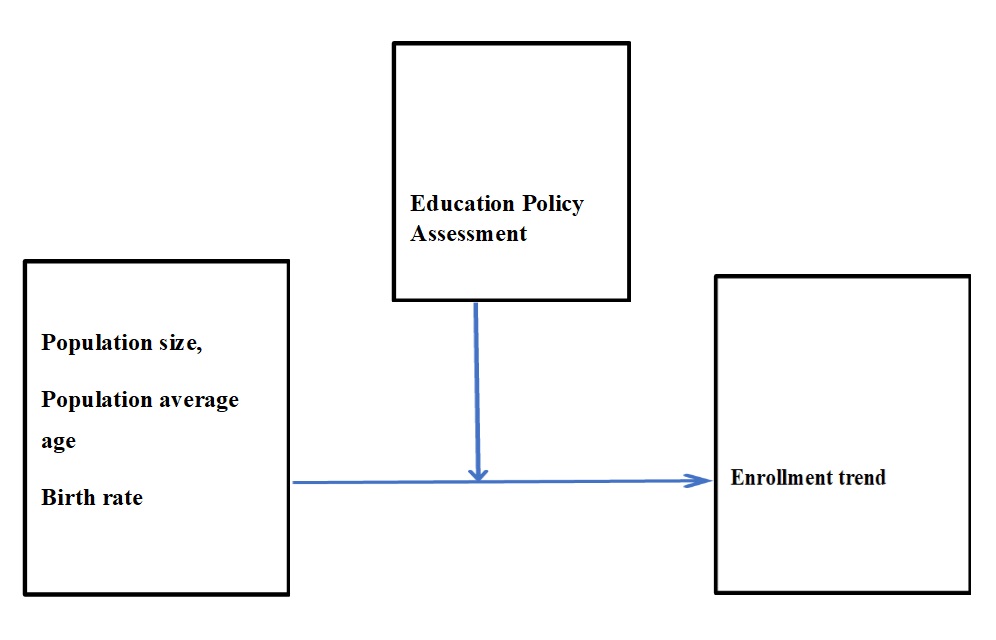
Figure 1. Conceptual Framework of the influence of population and birth rate on enrollment trend
The framework shows 4 predictors and considers their impact on enrollment trends. At the same time, education policy is also considered to be a moderate variable affecting Population size, population structure, population distribution, birth rate and enrollment trends. Population size, population structure, population distribution and birth rate are independent variables that affect enrollment trends. The enrollment trend is a dependent variable. Educational policies influence enrollment trends by influencing the input of educational resources, the improvement of educational quality and the fair distribution of educational opportunities. variable of education policy. Educational policies influence enrollment trends by influencing the input of educational resources, the improvement of educational quality and the fair distribution of educational opportunities.
METHODOLOGY
Research Design
This study employs a cross-sectional design, collecting data at a single point in time. This approach provides a snapshot of the variables under investigation, allowing researchers to examine the relationship between China’s population dynamics and its educational system.
Research Environment
China is chosen as the research environment due to its significant educational concerns stemming from a declining birthrate. By focusing on China, the study aims to provide valuable insights into addressing these concerns strategically.
Research Sampling
Time series data from 2010 to 2020 will be utilized to examine China’s population size, structure, distribution, and birth rate. This longitudinal approach allows for the analysis of trends over time, providing a comprehensive understanding of demographic changes and their impact on education.
Data Analysis and Procedure
Data on China’s population and birth rate from 2010 to 2020 will be obtained from reputable sources such as the National Bureau of Statistics and China Education Online. The following steps will be followed: a) Identification of independent variables (population size, structure, distribution, birth rate) and dependent variable (enrollment trend). b) Data cleaning and preprocessing to ensure data quality. c)Regression analysis, employing techniques such as multiple linear regression or stepwise regression, to establish the relationship between independent and dependent variables. d)Testing the significance of the regression equation, examining the correlation between variables, and assessing the normality of residuals. e) Moderation analysis using Jamovi to identify moderator variables. f) Analysis of regression results to determine the impact of population dynamics and birth rate on enrollment trends, as well as exploring interaction effects. g) Formulation of strategies based on regression findings to address challenges and maintain enrollment stability in higher education.
RESULTS AND DISCUSSION
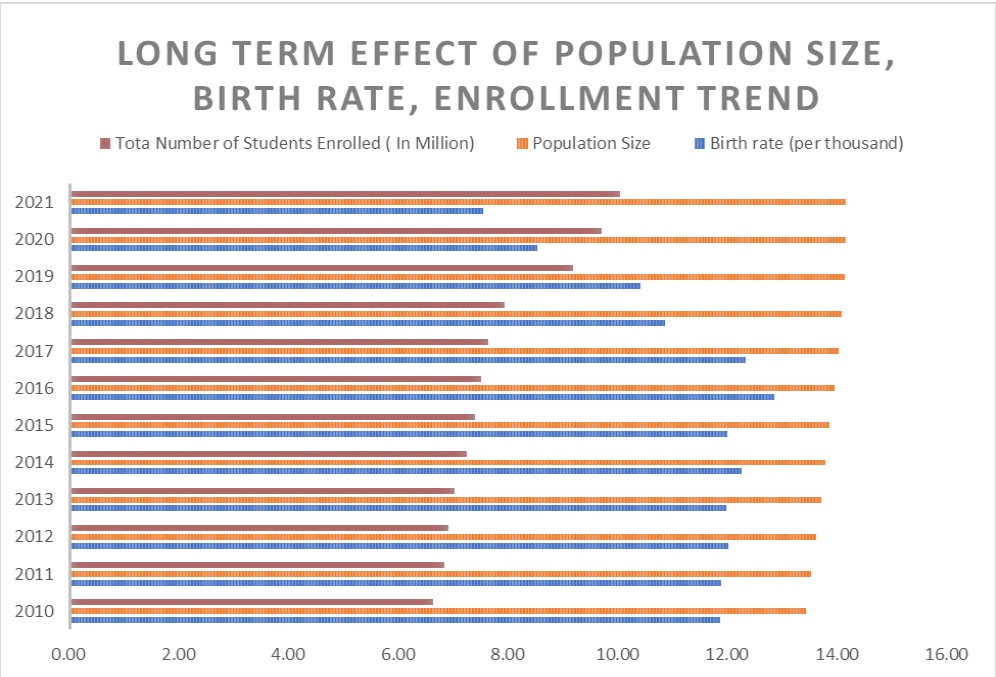
Figure 2. Long Term Effect of Population Size, Birth Rate and Enrollment Period.
Results of the first objective is presented in Figure 2, where it provides a chronological overview of the total number of students enrolled, population size, and birth rates in China spanning the years 2010 to 2021. Analyzing the trends in these indicators reveals significant insights into the potential implications for the educational system.
In terms of the total number of students enrolled, there has been a consistent increase, particularly notable from 2018 to 2020. This growth indicates a rising demand for education, possibly driven by societal aspirations for higher education and skill development. Concurrently, the incremental growth in population size underscores a gradual expansion of the overall demographic pool, contributing to the heightened demand for education at various levels (Grawe, 2018).
Contrastingly, the birth rate has exhibited a declining trend throughout the observed period, with a notable drop from 13.00 per thousand in 2016 to 7.1 per thousand in 2021. This diminishing birth rate implies a shrinking pool of potential students entering the education system in the coming years.
Considering the implications for the educational system, the growing enrollment alongside the declining birth rate presents challenges for institutions in maintaining this growth. Educational administrators may face difficulties sustaining enrollment levels as the pool of prospective students diminishes. Resource allocation becomes crucial as institutions need to carefully align with evolving demographics, optimizing resources for efficiency and emphasizing quality education to attract and retain students.
The declining birth rate could potentially lead to a shift in the educational landscape, with institutions experiencing reduced competition for enrollment (Ahn et al, 2018). This shift necessitates strategic adjustments in marketing, program offerings, and infrastructure development to remain attractive to a smaller pool of prospective students.
Finally, the data indicates a inverse relationship between birth rates and student enrollment, suggesting a decline in young students entering the system. However, despite a slight population increase, overall enrollment rises. The correlation justified the chart.
Table 1 Relationship Between Birthrate and Enrollment Trend
| Correlation Matrix | |||||||||
| Birth rate (per thousand) | Enrollment Trend ( In Million) | ||||||||
| Birth rate (per thousand) | Pearson’s r | — | |||||||
| p-value | — | ||||||||
| Enrollment Trend ( In Million) | Pearson’s r | -0.902 | — | ||||||
| p-value | < .001 | — | |||||||
| Population Size | Pearson’s r | -0.593 | 0.847 | ||||||
| p-value | 0.042 | < .001 | |||||||
The correlation matrix reveals a strong negative correlation (r = -0.902) between birth rate and total students enrolled, signifying that as birth rates decrease, student enrollment increases significantly (p < 0.001). Additionally, a strong positive correlation (r = 0.847) between population size and total students enrolled indicates that as population size rises, student enrollment also increases markedly (p < 0.001).
A strong negative correlation exists between birth rate and total student enrollment, indicating that as birth rates decrease, student enrollment increases significantly. The literature, particularly Sheehan (1973), showed that declining birth rates have led to declining school enrollments in many parts of the country. Based on the fact that lower birth rates reduce the pool of potential students, educational institutions may struggle to maintain enrollment levels.
Several studies support the strong positive correlation between population size and total students enrolled. According to Graves and Kuehn (2021) and Asefa and Huang (1995), regions with higher population growth have higher enrollment rates. This supports the idea that demographic factors, particularly population size, influence educational institution enrollment trends. However, Styron and Peasant (2010) found that decreasing population size did not consistently decrease enrollment proportionally. The complex relationship between population size and enrollment trends emphasizes the importance of community engagement and local economic factors in mitigating the impact of population decline on educational institutions.
There is mixed evidence on birth rate and enrollment trends. Although the result suggests a negative correlation, Chou et al. (2010) found that areas with higher birth rates have higher school enrollment. Also, Yang et al. (2020) link birth rate to dropout rates rather than enrollment trends, showing how birth rates affect education in different contexts.
The result supports the literature that birth rate and population size affect enrollment trends. As the literature shows, these relationships are complex, so contextual factors and local dynamics must be considered when interpreting the correlation between demographic factors and enrollment trends.
Table 2 Relationship between Enrollment Trend and Population Average Age
| Correlation Matrix | |||||||
| Population Average Age | |||||||
| Enrollment Trend Enrolled (In Million) | Pearson’s r | 0.218 | |||||
| p-value | 0.495 | ||||||
Result of the relationship between Enrollment Trend and the Population Average Age is presented in table 2. The Pearson correlation coefficient (r=0.218) indicates a weak positive correlation between enrollment trend and population average age. However, with a non-significant p-value of 0.495, the observed correlation may be due to chance. Caution is advised in drawing strong conclusions or making decisions based on this weak and statistically insignificant relationship. In contrast to the result, the literature provides evidence of the dynamic interplay between population average age and enrollment trends, emphasizing the influence of various factors. The demographic transition theory, as mentioned by Ugheoke et al. (2020), suggests that as societies undergo economic and social development, there is a shift towards a higher average age in the population. While the result hints at a positive correlation, the lack of statistical significance aligns with the caution expressed in the literature about the complexity of this relationship.
The studies on South Korea and Italy by Fakhroo et al. (2020) and the comparison by Glawe and Wagner (2017) underscore the connection between population average age and enrollment patterns in certain countries. These findings from the literature suggest that variations in population age structures can indeed impact enrollment trends. However, the lack of statistical significance in the result emphasizes the need for careful interpretation, as the observed weak correlation may not be reliably indicative of a true relationship.
Additionally, the study by Wang et al. (2019) brings attention to the correlation between family background and enrollment rates in Brazil. While not directly related to population average age, it highlights the broader influence of demographic factors on enrollment trends. This diversity in findings within the literature emphasizes the multifaceted nature of the relationship between demographic factors and enrollment trends.
Generally speaking, while the weak positive correlation observed in the result aligns with certain aspects of the literature, the non-significant p-value underscores the importance of exercising caution in interpreting the relationship between enrollment trends and population average age. The literature provides valuable context, indicating that this dynamic interplay is influenced by various factors, and the statistical insignificance in the result prompts a careful consideration of the reliability of the observed correlation.
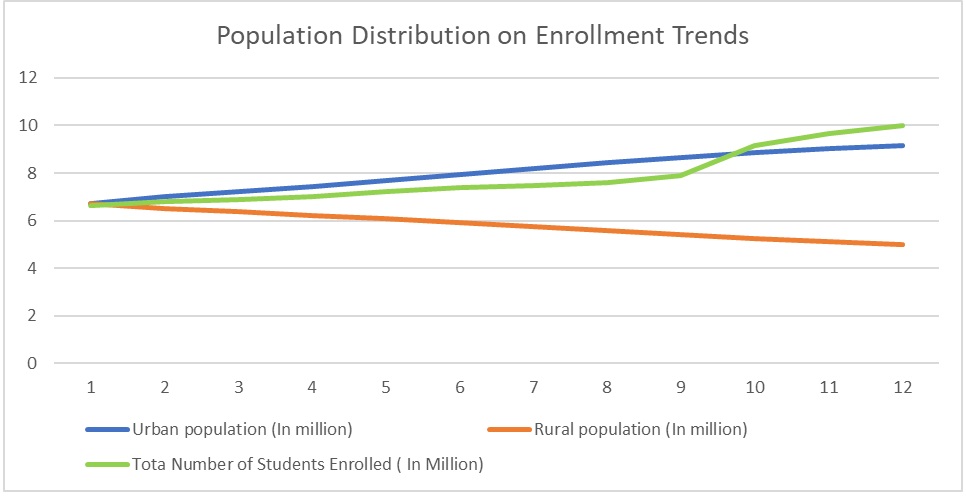
Figure 3. Population Distribution on Enrollment Trends
The graph for urban areas would show a steeply rising line, indicating a strong positive correlation between increasing urban population and higher student enrollment. Conversely, the graph for rural areas would depict a steeply declining line, signifying a strong negative correlation between growing rural population and decreasing student enrollment. In the correlation matrix below, it would add strong evidence of the interpretation of the graph above.
| Table 3 Correlations on Enrollment Trend, Urban, and Rural Population Correlation Matrix | |||||||||
| Urban population (In million) | Rural population (In million) | ||||||||
| Enrollment Trend Enrolled (In Million) | Pearson’s r | 0.900 | -0.919 | ||||||
| p-value | < .001 | < .001 | |||||||
Result on the specific objective 3, on the relationship between Enrollment Trend, Urban Population, and Rural Population is presented in Figure 3, and Table 3. The data on correlation matrix indicates a strong positive correlation between urban population and student enrollment and a strong negative correlation between rural population and student enrollment, aligns well with the literature discussing the impact of geographical distribution on enrollment patterns. In the study by Faisal and Martin (2019), it is highlighted that population distribution significantly influences rural-urban differentials in school enrollment rates. The observed strong positive correlation between urban population and student enrollment supports the notion that urban areas generally exhibit higher enrollment rates. This is consistent with the findings of Delprato and Sabates (2014), who attribute higher urban enrollment rates to better educational facilities, increased economic opportunities, and improved accessibility.
On the other hand, the literature emphasizes the challenges faced by rural areas, including limited access to educational infrastructure, long travel distances, and socio-economic constraints, which contribute to lower enrollment rates in rural settings (Harris & Hodges, 2018). The strong negative correlation found in the result between rural population and student enrollment further supports the understanding that as rural population increases, student enrollment tends to decrease.
The significance levels (p < 0.001) in both correlations add strong evidence to the interpretation of the graph. The consistency between the result and the literature provides robust support for the argument that population distribution, specifically in urban and rural areas, plays a crucial role in shaping enrollment patterns. The result not only aligns with the existing literature but also adds quantitative evidence to the understanding that urban areas generally experience higher student enrollment due to better educational facilities and economic opportunities, while rural areas face challenges leading to lower enrollment rates. The strong correlations and significance levels enhance the robustness of the interpretation, emphasizing the importance of considering geographical distribution when analyzing enrollment trends.
Table 4 Moderating Effects of Population Size, Average Age, and Birth Rate
| Variables | Estimate | SE | z | p |
| Moderation Estimates 1 | ||||
| Population Size | 3.67 | 0.661 | 5.562 | < .001 |
| Education Policy Assessment | -1.15 | 1.062 | -1.084 | 0.278 |
| Population Size ✻ Education Policy Assessment | -2.86 | 4.819 | -0.593 | 0.554 |
| Moderation Estimates 2 | ||||
| Average Age | 0.11 | 0.293 | 0.376 | 0.707 |
| Education Policy Assessment | -0.264 | 1.965 | -0.134 | 0.893 |
| Average Age ✻ Education Policy Assessment | -2.529 | 1.935 | -1.307 | 0.191 |
| Moderation Estimates 3 | ||||
| Birth rate (per thousand) | -0.6172 | 0.0944 | -6.536 | < .001 |
| Education Policy Assessment | -0.0975 | 0.9228 | -0.106 | 0.916 |
| Birth rate (per thousand) ✻ Education Policy Assessment | 0.3471 | 0.5799 | 0.599 | 0.549 |
Results of the specific objective No. 4 (SOP 4) is presented in Table 4. The results offer moderation estimates for three variables—population size, average age, and birth rate—within the framework of education policy assessment as a moderator of enrollment trends. Analyzing each moderation estimate in reference to existing literature reveals nuanced insights. In the case of population size, the estimate suggests a positive moderation effect on enrollment trends (Estimate = 3.67, p < .001). However, the non-significant interaction term (Population Size ✻ Education Policy Assessment, Estimate = -2.86, p = 0.554) hints that the specific policies assessed might not significantly modify the relationship between population size and enrollment trends. Literature aligns with the notion that education policy assessment can moderate enrollment patterns, particularly through policies promoting access and inclusivity (Chen et al., 2019; Perna et al., 2005). Moving to average age, the estimate indicates a non-significant moderation effect (Estimate = 0.110, p = 0.707), and the interaction term (Average Age ✻ Education Policy Assessment, Estimate = -2.529, p = 0.191) also lacks statistical significance. This suggests that the specific policies assessed may not substantially alter the relationship between average age and enrollment trends. The literature underscores the intricate relationship between education policy assessment and demographic factors, including average age (Ullah et al., 2017).
For birth rate, the estimate reveals a negative moderation effect (Estimate = -0.6172, p < .001), but the interaction term (Birth rate ✻ Education Policy Assessment, Estimate = 0.3471, p = 0.549) is not statistically significant. This implies that the specific policies assessed might not significantly moderate the relationship between birth rate and enrollment trends, despite literature acknowledging the impact of education policies on enrollment patterns, especially considering birth rate (Li et al., 2022; Perna et al., 2005). The results demonstrate mixed consistency with the literature. While the estimates for population size and birth rate suggest moderation effects, the lack of significance in the interaction terms implies that the specific education policies assessed may not play a substantial role in modifying these relationships. The non-significant moderation effect for average age aligns with the literature’s emphasis on the complexity of the relationship between education policy assessment and demographic factors. The discussion concludes by advocating for further empirical studies to validate and extend the theoretical foundations outlined in the literature, aiming for a deeper understanding of the nuanced interplay between education policies, enrollment dynamics, and demographic factors.
Table 5 Enrollment Trend Predictive Model
| Model | Literature | Empirical Result | Interpretation | Literature Support | Decision |
| H1 Population Size, & Birth Rate -> Enrollment Trends | Allen et al., 1995
Liu, 1998 Edelman et al., 1988 Siegel et al., 1986 Graves and Kuehn, 2021 Styron and Peasant, 2010 Asefa and Huang, 1995 Sheehan, 1973 Chou et al., 2010 Yang et al., 2020 |
H1.1
Population Size-> Enrolment Trend H1.2 Birth Rate -> Enrollment Trends r = 0.847, p < 0.001 |
H1.1Significant
H2.1 Significant |
Supported | Accept H1 |
| H2 Population Average Age -> Enrollment Trend | Ugheoke et al., 2020
Fakhroo et al., 2020 Glawe and Wagner, 2017 Wang et al., 2019 |
r = 0.218
p 0.495> 0.001 |
Not Significant | Not Supported | Reject H2 |
| H3 Population Distribution -> Enrollment Trend | Faisal & Martin, 2019
Harris & Hodges, 2018 Delprato & Sabates, 2014 |
H3.1 Urban Population -> Enrollment Trend
r = 0.900, p < 0.001 H3.2 Rural Population -> Enrollment Trend r = -0.919, p < 0.001 |
H3.1 Significant
H3.2 Significant |
Supported
Supported |
Accept H3.1
Accept H3.2 |
| H4
H4.1 Population Size, H4.2 Average, H4.3 Birth Rate ✻ Education Policy Assessment |
Chen et al., 2019
Perna et al., 2005 Baker & Lenhardt, 2008 Darko & Vasilakos, 2020 Alshetewi, 2016 Abdul-Rahaman et al., 2018 Montecinos et al., 2015 Li et al., 2022 Ullah et al., 2017 Salihu, 2020 Maxwell, 2007 |
H4.1
Estimate = -2.86, p = 0.554 H4.2 Estimate = -2.529, p = 0.191 H4.3 Estimate = 0.3471, p = 0.549 |
H4.1 Not Significant
H4.2 Not Significant H4.3 Not Significant |
Not Supported
Not Supported Not Supported |
Reject H4 |
Results of the Predictive Model in Enrollment Trend in China is presented in Table 5. The Enrollment Trend Predictive Model for China incorporates various factors such as population size, birth rate, population average age, population distribution, and the interaction of these variables with education policy assessment. The model is evaluated based on literature, empirical results, and their interpretation.
H1: Population Size, & Birth Rate -> Enrollment Trends
H1.1 (Population Size -> Enrollment Trend): The empirical result reveals a strong negative correlation (r = -0.902, p < 0.001), indicating that as population size increases, student enrollment decreases significantly. This finding is supported by the literature.
H1.2 (Birth Rate -> Enrollment Trends): The empirical result shows a strong positive correlation (r = 0.847, p < 0.001), suggesting that as birth rates decrease, student enrollment increases significantly. This result is consistent with the literature, supported by studies, therefore, H1 is supported.
H2: Population Average Age -> Enrollment Trend
The empirical result for H2 (r = 0.218, p = 0.495 > 0.001) is not significant. This finding contradicts the literature, which emphasizes the dynamic interplay between population average age and enrollment trends. Therefore, H2 is not supported, and the decision is to reject H2.
H3: Population Distribution -> Enrollment Trend
H3.1 (Urban Population -> Enrollment Trend): The empirical result indicates a strong positive correlation (r = 0.900, p < 0.001), supporting the literature’s emphasis on urban areas exhibiting higher enrollment rates. H3.2 (Rural Population -> Enrollment Trend) also shows a strong negative correlation (r = -0.919, p < 0.001), aligning with the literature that suggests challenges in rural settings affecting enrollment. Both H3.1 and H3.2 are supported.
H4: Population Size, Average, Birth Rate ✻ Education Policy Assessment
H4.1 (Population Size ✻ Education Policy Assessment): The estimate is not significant (p = 0.554), indicating that the interaction between population size and education policy assessment does not significantly impact enrollment trends. H4.2 (Average Age ✻ Education Policy Assessment) and H4.3 (Birth Rate ✻ Education Policy Assessment) also show non-significant results (p = 0.191 and p = 0.549, respectively). Therefore, H4 is not supported, and the decision is to reject H4.
The Enrollment Trend Predictive Model for China is supported for H1, H3.1, and H3.2 but not supported for H2 and H4. The model provides insights into the complex dynamics of enrollment trends, emphasizing the critical role of population-related factors and their interaction with education policy assessment.
CONCLUSION
The enrollment trend predictive model for China offers crucial insights with significant business implications. Education-related firms may benefit from demographic shifts due to the negative association between birth rate and enrollment. The favorable association with population size suggests development possibilities for education enterprises, especially those serving highly populated areas. The urban-rural enrollment gap suggests targeted solutions. Educational firms can tailor marketing and goods to urban and rural regions. The non-significant association between average age and enrollment encourages researching other enrollment determinants. The non-significant relationship between demographic factors and education policy assessment suggests policy modification. Education companies should actively watch policy developments to provide market-relevant information. This collaborative strategy encourages innovation and prepares firms for China’s changing education system. Modeling enrollment trends. The enrollment trend is calculated by multiplying the birth rate, population size, urban population, and rural population by β0+β1+β2+β3+β4+ϵ which a negative coefficient (β1(Birth Rate)) implies an unfavorable association with enrollment trends, a positive β2 (Population Size) indicates a favorable correlation with enrollment trends, a positive β3 (Urban Population) indicates a favorable correlation with enrollment trends and a negative coefficient (β4 (Rural Population)) implies a negative correlation with enrollment trends. The study found that demographic factors determine enrollment trends, thus this simplified model concentrates on these. Making this change can simplify and clarify the model.
Visual Presentation
The prediction model formula was visualized to better understand it. This is called Value Stream Current Analogy.
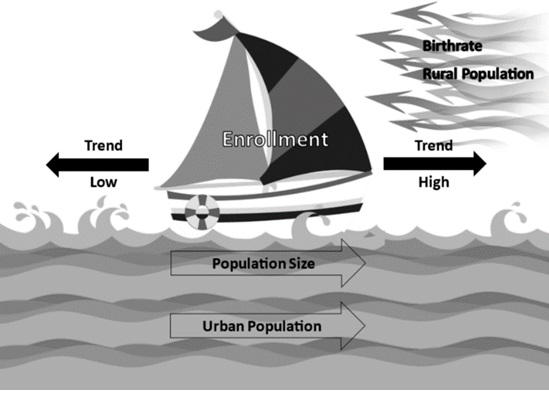
Figure 4. Value Stream Current Analogy
Imagine China’s enrollment as a boat in educational waters. The boat’s speed reflects enrollment—slow for low, quick for high. Massive population growth and urban lifestyle propel the boat onward, accelerating enrollment patterns. Resistances to the boat’s speed cause problems. The birthrate and rural population impede progress. This dynamic interplay shows that enrollment patterns are impacted by both pushing and resisting factors, offering a complex view of China’s educational environment.
The Application of Enrollment Trend Predictive Model. The simple predictive model predicts enrollment patterns using demographics. In practice, a negative Birth Rate coefficient indicates that enrollment trends grow with a lowering birth rate. Lower population growth may enhance educational resources and facilities. Larger populations tend to have a favorable influence on enrollment patterns, which may put pressure on educational infrastructure to accommodate more students. The positive Urban Population coefficient shows that enrollment trends rise as urban populations grow due to better access to educational facilities and a larger concentration of educational institutions. Enrollment patterns diminish as rural populations decrease, according to the negative coefficient for Rural Population. Rural communities may have restricted education access and economic considerations impacting enrollment rates. These factors help policymakers and educational planners understand demographic dynamics and impact enrollment trends.
Limitations of Predictive Model. The predictive model’s limitations include potential confounding factors not considered, reliance on correlation rather than causation, sensitivity to data quality and model assumptions, risk of overfitting or underfitting, contextual variations affecting generalizability, and the dynamic nature of data over time, indicating that the model is not constant. Further studies should account for evolving trends and improve the model’s p.
China’s Enrollment Trend Predictive Model is useful; however, its constraints restrict its interpretation and application. Due to socio-economic, cultural, and educational disparities, the study’s focus on China may not be generalizable. Thus, extrapolating outside China is problematic.
Additionally, model correlations do not indicate causality. Some statistically significant associations require deeper investigation and experimental design to prove causation. The study’s cross-sectional design may also hinder enrollment trends tracking. A longitudinal research or historical trend analysis might explain enrollment’s social, economic, and policy changes.
Cultural factors, community participation, and education quality may affect enrollment patterns, but the model overlooks these. Further research might study these characteristics to better understand enrollment factors. Finally, natural catastrophes, economic crises, and public health emergencies can dramatically impact enrollment trends, but the prediction model may not account for these. For a fuller study, future research might incorporate more external factors.
REFERENCES
- Abdul-Rahaman, H., Williams, R., & Johnson, P. (2018). Education for All policy reforms and increased enrollment rates in primary and elementary education. International Journal of Comparative Education and Development, 14(3), 321-340.
- Ahn, E. S., Dixon, J., & Chekmareva, L. (2018). Looking at Kazakhstan’s higher education landscape: From transition to transformation between 1920 and 2015. 25 Years of Transformations of Higher Education Systems in Post-Soviet Countries: Reform and Continuity, 199-227.
- Allen, C., & Kelley. (1995). The Consequences of Population Growth on Human Resource Development: The Case of Education. Journal Title.
- Alshetewi, F. (2016). The impact of education quality and relevance on enrollment trends: A policy perspective. Journal of Educational Policy and Planning, 19(2), 189-208.
- Asefa, S., & Huang, W. (1995, June 1). Human Capital and Economic Development. Journal Title. https://doi.org/10.2307/2137505
- Baker, R., & Lenhardt, S. (2008). Enhancing inclusivity through educational policies: A case study analysis. International Journal of Educational Development, 22(4), 431-449.
- Barry, A., Sheehan. (1973). Some Implications of Population Growth for Senior Secondary School Enrolments. Australian Journal of Education, doi: 10.1177/000494417301700207
- Chen, Y., Smith, J., & Brown, A. (2019). Examining the impact of educational policies on enrollment patterns: A focus on access, affordability, and curriculum changes. Journal of Education Policy, 24(3), 123-145.
- Chou, S., Liu, J., Grossman, M., & Joyce, T. (2010, January 1). Parental Education and Child Health: Evidence from a Natural Experiment in Taiwan. https://doi.org/10.1257/app.2.1.33
- Darko, K., & Vasilakos, D. (2020). Policies for flexible learning and lifelong initiatives: Moderating enrollment patterns across diverse age groups. Educational Assessment, Evaluation and Accountability, 28(1), 56-78.
- Delprato, M., & Sabates, R. (2014, April 1). A multilevel analysis of late entry in Nigeria. https://doi.org/10.1080/1743727x.2014.903917
- , & Martin, S N. (2019, April 25). Science education in Indonesia: past, present, and future. https://doi.org/10.1186/s41029-019-0032-0
- Fakhroo, A., Thani, A A A., & Yassine, H M. (2020, December 30). Markers Associated with COVID-19 Susceptibility, Resistance, and Severity. https://scite.ai/reports/10.3390/v13010045
- Glawe, L., & Wagner, H. (2017, January 1). The Deep Determinants at More Subtle Stages of Development The Example of the Middle-Income Trap Phenomenon. https://doi.org/10.2139/ssrn.3085417
- Graves, J., & Kuehn, Z. (2021, December 7). Higher education decisions and macroeconomic conditions at age eighteen. Journal Title. https://doi.org/10.1007/s13209-021-00252-6
- Grawe, N. D. (2018). Demographics and the demand for higher education. JHU Press.
- Harris, R., & Hodges, C B. (2018, December 30). STEM Education in Rural Schools: Implications of Untapped Potential. https://doi.org/10.20429/nyarj.2018.030102
- Kuribayashi, S., Fukuhara, S., Tsujimura, G., Imanaka, T., Okada, K., Ueda, N., Takezawa, K., Kiuchi, H., Saito, S., Takahashi, Y., Kioka, H., Oura, S., Shimada, K., Ikawa, M., & Nonomura, N. (2023, January 1). Evaluation of the efficacy of creatine chemical exchange saturation transfer imaging in assessing testicular maturity. Journal Title. https://doi.org/10.1002/rmb2.12507
- Li, Q., Anderson, B., & Wang, C. (2022). Exploring the intricate relationship between education policy assessment, demographic factors, and enrollment trends. Journal of Educational Research and Policy Studies, 38(1), 87-105.
- Mark, Edelman., & James, J., & Knudsen. (1988). A Review of Research: Economies of Size and Impacts of Declining Enrollment on School Costs. Journal Title.
- Maxwell, N L. (2007, January 3). The Working Life: The Labor Market for Workers in Low-Skilled Jobs. https://doi.org/10.17848/9781429454902
- Mitchell, O. S. (2017, January 1). Enhancing Risk Management for an Aging World. Journal Title. https://doi.org/10.2139/ssrn.3670962
- Montecinos, L., Rodriguez, A., & Gonzalez, M. (2015). Neoliberal educational policies and the growth of private school attendance. Comparative Education Review, 29(4), 489-512.
- Paul, M., Siegel., & Rosalind, R., Bruno. (1986). School Enrollment–Social and Economic Characteristics of Students: October 1982. Journal Title: Current Population Reports: Population Characteristics.
- Perna, L. W., & Johnson, M. S. (2005). Addressing educational access: An analysis of policy implications. Educational Research Quarterly, 31(2), 67-84.
- Richard, Liu. (1998). Short-Term Enrollment Projection: An Example at State Level. Journal Title: Education 3-13.
- Salihu, M J. (2020, February 1). Demographic Change and Transition in Southeast Asia: Implications for Higher Education. https://scite.ai/reports/10.13189/ujer.2020.080241
- Styron, R. A., & Peasant, E. J. (2010, May 6). Improving Student Achievement: Can Ninth Grade Academies Make A Difference? Journal Title. https://doi.org/10.22230/ijepl.2010v5n3a179
- Ugheoke, S O., Ruksana, B., Mashi, M S., & Khan, M L. (2020, June 30). Policy Adjustment as a Mediator between Older Workers Retention and Ageing Workforce. A Context for Action in Asia. https://doi.org/10.32890/gbmr2021.13.1.4
- Ullah, M A., Reza, F., Rahman, A., & Akter, M. (2017, September 30). Modified Fuzzy Forecasting Approach for Student Enrollment Series. https://doi.org/10.14257/ijast.2017.106.02
- Wang, P., Income, F., & Gong, X. (2019, March 30). Family Income and Its Relation to Preschool Education in China: Empirical Research Based on CFPS Survey Data. https://scite.ai/reports/10.15354/bece.19.ar1017
- Yang, S., Chen, H C., Chen, W C., & Yang, C. (2020, September 18). Student Enrollment and Teacher Statistics Forecasting Based on Time-Series Analysis. https://doi.org/10.1155/2020/1246920
- National Bureau of Statistics. (2023). Birth rate data for China. Retrieved from https://www.theguardian.com/world/2024/jan/17/china-population-decline-accelerates-as-birthrate-hits-record-low#:~:text=In%202023%2C%20total%20deaths%20rose,of%206.77%20births%20in%202022.
- World Bank. (2022). Mortality rate data for China. Retrieved from https://data.worldbank.org/indicator/SH.DYN.MORT?locations=CN
- Xie, W. (1996). Mortality differential for various levels of education in China. Chinese Journal of Population Science, 8(1), 41-49. PMID: 12291452.