
Postharvest Quality of Lettuce (Lactuca Sativa L.) as Influenced by Salinity Stress
- Lacostales, Leonardo E.
- Lacostales, Janeth L
- 237-245
- May 1, 2024
- Agriculture
Postharvest Quality of Lettuce (Lactuca Sativa L.) as Influenced by Salinity Stress
Lacostales, Leonardo E.1 and Lacostales, Janeth L.2
1Bachelor of Science in Agriculture Department, Carcar City College, Cebu, Philippines
2College of Agriculture, Food Science, Business and Communication; Cebu Technological University-Barili Campus, Cebu, Philippines
DOI: https://doi.org/10.51244/IJRSI.2024.1104018
Received: 06 February 2024; Accepted: 01 March 2024; Published: 01 May 2024
ABSTRACT
Salinity is one of the abiotic stresses and one of the major constraints to plant growth, development, productivity, postharvest quality, and nutrition. Plant responses to high salinity affects its morphological and developmental aspects of growth as well as its physiological and biochemical processes. Lettuce is an important crop for human diet; however, it is moderately sensitive to salinity stress. Hence, this study was conducted to examine the response of lettuce to different salinity levels. The study was laid out in Randomized Complete Block Design (RCBD) replicated three times with five sodium chloride (NaCl) concentrations as treatments. This includes the control (water); 500 parts/million (ppm); 1,000 ppm; 5,000 ppm; and10,000 ppm. Results show that salinity stress did not significantly influence on yield, leaf moisture content, color deterioration, percent weight loss, wilting, texture, and Visual Quality Rating (VQR) of harvested lettuce. Furthermore, it also did not significantly influence on some biochemical properties specifically on initial pH and initial titratable acidity (TA), final total soluble solids (TSS) and TA, leaf chlorophyll, sugar, and starch content. Lettuce planted on potting media with various levels of salinity during it growth and development until harvesting significantly obtained a significantly lower initial TSS during postharvest analysis than those lettuce planted in potting media without any added salt content. Therefore, lettuce can still survive when planted in soil containing up to 10,000 ppm NaCl without impairing its growth, yield, physical characteristics, and some biochemical properties of harvested lettuce specifically on TA, chlorophyll, sugar, and starch content.
Keywords: abiotic stress, salinity, lettuce, tolerance
INTRODUCTION
Abiotic stressors such as drought, waterlogging, intense and/or low temperatures, cold, and saline conditions are the main factors limiting crop productivity and causing crop losses, particularly in terms of lower average yields (Tuteja et al., 2012).The most significant environmental stressor that has an important impact on the growth and development, nutrition, and production of many plant species is excessive salinity (Sayed, 2003). Soil salinity denotes high concentration of soluble salts in the root zone’s soil moisture and because of their high osmotic pressures, these concentrations limit the amount of water that roots can absorb, which has an impact on plant growth (Tester and Devenport, 2003).Thus, limiting the growth and spread of plants in their normal environments (Shanon, 1986).Plants have diverse and complex response to excessive salinity that results to the modifications to plants’ morphological and developmental activities as well as its physiological and biochemical changes (Khan et al., 2010). In a morphological standpoint, the most commonindication of salt injury to plants is stunted growth (Jaleel et al., 2008), which is a result of some physiological processes including changes of ion balance, water content, plant mineral nutrition, photosynthetic efficacy, carbon allocation and consumption, membrane instability, and failure in the maintenance of turgidity (Yildirim et al., 2006).Lettuce is one of the crops that is moderately sensitive to salinity (Maas and Hoffman, 1977; Tesi et al., 2003).
Andriolo et al. (2005) examined the effects of increasing salinity levels of irrigation water (0.80, 1.93, 2.81, 3.73, and 4.72 dS m–1) of lettuce in a hydroponics system. They found-out a positive effect of electrical conductivity on shoot fresh weight. Increasing the EC from 0.80 to 1.93 dS m–1 result in a 28.5% increase in shoot fresh weight, whereas increasing the EC from 1.93 to 4.72 dS m–1reduced the fresh mass by 16.5%. De Pascale and Barbieri (1995) stated that lettuce should be in the moderately salt-sensitive crop category with a threshold value of 2.7 dS m–1 and relative yield decrease slope value of 5.8%. They added that the partial effect of salinity at cellular level is due to the osmotic effects. The influence of salt concentration depends environmental variables such as water vapor pressure deficit, temperature and solar radiation, and its interactions (Yeo, 1999).Studies revealed that the shoot fresh weights, shoot dry weights, photosynthetic pigment contents, and its protein content of the harvested produce are positively and negatively affected due to the changes in water level and balancein plants that are subject to salinity (Amira and Qados, 2011). This study aimed to examine the response of potted lettuce to different salinity levels. The specific objectives were to determine the changes of yield at increasing salinity and to examine the effects of salinity to physical and chemical properties, and postharvest quality of lettuce. It is was hypothesized that there is no significant difference among treatments on the yield and postharvest quality of lettuce.
METHODOLOGY
Preparation of Experimental Area and Planting Materials
An open field pave surface area with a dimension of 5.5 by 3.5 meter (19.25 m2) was used in the experiment. The area was cleaned to free it from crops, herbs and weed debris. A soil mixture of garden soil, vermicompost and carbonized rice hull at a ratio of 1:2:1 was prepared. Sixty (60) clean perforated polyethylene plastic pots were prepared which served as growing container of the experimental plants. The brim diameter, base diameter and height were 12, 9 and 15 cm, respectively. Two (2) kilograms of soil medium in dry weight basis were placed in each polyethylene pots.
Leaf lettuce (grand rapid) seeds used in the study were bought from the local market distributor of certified seeds. For the production of seedlings, lettuce seeds were sown in a tray. The growing medium used for the seedling production were a mixture of garden soil, carbonized rice hull and vermicast at 1:2:1 ratio. Pasteurization of garden soil was done before mixing with carbonized rice hull and vermicast in order to eliminate harmful microorganisms that can cause diseases to the seedlings. After seven (7) days from seed sowing, the seedlings were pricked using pricking tray filled with sterilized mixture of garden soil, vermicast and carbonized rice hull at a ratio of 1:2:1. A starter solution was prepared by dissolving one (1) tablespoon of urea (46-0-0) in a gallon of water. Application was done by submerging the roots in a basin of fertilizer solution after the first true leaf was fully developed.
Transplanting, Preparation and Application of Treatments
After seven(7) days from pricking, the hardened seedlings were transplanted at one (1) seedling in every pot. Transplanting was done late in the afternoon to reduce the stress of the experimental plants. Planting distance was 0.25 by 0.25 meter and 0.50 meter between blocks. The amount of table salt per pot to be applied was computed by soil dry weight basis in a pot based on soil dry weight per hectare (2.0 x 10⁶ kg/ha). Table salt was diluted in separate containers by treatment concentrations required using water (Figure 1).The amount of salt solution applied per pot was 100 ml containing the amount of salt in ppm per plant bases. Application of treatments was done two weeks after transplanting. The study was laid out in RCBD with five (5) treatments replicated three (3)times with six (4) samples per replication. The treatments
are as follows:
T0 – Control (neutral, 0 g/pot)
T1 – 500 ppm NaCl (low, 0.264 g/pot)
T2 – 1,000 ppm NaCl (medium, 0.528 g/pot)
T3 – 5,000 ppm NaCl (high, 2.64 g/pot)
T4 – 10,000 ppm NaCl (very high, 5.28 g/pot)
Figure 1. Table salt (NaCl) diluted using water in separate containers by treatment concentrations
Care, Maintenance and Termination of the Study
Fertilizer application program is presented in Table 1. Watering was done regularly to maintain the moisture content of the growing medium. Trickle irrigation was used to facilitate application of water. The plants were monitored closely for any pest infestation and disease infection and appropriate integrated pest management measures were undertaken. The area was kept clean to minimize insect vectors and weeding was done as need arises. Termination of the study was done four (4) weeks from transplanting.
Data Gathered
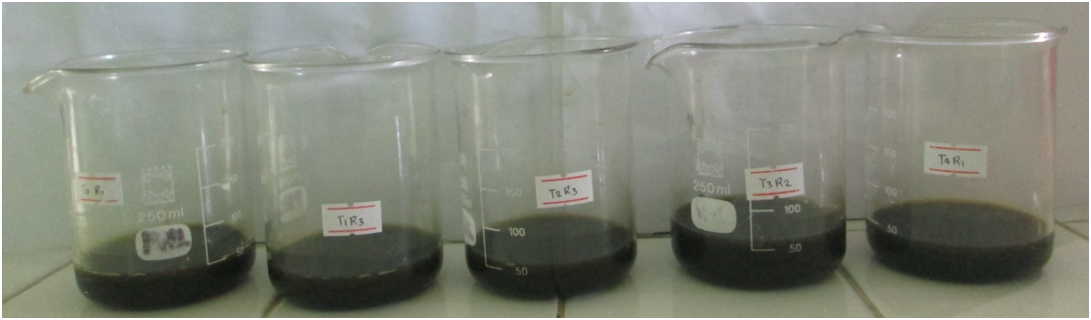
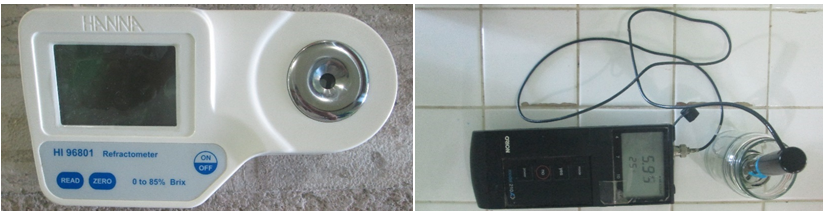
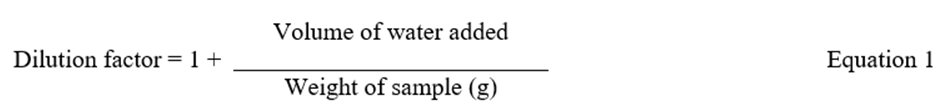
Weight of marketable lettuce per plant was determined by weighting the marketable parts of the plant. It was converted to tonnes per hectare (t/ha) to obtain the yield in a hectare basis. The leaves were weighed for fresh weight then it was oven dried to obtain the dry weight. Moisture content was obtained by dividing the difference between fresh weight and dry weight divided by fresh weight multiplied by 100. Color deterioration was obtained by counting the number of days the produce reach to >25% surface yellowing after harvesting. Percent weight loss was obtained by weighing the samples in a daily basis and the difference between initial weight and daily weight was divided by the initial weight multiplied by 100. Degree of wilting was obtained by counting the number of days the sample reach to severe wilting symptom. Quality loss was obtained by counting the number of days the sample reach to tough texture. Visual quality rating was obtained by counting the number of days the samples reach to the limit of edibility. Extract of lettuce leaves in different treatments was used to determine its TSS, pH, and TA (Figure 2a). The TSS of the filtrate was measured using a digital refractometer (Figure 2b). The actual TSS was calculated by multiplying the readings with the dilution factor using the Equation 1. The pH of the filtrate was measured using the digital pH meter (Figure 2c)
Table 1. Fertilization schedule of lettuce.
| Time of Application | Fertilizer/Material | Method of Application | Amount |
| Basal | Manure | Broadcast | 1.0 kg/linear meter |
| Basal | 14-14-14 | Drill | 15.0 grams/hill |
| 1 DAT | Calcium Nitrate | Drench | 7.5 grams/liter |
| 3 DAT | Calcium Nitrate | Drench | 7.5 grams/liter |
| 5 DAT | Calcium Nitrate | Drench | 7.5 grams/liter |
| 7 DAT | 14-14-14 | Side-dress | 1.0 grams/hill |
| 15 DAT | 46-0-0 | Side-dress | 15.0 grams/hill |
| Source: East West Seed Group, 2011 DAT = Days After Transplanting | |||
a
b c
Figure 2. (a) extract of lettuce leaves in each treatment for TSS, pH, and TA analysis; (b) refract meter used for TSS analysis; and (c) pH meter used to measure the pH of lettuce extract
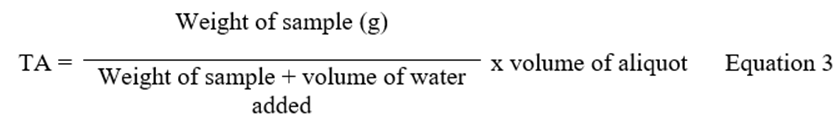
Ten (10) ml of filtrate was pipetted to and Erlenmeyer flask or beaker and 2 drop of 1% phenolphthalein indicator. It was titrated with 0.1N sodium hydroxide (NaOH) to faint pink color and the volume of NaOH was recorded. The TA was calculated using the Equation 2 and Equation 3 where V (volume of NaOH added, ml), N (concentration of NaOH, normality), M (milliequivalent weight of predominant acid, g/meq), and W (weight equivalent of aliquot, g).

Fresh sample leaves in every treatment of lettuce were prepared and submitted for chlorophyll a and b analyses. Leaf samples per treatment were oven dried and powdered for sugar and starch analysis. All samples were submitted to Central Analytical Services Laboratory, PhilRootcrops Complex, Visayas State University, Baybay City Leyte. The data were analyzed statistically and the presence of significant differences among treatments was determined using Analysis of Variance arranged in RCBD. Comparison between treatment means was determined using Duncan’s Multiple Range Test (DMRT) at 5% level of significance.
RESULTS AND DISCUSSION
Yield and Moisture Content
Data on yield and moisture content is presented in Table 2. Results show that there are no significant effects of the treatments on the yield and moisture content of lettuce. Based on the p-value, there is enough evidence to fail to reject the null hypothesis in terms of yield and moisture content (Table 2).As reported also by Jamil et al. (2007), NaCl did not significantly influenced on leaf water contents. The influence of salinity stress on crop production is normally revealed by the crops’ tolerance level that shows no effect on productivity until salinity reaches the threshold level, beyond which there is a linear decrease in yield as soil salinity increases (Maas and Grattan, 1999). However, by descriptive observation in this experiment, plants exposed to salinity stress reduced yield compared to control. Some salts are also plant nutrients, thus elevated salt levels in the soil can enhance or upset the balance of nutrients in the crops or interfere nutrient uptake of some essential nutrients (Blaylock, 1994).Saline conditions in the soil also influence photosynthetic activity particularly through the decrease in leaf length and width, chlorophyll concentration and conductance of stomates, and a reduced in efficiency of photo system II (Netondo et al., 2004).The saline growing media results to various adverse effects on plant growth and development, due to osmotic stress of the soil, salt stress, unbalance nutrition, or a combination of these factors (Ashraf, 2004). All these factors cause antagonistic effects on plant growth and development at physiological and biochemical levels (Munns and James, 2003), and at the molecular level (Tester and Davenport, 2003).
Physical Characteristics
Data on postharvest physical characteristics of lettuce is presented in Table 3. Results show that there are no significant effects of the treatments on color deterioration, percent weight loss, wilting, texture, and VQR (Figure 3, Table 3).Based on the p-value, there is enough evidence to fail to reject the null hypothesis in terms of physical characteristics of harvested lettuce (Table 3).As the salt level in the soil gets closer to the roots, water is less likely to enter the root system and pulled back to the soil, thus, plants are not able to absorb enough water to for its growth and development and the plants wilts and die even more water is being applied to them (Provin and Pitt, 2012). Saline soil leads to cellular dehydration of the plant system, which resulted to osmotic stress and loss of water from the cell cytoplasm resulting in a reduction of the cytosolic and vacuolar volumes. Salt stress often creates both ionic as well as osmotic stress in crops, resulting in accumulation and reduction of specific secondary metabolites in crops (Mahajan and Tuteja, 2005). Parida and Das (2004) also reported that anthocyanins will increase in response to salinity stress. In contrast, salt stress reduced anthocyanin level in some salt-sensitive plants (Daneshmand et al., 2010). Correspondingly, this study agrees with the results of Bartha et al. (2015) that’s odium accumulation contributes to salinity stress tolerance in some lettuce varieties.
Table 2. Yield and moisture content of lettuce as influenced by different salinity levels of growing medium.
| Treatments | Above ground fresh weight (g)/plant | Yield (t/ha) | Leaf MC (%) |
| T0-control | 78.07 | 12.07 | 94.80 |
| T1- 500 ppm | 70.93 | 11.66 | 95.14 |
| T2- 1,000 ppm | 49.67 | 7.81 | 95.01 |
| T3- 5,000 ppm | 65.78 | 11.69 | 94.23 |
| T4-10,000 ppm | 55.15 | 9.90 | 95.58 |
| P-value | 0.2105 | 0.3374 | 0.7441 |
| CV (%) | 22.92 | 25.17 | 1.29 |
| Means within the same column followed by a common/without letter are not significantly different from each other at 5% level using DMRT. | |||
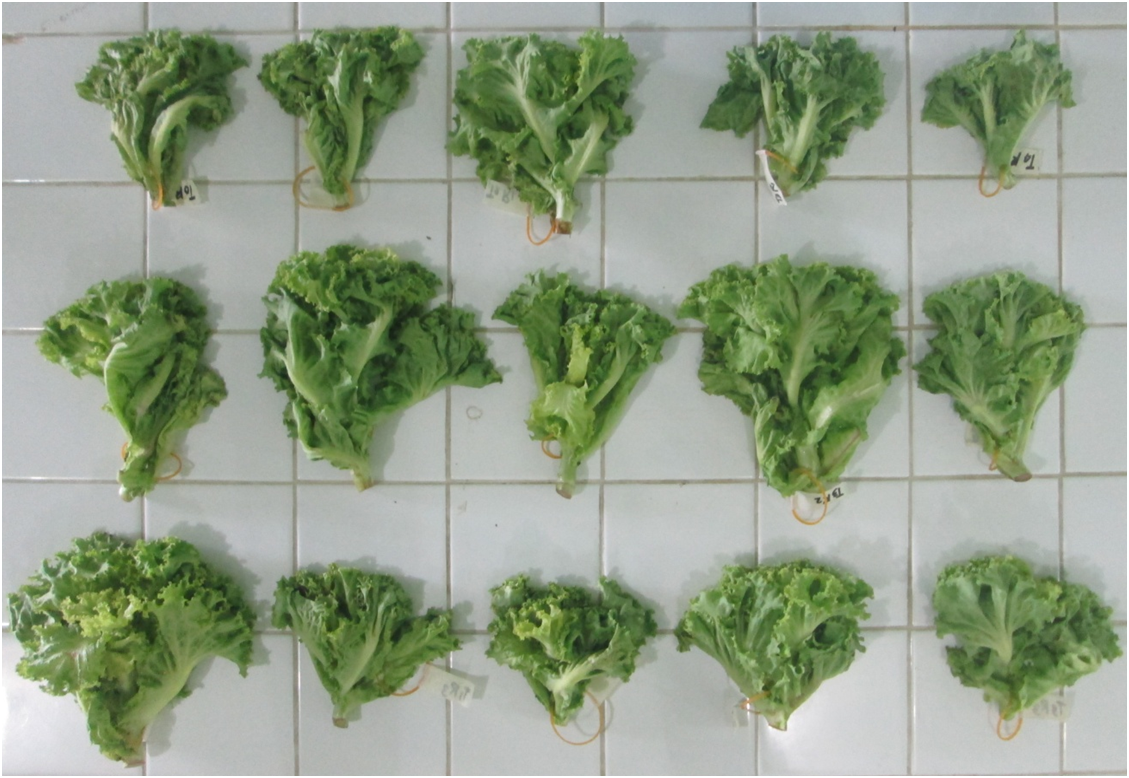
T0 T1 T2 T3 T4
Figure 3. Appearance of lettuce as influenced by different salinity levels of growing medium
Table 3. Postharvest physical characteristics of lettuce as influenced by different salinity levels of growing medium.
| Treatments | Color deterioration (days) | Percent weight loss (%) | Wilting (days) | Texture (days) | VQR (days) | ||||
| Day 1 | Day 2 | Day 3 | Day 4 | Day 5 | |||||
| T0-control | 5.00 | 33.01 | 41.17 | 48.31 | 53.97 | 59.09 | 4.67 | 4.67 | 4.67 |
| T1-500 ppm | 6.00 | 32.25 | 39.99 | 47.62 | 54.62 | 60.58 | 4.33 | 4.33 | 4.33 |
| T2-1,000 ppm | 6.00 | 30.24 | 38.73 | 46.52 | 54.41 | 60.35 | 4.67 | 4.33 | 4.33 |
| T3-5,000 ppm | 6.00 | 30.58 | 34.53 | 44.33 | 49.87 | 54.93 | 5.33 | 5.00 | 4.33 |
| T4-10,000 ppm | 6.00 | 23.58 | 36.38 | 38.85 | 45.97 | 52.42 | 5.00 | 4.67 | 4.33 |
| P-value | 0.4609 | 0.1573 | 0.8033 | 0.1890 | 0.2234 | 0.2755 | 0.1397 | 0.7787 | 0.8651 |
| CV (%) | 13.36 | 14.52 | 19.32 | 10.39 | 9.44 | 8.76 | 8.92 | 15.88 | 10.58 |
| Means within the same column followed by a common/without letter are not significantly different from each other at 5% level using DMRT. | |||||||||
Biochemical Properties
Data on biochemical properties of harvested lettuce is presented in Table 4. Result shows that there is a significant difference among treatments considered on initial TSS and final pH of lettuce. Based on the p-value, there is enough evidence to reject the null hypothesis in terms of initial TSS and final pH of harvested lettuce (Table 4). However, no significant differences were observed on initial pH, final TSS, initial and final TA, chlorophyll content, percent sugar and percent starch of lettuce leaves. Based on the p-value, there is enough evidence to fail to reject the null hypothesis in terms of biochemical properties of harvested lettuce except on initial TSS and final pH (Table 4). Lettuce not exposed to salinity stress obtained significantly higher initial TSS and final pH. However, those exposed in 10,000 ppm salinity level significantly decreases initial TSS and final pH in lettuce leaves. The saline growth medium results to many adverse effects on crop growth and development, due to a low osmotic potential of soil solution, specific ion effects, and nutrient imbalances (Ashraf, 2004). Soil salinity significantly decreases the amount of phosphorus (P) in plants and the uptake of this nutrient because phosphate ions precipitate with Ca ions (Bano and Fatima, 2009). Extreme accumulation of sodium (Na) in cell walls can quickly results to osmotic stress and death of plant cells (Munns, 2002).
Table 4. Biochemical properties of harvested lettuce as influenced by different salinity levels of growing medium.
| Initial | Final | Chl A (mg/g) | Chl B (mg/g) | Sugar (%) | Starch (%) | |||||
| Treatment | TSS (Brix) | pH | TA | TSS (Brix) | pH | TA | ||||
| T0-control | 2.10a | 6.16 | 0.22 | 1.60 | 6.27ab | 0.30 | 3.72 | 0.83 | 12.80 | 11.38 |
| T1- 500 ppm | 1.77b | 6.23 | 0.20 | 1.13 | 6.31 a | 0.26 | 2.71 | 0.59 | 9.55 | 8.15 |
| T2- 1,000 ppm | 1.60bc | 6.17 | 0.24 | 1.30 | 6.26 ab | 0.34 | 3.55 | 0.78 | 11.58 | 9.38 |
| T3- 5,000 ppm | 1.87ab | 6.24 | 0.17 | 1.73 | 6.11c | 0.32 | 2.74 | 0.63 | 10.15 | 10.88 |
| T4-10,000 ppm | 1.47c | 6.22 | 0.19 | 1.37 | 6.16bc | 0.28 | 3.06 | 0.79 | 8.18 | 13.09 |
| P-value | 0.0044 | 0.3182 | 0.2819 | 0.4182 | 0.0098 | 0.8483 | 0.3237 | 0.3787 | 0.1550 | 0.6168 |
| CV (%) | 7.93 | 0.84 | 17.09 | 27.71 | 0.86 | 30.38 | 21.68 | 23.46 | 19.89 | 37.24 |
| Means within the same column followed by a common/without letter are not significantly different from each other at 5% level using DMRT. | ||||||||||
CONCLUSIONS AND RECOMMENDATIONS
Salinity stress did not significantly influence on yield, leaf moisture content, color deterioration, percent weight loss, wilting, texture and VQR of harvested lettuce. Furthermore, it also did not significantly influence on some biochemical properties specifically on initial pH and TA, final TSS and TA, leaf chlorophyll, and sugar and starch content of leaves. Lettuce planted in non-saline soil condition obtained significantly higher initial TSS in its leaves after harvesting. It is recommended to farmers producing lettuce in backyard or commercial scales that lettuce can be planted on soils with zero (0) to 10,000 ppm NaCl without impairing its growth, yield, physical characteristics, and some biochemical properties of harvested lettuce specifically on the leaf TA, chlorophyll, sugar, and starch content. Further studies should be conducted with higher concentrations of NaCl on different varietal trials in hydroponics system, potting mixes, and directly in the farm plots.
LITERATURE CITED
- Amira M.S. and Qados, A. 2011. Effect of salt stress on plant growth and metabolism of bean plant Vicia faba (L.). Journal of the Saudi Society of Agricultural Sciences 10: 7–15.
- Andriolo, J.L., Luz, G.L., Witter, M.H., Godoi, R.S., Barros, G.T. and Bortolotto, O.C. 2005. Growth and yield of lettuce plants under salinity. Horticultura Brasileira 23(4): 931-934.
- Ashraf, M. 2004. Some important physiological selection criteria for salt tolerance in plants. Flora 199: 361–376.
- Bano A., and Fatima, M. 2009. Salt tolerance in Zea mays (L.) following inoculation with Rhizobium and Pseudomonas. Biology and Fertility of Soils 45: 405–413.
- Bartha, C., Fodorpataki, L., Martinez-Ballesta, M. D. C., Popescu, O., & Carvajal, M. (2015). Sodium accumulation contributes to salt stress tolerance in lettuce cultivars. Journal of Applied Botany and Food Quality-Angewandte Botanik 88: 42-48.
- Blaylock, A.D. 1994. Soil salinity, salt tolerance and growth potential of horticultural and landscape plants. Co-operative Extension Service, University of Wyoming, Department of Plant, Soil and Insect Sciences, College of Agriculture, Laramie, Wyoming.
- Daneshmand F., Arvin, M.J. and Kalantari, K.M. 2010. Physiological responses to NaCl stress in three wild species of potato in vitro.Acta Physiologiae Plantarum 32: 91–101.
- De Pascale S., and Barbieri, G. 1995. Effects of soil salinity from long-term irrigation with saline-sodic water on yield and quality of winter vegetable crops. Scientia Horticulturae 64: 145-157.
- Jaleel C.A., Lakshmanan, G.M.A., Gomathinayagam, M. and Panneerselvam, R. 2008. Triadimefon induced salt stress tolerance in with a niasomnifera and its relationship to antioxidant defense system. South African Journal of Botany 74: 126–132.
- Jamil, M., Bashir, S. A. M. I. N. A., Anwar, S., Bibi, S., Bangash, A., Ullah, F., & Rha, E. S. (2012). Effect of salinity on physiological and biochemical characteristics of different varieties of rice. Pakistan Journal of Botany, 44(2), 7-13.
- Khan M.N., Siddiqui, M.H., Mohammad, F., Naeem, M. and Khan, M.M.A. 2010. Calcium chloride and gibberellic acid protect linseed (Linum usitatissimum L.) from NaCl stress by inducing antioxidative defense system and osmoprotectant accumulation. Acta Physiologiae Plantarum 32: 121–132.
- Maas E.V., and Hoffman, G.J. 1977. Crop salt tolerance-current assessment. ASCE Journal of Irrigation and Drainage Division 103(IRZ): 115-134.
- Maas, E.V. and Grattan, S.R. 1990. Crop yields as affected by salinity. WI: ASA, CSSA, SSA, Agron. Monograph 38.
- Mahajan S., and Tuteja, N. 2005. Cold, salinity and drought stresses: An overview.Archives of Biochemistry and Biophysics444: 139–58.
- Munns, R. 2002. Comparative physiology of salt and water stress. Plant, Cell and Environment25: 239–250.
- Munns, R., and James, R.A. Screening methods for salinity tolerance: a case study with tetraploid wheat. Plant Soil 253: 201–218.
- Netondo, G.W., Onyango, J.C. and Beck, E. 2004. Sorghum and salinity: II. Gas exchange and chlorophyll fluorescence of sorghum under salt stress. Crop Science 44: 806–811.
- Parida A.K., and Das, A.B. 2004. Salt tolerance and salinity effects on plants: A review. Ecotoxicology and Environmental Safety60: 324–49.
- Provin, T. and Pitt, J.L. 2012. Managing Soil Salinity. The Texas A&M University System. E-60, 3-12.
- Sayed, O.H. 2003. Chlorophyll fluorescence as a tool in cereal crop research. Photosynthetica 41: 321–330.
- Shanon, M.C. 1989. New insights in plant breeding efforts for improved salt tolerance. Horticultural Technology 6: 96–99.
- Tesi, R., Lenzi, A. and Lombardi, P. 2003. Effect of salinity and oxygen level on lettuce grown in a floating system. Acta Horticulturae 609: 383–387.
- Tester, M., and Davenport, R. 2003. Na+ tolerant and Na+ transport in higher plants. Annals of Botany 91: 503-527.
- Tuteja, N., Gill, S.S., Tiburcio, A.F. and Tuteja, R. 2012. Improving Crop Resistance to Abiotic Stress: Vol. 1. John Wiley & Sons, 996 pp.
- Yeo, A. 1999. Predicting the interaction between the effects of salinity and climate change on crop plants. Scientia Horticulturae 78: 159-174.
- Yildirim, E., Taylor, A.G. and Spittler, T.D. 2006. Ameliorative effects of biological treatments on growth of squash plants under salt stress. Scientia Horticulturae 111: 1–6.