
Phytochemical Screening and Pharmacological Evaluation of Aristolochia Tagala Cham (Aristolochiaceae)
- Sadia Sultana Sharmin
- kh. Jahid, Sarbani Biswash
- Md. Mahfujul Haque Haidary
- 265-332
- Jun 1, 2024
- Chemistry
Phytochemical Screening and Pharmacological Evaluation of Aristolochia Tagala Cham (Aristolochiaceae)
Sadia Sultana Sharmin, kh. Jahid, Sarbani Biswash and Md. Mahfujul Haque Haidary
Primeasia University,Department of Pharmacy,School of Science,Banani,Dhaka-1213.
DOI: https://doi.org/10.51244/IJRSI.2024.1105019
Received: 04 April 2024; Revised: 22 April 2024; Accepted: 26 April 2024; Published: 01 June 2024
EXECUTIVE SUMMARY
This project work has been designed to investigate the aerial parts of Aristolochia tagala Cham, a climbing shrub from the family Aristolochiaceae for its phytochemical nature and selected pharmacological activities. Phytochemical analysis of A. tagala Cham extract indicated the presence of carbohydrate, reducing sugar, glycosides, tannins, alkaloids, terpenoids and flavonoids etc. In the TLC-based qualitative antioxidant assay using DPPH, A. tagala extract showed the free radical scavenging properties indicated by the presence of yellow spot on a purple background on the TLC plate. In the quantitative DPPH assay the extract showed good antioxidant activity and the IC50 value was 112.20 µg/mL, 141.24 µg/mL , 72.44 µg/mL, 231.74 µg/mL for n-hexane, DCM, Ethyle acetate, Water extract of the A. tagala which is comparable to ascorbic acid (IC50 = 30.20 µg/mL). The maximum TPC was obtained in DCM (124 mg GAE/g of extract) followed by n-hexane, Aqueous, Ethyl acetate (88,99,62 mg GAE/g of extract).Maximum flavonoid content was obtained in n-hexane (1078 mg QE /g of extract) followed by Ethyl acetate, DCM & Aqueous extract (507,360,15 mg QE /g of extract).The maximum TTC was obtained in Ethyl acetate (97 mg GAE/g of extract), followed by Aqueous, DCM, n-hexane (50 ,23,9 mg GAE/g of extract). The antidiarrheal effect of n-hexane & DCM fraction at dose 500 mg/kg was significantly higher than that with 250 mg/kg dose and the difference is statistically significant (P<0.0001). Percent inhibition of defecation of n-hexane fraction 49.26% and 59.11% and DCM was 29.56% and 40.89% at doses 250 and 500 mg/kg body weight respectively whereas standard loperamide (3 mg/kg) was 85.22%. The plant extract of A.tagala cham showed significant (p<0.05) antihyperglycemic activity in mice as compared to control groups. DCM & Ethyl acetate fraction extracts showed a noticeable decrease in locomotion by decreasing number of square crossed in the test animals from the 2nd, 3rd, 4th observation period at both dose levels (250 and 500 mg/kg body weight). All the four concentrations of A. tagala cham extract were active against P. cervi helminths and the results were statistically significant. Among these DCM extract of A. tagala cham at dose of 25 mg/mL, 50 mg/mL,100 mg/mL and 200 mg/mL paralyzed P. cervi at about 39.4, 24.02, 13.27 and 7.5 minutes, also occurred death at about 51.10, 33.50, 21.68 and 13.30 minutes. Ethyl acetate paralyzed P. cervi at about 26.7, 14.8, 6.7 ,3.6 minutes also occurred death at about 33.2, 20.3, 9.5& 5.4 minutes. Positive control (albendazole) caused the paralysis and death of P. cervi at 11.5 and 18.16 min respectively whereas no paralysis or death occurred for control (0.2% Tween-80 in water) group.
INTRODUCTION
Nature is always a golden sign to show the prominent phenomena of coexistence. Natural products from plants, animals and minerals are the basis for treating human diseases1. Medicinal plants are presently in demand and their acceptance is increasing progressively. Undoubtedly, plants play an important role by providing essential services in ecosystems. Without plants, humans and other living organisms cannot live in a way living should be. Anyway, herbals especially medicinal herbs have constantly acted as an overall indicator of ecosystem health2. Medicinal plants have undoubtedly been considered by human beings since ancient times. It can be said that before the history and since the early humans recognized and exploited the plants around them for use as fuel, clothing, shelter and food, they became aware of their properties more or less. Medicinal plants have been transformed into one of the oldest sciences in countries such as China, Greece, Egypt and India. In ancient Persia, plants were commonly used as a drug and disinfectant and aromatic agent3.[3] In fact, the use of medicinal plants for the treatment of diseases dates back to the history of human life, that is, since human beings have sought a tool in their environment to recover from a disease, the use of plants was their only choice of treatment 4. More than a tenth of the plant species (over 50 000 species) are used in pharmaceutical and cosmetic products. However, the distribution of medicinal plants across the world is not uniform5-6 and medicinal herbs are mainly collected from the wildlife population. Indeed, the demand for wildlife sources has increased by 8% – 15% per year in Europe, North America and Asia in recent decades7. The term medicinal plant refers to a variety of plants that have medicinal properties. These plants are a rich source of compounds that can be used to develop drug synthesis8. The parts of medicinal plants that may be used are different types of seeds, root, leaf, fruit, skin, flowers or even the whole plant. The active compounds in most parts of the medicinal plants have direct or indirect therapeutic effects and are used as medicinal agents. In the body of these plants, certain materials are produced and stored that are referred to as active compounds (substances), which have physiological effects on the living organisms9. Human is mainly dependent on raw plant materials in order to meet medical needs to maintain health and cure diseases10. Medicinal plants are used for treatment because they have certain properties, including synergistic actions. The constituents of the plant may interact with each other, and this interaction can be beneficial for both or adverse to either of them or eliminate the harmful effects of both. Plant–derived compounds can dramatically improve hard–to–treat illnesses, such as cancer. Plant components are also characterized by their ability to prevent the development of certain diseases. The toxicity and adverse effects of conventional and allopathic medicines have also been important factors in the sudden increase in population demands and increase in the number of herbal drug manufactures as well as a reduction in the use of chemical drugs10.
History of the Use of Medicinal Herbs
Determining the exact time of using plants as drug is very difficult. Evidence indicates that plants have been cultivated as drugs approximately 60 000 years ago10. Scripts about medicinal plants date back to almost 5000 years ago in India, China and Egypt, and at least 2500 years in Greece and Central Asia10. Since ancient times, people have sought to cure their own illness using nature. As the use of animals was initially instinctive, such instinctive use was also applied to plants11. Given the fact that at that time there was insufficient information about the causes of the disease, useful plants for treating them, and the ways of using them for such purpose, everything was empirical. Over time, the reasons for the use of certain medicinal plants for treatment of certain diseases were discovered; consequently, the use of medicinal plants gradually rejected the empirical framework and was limited to the facts. The earliest written evidence of the use of medicinal plants for preparation of drugs has been found on a Sumerian clay slab from Nagpur dating back to nearly 5000 years ago10. According to some inscriptions, Egyptians and Chinese who used plants as medicine since more than 27 centuries BC were among the earliest human beings who did so12. Ancient Greek people were also familiar with the medicinal properties of some medicinal plants, and Hippocrates, the founder of Greek medicine and Aristotle, pupil of Hippocrates, used medicinal plants for the treatment of diseases. After that, Theophrastus, a Greek scientist, founded the School of Medicinal Plants. Then, Pedanius Dioscorides (He lived in the first century A.D), a physician and surgeon in the years 75 – 45 BC, wrote an encyclopedia, called De Materia Medica, to describe 600 therapeutic medicinal plants in the form of a series of scientific studies on medicinal plants 12-14.
Medicinal Herbs and Traditional Medicine
The World Health Organization (WHO) defines traditional medicinal plants as natural plant materials which are used at least or in the absence industrial processing for the treatment of diseases at a local or regional scale10. Traditional herbal medicine has been used in developing and developed countries for thousands of years because it is natural and causes comparatively fewer complications15. Early medical history is consistent with the history of herbal medicine. The first books written about medicine were the first books written about plants, including the texts of the Ebers Papyrus, written 1500 BC, in which the names of many plants have been appeared 16. Different types of traditional drugs are widely used in Asia, Africa and Latin America to meet basic health needs. This use is growing rapidly in industrialized countries, which is often referred to as complementary or alternative medicine. In the United States, the National Institutes of Health (NIH) uses the complementary and alternative medicine (CAM) to cover health systems, practices, and products are not presently considered to be part of conventional medicine. Across the world, among all the various traditional medical systems, traditional Chinese medicine (TCM) is currently the most popular followed by Indian medicine. In Western countries, Oriental Medicine refers to Chinese, Japanese and Korean medicines selected by immigrants from Korea, while “Asian medicine” often includes TCM, India (Ayurveda) and Tibetan medicine. Among all treatments in traditional medicine systems, medicinal plants are most frequently used17. Medicinal plants and conventional medicine Today, according to the WHO more than 80% of the world’s population rely more often on traditional drugs, mainly plants, serving as the main source of health care14. This figure includes not only a large population of China, India and all the developing countries of the world but also many advanced countries 15. Although diseases are currently being treated more often through medicines of synthetic origin and specifically developed in laboratories, and their definite effects in the treatment of diseases have contributed to the development of their use, the use of some medications leads to certain damages to the body. Therefore, the importance of medicinal plants and their products is increasingly recognized and the public confidence in their use is constantly strengthened14. Currently, the clinical, pharmaceutical and chemical studies of these traditional drugs, which are mainly derived from plants, are the basis of many early drugs such as Aspirin (from willow bark), Digoxin (from Foxglove), Morphine (from Opium poppy), Quinine (from Cinchona skin) and Pilocarpine (from Maranham Jaborandi). Currently, it is estimated that over 50% of the available drugs are somehow derived from medicinal plants18-19. Phytotherapy is widely being used across the world on a constantly growing basis. Therefore, the global trend of synthetic compounds has turned to herbal drugs, which we can refer to it as a return to nature to prevent diseases and pains. Nature has been served as the source of medicinal herbs.
In this present work, my intention is to verify the therapeutically usefulness of locally available hill tract plants in order to document the traditional knowledge of the medicinal plants used by the traditional healers of Bangladesh. Thus, many field surveys and contract programs with native practitioners have been undertaken and many plants have been identified for their medicinal properties as well as their uses. In one such survey, I found Aristolochia tagala Cham locally known as Ishwarmul.
There are about 500 species in the genus Aristolochia and the majority of these species are distributed in the tropical region, with some exceptions range as north as Canada, Scandinavia, and Northern Japan. They may grow as climbing vines, as short creeping herbs and a few are shrub–like20-21. Aristolochia species are herbaceous perennials, undershrubs or shrubs, often scandent, scrambling, twining, sometimes lianas, usually with prostrate or tuberous rhizomes or rootstocks, and alternate, pinnate, polymorphic or lobed leaves bearing essential oils. Species of Aristolochia were widely distributed in tropical, subtropical and temperate regions of the world. They are known to occur in Asia, Africa, North and South America and Australia but there is a wide distribution across tropical Asia22-24. Various species of Aristolochia have been used in the folk and traditional medicines as medicaments and tonics24. Aristolochia tagala Cham. a climbing shrub is distributed in India, Sri Lanka, China, Malaysia, Burma, Java and Australia, and is a rare medicinal plant25. Various parts of A. tagala are extensively used in traditional medicine. The juice from the leaves is used as a specific antidote for Cobra poison26. The roots are strongly aromatic and are used to treat snake bites, bone fractures, malaria, indigestion, rheumatism, toothaches and various dermatological conditions by the Kani tribe of Thiruvananthapuram and Tirunelveli hills, India. Roots are also used for a medicated steam bath, known as ‘sudorification’. Leaves are used to treat colic fits and bowel complaints. Due to indiscriminate harvesting of roots for are also used for a medicated steam bath, known as ‘sudorification’. Leaves are used to treat colic fits and bowel complaints. Due to indiscriminate harvesting of roots for local medicine and trade, the species has become rare in its natural habitat27.
The present thesis work is designed to evaluate some potential ethanobotanical use of Aristolochia tagala Cham, reported in different books and other related sources. It is with no doubt that plant will remain a rich source of medicine and will certainly continue to supply mankind with novel remedies. This thesis work was performed on different fractions of this plant.
Depending on the tenability of laboratory facility in our discipline the following screenings were carried out–
1. Preparation of crude extract 2. Partitioning of crude extract by four solvents 3. Phytochemical Analysis 4. Qualitative Antioxidants Assay 5. Quantitative Analysis of Antioxidants a. Quantitative Analysis of Relative Antioxidant
- Total Flavonoids Content Assay
- Total Tannin Content Assay
- Total Phenolic Content Assay
b. Determination of Antioxidant activity by DPPH Free Radical Scavenging Assay 6. Evaluation of Hypoglycemic Activity by Oral Glucose Tolerance Test (OGTT) 7. Evaluation of Antidiarrheal Activity by Castor oil induced diarrhea 8. Evaluation of Anthelmintic Activity
PLANT PREVIEW
Botanical Features
Scientific name: Aristolochia tagala cham.
Scientific synonym: Aristolochia acuminata Lam., Aristolochia longifolia Roxb., Aristolochia angulosa Wall.ex Duch28
Family: Aristolochiaceae.
Used part: Whole plants.
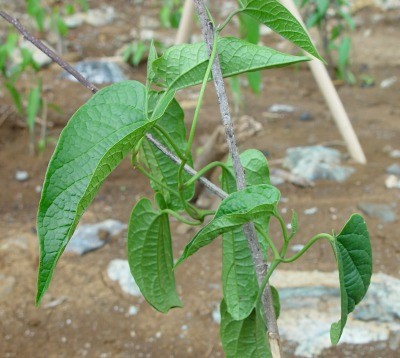
Fig 2.1: Leaves of Aristolochia tagala Cham
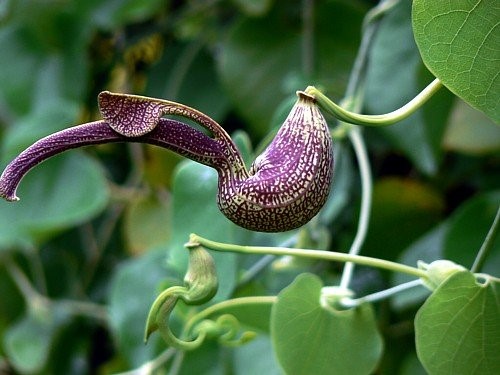
Fig 2.2: Vine seeds of Aristolochia tagala Cham
Common Name 28
- Bangla Name: Ishwarmul,
- English Name: Indian birthwort, Dutchman’s pipe.
- Hindi Name:Isvarmul, Hookabel,
- Malayalam Name:Garudakkoti
- Kannada Name: gattada eeshvari
- Tamil Name: aadutheendapalai
- Telugu Name: nallaisvara
Scientific Classification28
Kingdom: Plantae
Phylum: Tracheophyta
Class: Magnoliopsida
Order: Piperales
Family: Aristolochiaceae
Genus: Aristolochia
Species: Aristolochia tagala cham
Description of Plant 29
This is an aggressive, sun–loving slender climber. Leaves are simple, oval to oblong, 6– 25 cm long by 4–10 cm wide, tip abruptly pointed, base deeply heart– shaped and alternately arranged. The leaf stalk is 1.5–2.5 cm long. Flowers are in short, branched inflorescences of 3–8 cm long that arise from the leaf axils. Flowers are bisexual, with three perianths that unite into a slender tube of about 7 cm long. The base of the tube is globular, within which is a stumpy column bearing many stamens. This globular base narrows into a curved, cylindrical tube about 1 cm long before ending in a funnel–shaped mouth with a prominent reddish brown to purple, tongue–shaped lip of 2–2.5 cm long. The mouth opening is pale yellow with a reddish brown to purple rim. The ovary is inferior and can be mistaken for the tagal flower stalk. Fruits are globular capsule of 3.5 cm diameter on a 2.5 cm stalk. On maturity, it splits into six parts, looking like an inverted parachute. As the fruit sways in the breeze, the numerous, flat and winged seeds are dispersed.
Habitats 29
Forests and open lowland thickets, scrambling over bushes and trees.
- tagala are extensively used in traditional medicine.
- The juice from the leaves is used as a specific antidote for Cobra poison.
- The roots are strongly aromatic and are used to treat snake bites, bone fractures, malaria, indigestion, rheumatism, toothaches and various dermatological conditions by the Kani tribe of Thiruvananthapuram and Tirunelveli hills, India.
- Roots are also used for a medicated steam bath, known as ‘sudorification’.
- Leaves are used to treat colic fits and bowel complaints.
- The leaves are used to treat fever, stomachache, bilious disorders.
- Traditionally it is also used for infantile tympanites, menstruation problem
- In Indonesia, the leaves are made into a poultice and applied to the swollen abdomen or limbs.
- In the Philippines, the plant is used to treat snake bites and malaria.
- In India, the roots are considered a tonic, carminative and emmenagogue.
- A number of other species are used by the Chinese for dysentery, high blood pressure, beri–beri and swollen feet.
LITERATURE REVIEW
A literature review is a search and evaluation of the available literature in given subject or chosen topic area. It shows the researchers an overlook on the related subject and summaries prior research. In this chapter the previous literatures of Aristolochia tagala Cham are assembled.
A study showed that Aristolochia species have covered 164 compounds belonged to the classes of aristolochic acids and esters, aristolactams, aporphines, protoberberines, isoquinolines, benzylisoquinolines, amides, flavonoids, lignans, biphenyl ethers, coumarins, tetralones, terpenoids, benzenoids, steroids, and others with extensive physiological activities. Kuo et al., (2012).21
Moreover, the recent nephrotoxicity studies related to aristolochic acids would be covered in this review and the structure–toxicity relationship would be discussed21.
Battu et al, (2011) 28 used petroleum ether, ethyl acetate, and ethanol extracts of A. tagala roots for investigating anti–inflammatory activity. In vivo and in vitro anti–inflammatory effects were investigated employing the carrageenan induced hind paw edema in rats and the macrophage cell line RAW264. These findings demonstrate that the A. tagala roots have excellent anti–inflammatory activity and validate the traditional indications of this plant in its origin country.
Rajashekharan, S., et al. (1989) 29 clearly demonstrated that two important species of plants used by the Kanitribes of Agastyar hills of Trivandrum district of Kerala against snake–poison and insect bite. The therapeutic use of Aristolochia indica, Linn., as an antidote to snake poison was known to the ancient physicians of Ayurveda. It has been widely used against various ailments by the folk medical practitioners of Kerala. Aristolochia tagala, cham, is a lesser known species, when compared with A. indica, Linn for its medicinal value. However, it is to be noted that kanis have accepted A tagala as more powerful and effective than A. indica.
Dey, A., & De, J. N. (2012)30 performed enormous amount of ethnobotanical work using different plants against snakebite in Indian subcontinent (India, Bangladesh, Pakistan and Nepal). A. tagala has been used traditionally in the treatment of snakebite. It is being used by the tribal people of Chittagong hill tracts of Bangladesh. Root paste is applied immediately after snakebite and fresh leaf juice is given orally to reduce venom action31.
Hadem et al.,(2015)32 analyzed the phytochemical constituents present in Aristolochia tagala Cham (AT ) and Curcuma caesia (CC) by qualitative and quantitative analysis with anticancer properties present in the crude methanol extract. Separation of the phytochemical compounds was done by open column chromatography. It was observed that both AT and CC contained compounds such as phenolics, tannins, flavonoids, terpenoids, etc., and both extracts exhibited antioxidant capacity. HPTLC analysis revealed the presence of flavonoids and indicated the presence of anthocynidin 3‑glycosides, 6‑hydroxylated flavonols, some flavones and chalcone glycosides in AT.
It also suggested that CC and AT possess anti‑inflammation, anti‑proliferative and anti‑cancer properties and that the active components of AT and CC may exert anticancer effects through the TNF‑α‑mediated NF‑κB signaling.
Hadem et al.,(2014)33 evaluated the anti–carcinogenic properties of the crude methanolic extracts of roots of AT and rhizomes of CC in BALB/c mice exposed to a hepatocarcinogen, diethylnitrosamine (DEN). The study highlighted the chemopreventive potential of CC and AT against DEN–induced HCC by enhancing antioxidant status through free radical scavenging mechanism and having potential of protecting endogenous enzymatic and nonenzymatic antioxidant activity.
Tripatara et al., (2012)34 investigated the chemical profiles of Aristolochia tagala Cham (ATC), the original (HNK+ATC) and Homnawakod Ayurved Siriraj Herbal Formulary™ (HNK), and investigated whether they could cause nephrotoxicity or aggravate LPS–induced organ injuries in vivo. From these results suggested that ATC, HNK+ATC or HNK, at the animal dose equivalent to that used in human, do not cause the acute nephrotoxicity in rats and do not aggravate LPS–induced organ injuries even further.
Anilkumar et al. (2014) 35 separated the roots of A. tagala by fractionation of the crude aqueous–methanol extract for identifying phytochemical compounds. Each fraction was assayed for the cytotoxic activity in HeLa cells. Many of the compounds present in A. tagala compounds such as aristolochic acid I, aristolactam IIIa, beta–sitosterol, kaempferol, and stigmasterol have been reported for various biological properties36. Caffeoylquinic acid have been reported to have antioxidant, antibacterial, anticancer, and antihistaminic activity. Kaempferol extracted from this plant has been reported to have anti–inflammatory activity in carrageenan–induced paw edema rats36 and a number of other studies on the anticancer and anti–inflammatory activity have also been reported37. The results of the study showed that Aristolochia species demonstrated a strong antioxidant, anticancer and antibacterial activity and deserve detailed pharmacological studies.
Mohanraj, R., & BAI, N. (2016)24 used 95% methanol A. tagala dried leaves extract for qualitative and quantitative analysis of bioactive compounds. The study revealed the presence of a wide variety of flavonoids in the extracts of A.tagala. The presence of flavonoids gives credence to the use of A.tagala in treating fever and dysentery. Phenols like gentisic acid, pyragallol, 2–methyl resorcinol, orcinol, catechol and sugars like ribose, rhamnose, galactose, and glucose were identified in A. tagala. leaves. Naturally occurring phenolic compounds have free radical scavenging properties. The result obtained is compatible with one of the uses of A.tagala preparation in traditional medicine for rheumatism, cancer, hepatic disorder and aging disease38. The alkaloid, berberine was identified leaf samples of A. tagala. In vitro experimental and clinical results indicate that berberine as an excellent disinfectant and use in tooth ache39. GCMS analysis of the plant samples showed the presence of sesquiterpenes, which decrease the progression of cancer
MATERIALS AND METHODS
Extraction
Materials
Plant selected for present work was whole plant of Aristolochia tagala Cham.
Plant collection & identification
For the present investigation Aristolochia tagala Cham was collected from Srimangal, Sylhet, Bangladesh. The plant was collected on the 24th January, 2019 and was identified by experts at Bangladesh National Herbarium, Mirpur, Dhaka, where a voucher specimen was submitted for future reference. Voucher specimen no. DACB 47324 for Aristolochia tagala Cham.
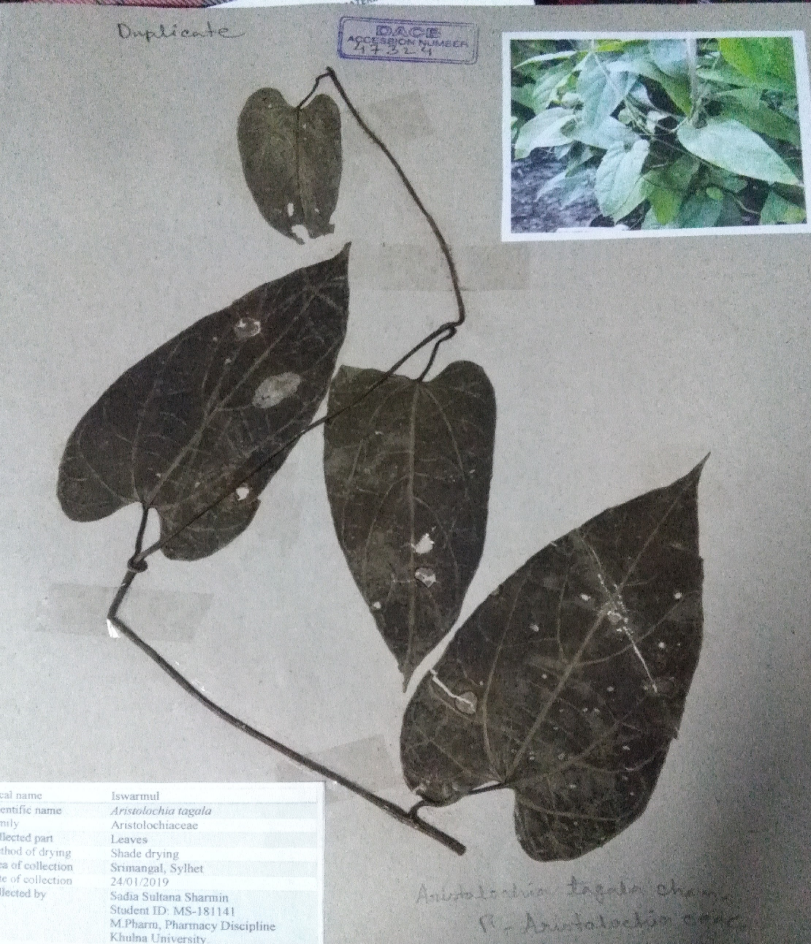
Figure 4.1: Identification document of Aristolochia tagala cham
Preparation of Crude Extract
Drying & grinding
The collected plant samples were separated from undesirable materials or plants or plant parts. Those were dried by shade drying to ensure the active constituents free from decomposition. Then these were ground into a coarse powder with the help of a suitable grinder. The powder was stored in an airtight container and kept in a cool, dark and dry place until analysis commenced.
Cold extraction
650 gm of Aristolochia tagala cham powder was taken in clean, flat–bottomed glass containers and soaked in 2 L of 96% ethanol. The containers with its contents was sealed and kept for a period of 15 days accompanying occasional shaking and stirring. The whole mixtures were then underwent a coarse filtration by a piece of clean cloth. Then it was filtered through cotton & then filter paper.
Evaporation of the solvent
The filtrate (ethanol extract) obtained was evaporated using rotary evaporator. Then concentrated extract was taken in beaker, the opening of beaker was wrapped by a sheet of aluminum foil to which perforation was done for evaporation of ethanol and was kept in dry and cool place for some days and at last evaporation was done under table fan until dried. It rendered concentrate of deep green paste type. The concentrate was designated as crude ethanolic extract of leaves.
Yield determination
Total weight of the dried extract of Aristolochia tagala Cham was 25.7 gm and 650 gm powder was macerated.
So Yield = × 100 %
= 4 %
Partitioning
To perform partitioning, the two phases and the plant extract to be separated in solution are added to a separating funnel through the top with the stopcock at the bottom closed. The funnel is then closed and shaken gently by inverting the funnel multiple times; if the two solutions are mixed together too vigorously emulsions will form. The funnel is then inverted and the tap carefully opened to release excess vapor pressure. The separating funnel is set aside to allow for the complete separation of the phases. The top and the bottom tap are then opened and the two phases are released by gravitation.
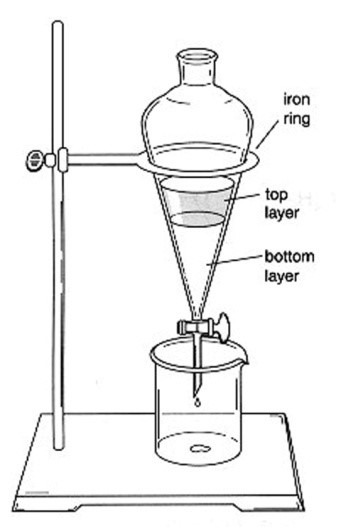
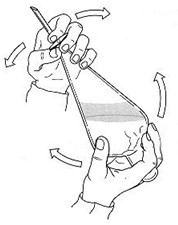
Fig. 4.2: Illustration of partitioning
Methodology
Any plant extract may contain hundreds of compounds of various polarities. Partitioning of plant extract of Aristolochia tagala cham was subjected to separate the polar, moderately polar and nonpolar compounds. The methodology is described below.
Selection of solvent system
The first requirement in the extraction process is to select two immiscible solvents. Water was chosen as one solvent. So, second solvent should be nonpolar hydrocarbon which is immiscible with water. Considering the polarity three solvents were chosen and they were taken one after another. The solvents are–
- n–hexane
- DCM
- Ethyl acetate
- Water
Separation process
3.0 g of ethanolic extract was obtained by cold extraction and evaporation of solvent. At first extract was dissolved in 15 mL methanol (not more than 10%). Then the extract was dissolved into 150 mL water and this solution was transferred to the separating funnel.
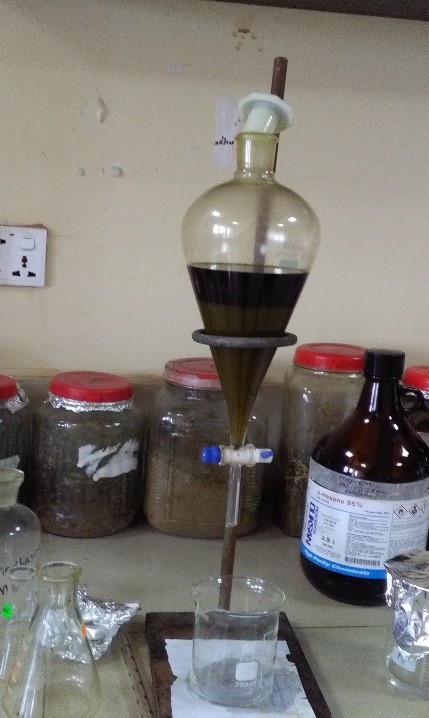
Fig. 4.3: Separation process
n–hexane:
200 mL of n–hexane solvent was added to the funnel. The two solutions were mixed together too vigorously. The funnel was then inverted and the tap was carefully opened to release excess vapor pressure. The separating funnel was set aside to allow for the complete separation of the phases. The nonpolar compounds are more soluble in n–hexane than in the water. So, they would be dissolved in n–hexane. The top and the bottom tap are then opened and the two phases are released by gravitation. The upper part was n–hexane.
DCM:
Water part was taken to the separating funnel and this time 200 mL DCM was added. The same procedure was followed for ethyl acetate and water mixture and according to polarity some compounds would be separated to the DCM part. The lower part was DCM.
Ethyl acetate:
Water part was again taken to the separating funnel and this time 200 mL ethyl acetate was added. The same procedure was followed for ethyl acetate and water mixture and according to polarity some compounds would be separated to the ethyl acetate part. The upper part was ethyl acetate.
Water
At last water part was taken and dried by freeze dryer.
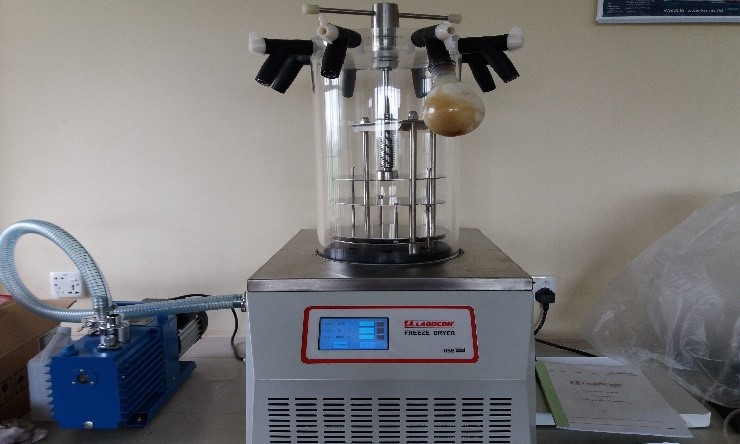
Fig. 4.4: Freeze dryer
Phytochemical Screening
Testing of different chemical groups present in extract represents the preliminary phytochemical studies. To identify the chemical constituents of plant extract standard procedures are followed40-42. The crude extract was qualitatively tested for the presence of chemical constituents using the specific reagents and chemicals. In each test 10% (w/v) solution of extract in methanol was taken unless otherwise mentioned in individual test.
Test material
Different fractions of leaves and steams extract of Aristolochia tagala Cham.
Reagents of chemical group tests
| · Mayer’s Reagent · Dragendroff’s Reagent · Fehling’s Solution A · Fehling’s Solution B · Benedict’s Reagent · Molish Reagent | · Distilled water · Nitric acid · Sodium bicarbonate · Sodium hydroxide · Ferric chloride · Sulphuric acid |
Preparation of Reagents40-43
Mayer’s reagent
1.36 gm mercuric iodide in 60 mL of water was mixed with a solution containing 5 gm of potassium iodide in 20 mL of water.
Dragendroff’s Reagent
1.7 gm basic bismuth nitrate and 20 gm tartaric acid ware dissolved in 80 mL water. This solution was mixed with a solution containing 16 gm potassium iodide and 40 mL water.
Fehling’s solution A
34.64 gm copper sulphate was dissolved in a mixture of 0.50 mL of sulfuric acid and sufficient water to produce 500 mL.
Fehling’s solution B
176 gm of sodium potassium tartarate and 77 gm of sodium hydroxide were dissolved in sufficient water to produce 500 mL. Equal volume of above solution were mixed at the time of use.
Benedict’s Reagent
1.73 gm cupric sulphate, 1.73 gm sodium citrate and 10 gm anhydrous sodium carbonate were dissolved in water and the volume was made up to 100 mL with water.
Molish Reagent
10% (w/v) alcoholic pure α–naphthol solution that means 10g pure α–naphthol was dissolved in sufficient amount of ethanol and the volume of solution was adjusted up to 100mL.
Experimental Methodology
Testing of different chemical groups present in extracts represents the preliminary phytochemical studies. In each test 5 % (w/v) solution of extract in ethanol was taken unless otherwise mentioned in individual test. The chemical group tests are performed as follows and then compared with suitable standards.
Tests for Reducing Sugar43
- Benedict’s Test
Dextrose was used as standard. 0.5 mL of aqueous extract of the plant material was taken in a test tube. 5 mL of Benedict’s solution was added to the test tube, boiled for 5 minutes and allowed to cool spontaneously. A red color precipitate of cuprous oxide indicates the presence of a reducing sugar.
- Fehling’s Test
2mL of an aqueous extract of the plant material was added to 1mL of a mixture of equal volumes of Fehling’s solutions A and B and boiled for few minutes. A red or brick red color precipitate formation indicates the presence of a reducing sugar. Dextrose was used as standard.
- Tests for Combined Reducing Sugar
1mL of aqueous extract of plant material was boiled with 2 mL of dilute hydrochloric acid for 5 minutes, then cooled and neutralized with sodium hydroxide solution and then Fehling’s test was performed as described above. A red or brick red color precipitate formation indicates the presence of a combined reducing sugar.
Tests for Phenolic Compounds 44
Ferric Chloride Test
An aliquot of 2 mL aqueous solution of the extract was taken in a test tube. Then 1 mL of 5 % (w/v) aqueous ferric chloride solution was added in the test tube. Dark green or bluish black color precipitate indicates the presence of phenolic hydroxyl groups. Here aqueous solution of gallic acid was used as standard.
Lead acetate test
An aliquot of 2 mL aqueous solution of the extract was taken in a test tube. Then 1 mL of 10 % (w/v) aqueous lead acetate solution was added in the test tube. White color precipitate indicates the presence of phenolic compounds. Here aqueous solution of gallic acid was used as standard.
Tests for Tannins43
Ferric chloride test
5mL solution of the extract was taken in a test tube. Then 1 mL of 5 % ferric chloride solution was added. Greenish black precipitate indicates the presence of tannins. Rose petal was used as standard for this.
Potassium Dichromate Test
5 mL solution of the extract was taken in a test tube. Then 1 mL of 10 % Potassium dichromate solution was added. A yellow precipitate indicates the presence of tannins. Here rose petal was used as standard.
Test for Flavonoids43
2 methods are used for this using quercetin as standard.
- 5 mL of dilute ammonia solution was added to a portion of the aqueous filtrate of plant extract followed by addition of concentrated H2SO4. A yellow coloration observed in each extract indicates the presence of flavonoids. The yellow color disappears on standing. Here aqueous solution of quercetin was used as
- 2 gm extract was dissolved in dilute sodium hydroxide and then neutralized with dilute hydrochloric acid. Formation of yellow color and disappearance of color indicate the presence of flavonoid.
Test for Saponins 43
1 mL solution of the extract was diluted with distilled water to 20 mL and shaken in a graduated cylinder for 15 minutes. A layer of foam above the solution indicates the presence of saponins. Here, detergent was used as standard.
Test for Gums 45
5 mL solution of the extract was taken and then Molish’s reagent and sulphuric acid were added. Red violet ring produced at the junction of two liquids indicates the presence of gums. Liquid gum was used as standard for this.
Test for Steroids – Salkowski Test 46
In an aliquot of 2 mL of the chloroform extract solution few drops of conc. H2SO4 was added by means of a pipette via the side of the test tubes. Formation of reddish brown ring at the interface of the two liquids denotes the presence of steroids. Commercially available norgesterol was used as standard for this.
Tests for Terpenoids – Salkowski Test 43
To 0.5 g of the extract, 2 mL of chloroform was added; then concentrated H2SO4 (3 mL) was carefully added to form a layer. A reddish brown coloration at the interface indicates the presence of terpenoids. Lemon was used as standard.
Test for Alkaloids 43
- Mayer’s Test
2 mL solution of the extract and 5 mL of dilute hydrochloric acid (1 %) were taken in a test tube. Then 1 mL of Mayer’s reagent was added. A white color precipitate indicates the presence of alkaloids.
- Dragendroff’s Test
2 mL solution of the extract and 5 mL of dilute hydrochloric acid (1%) were taken in a test tube. Then 1 mL of Dragendroff’s reagent was added. Orange brown precipitate indicates as the presence of alkaloids. Nicotine was used as standard.
Test for Glycosides43
A small amount of an alcoholic extract was taken in 1 mL of water. A few drops of aqueous NaOH were added. A yellow color indicates the presence of glycosides. Here, aloe vera was used as standard.
Tests for Proteins & Amino acids 47
Xanthoprotein Test
Few drops of concentrated nitric acid was added by the sides of the test tube into 1 mL of aqueous extract and then observed for formation of yellow color which indicates the presence of xanthoprotein. Here, egg albumin was used as standard.
Tests for Acidic Compounds48
To the alcoholic extract, sodium bicarbonate solution was added and observed for the production of effervescences. Production of effervescences indicates the presence of acidic compound. Salicylic acid was used for standard in this case.
Observation
Tests for standard
Table 4.1: Different chemical group tests for standard.
| Test | Reagent | Standard Solution | Observation | Inference |
| Reducing sugar test | Fehling’s Solution | Dextrose | Brick red colored precipitate | Presence of reducing sugar |
| Benedict’s reagent | Dextrose | Brick red colored precipitate | Presence of reducing sugar | |
| Tests for phenolic compounds | Ferric Chloride | Gallic acid | Dark green or bluish black color precipitate | Presence of phenolic compounds |
| Lead Acetate | Gallic acid | White color precipitate | Presence of phenolic compounds | |
| Tannin test | Ferric chloride solution | Rose petal | Greenish black precipitate | Presence of tannin |
| Potassium dichromate solution | Rose petal | A yellow precipitate | Presence of tannin | |
| Test for flavonoids | Ammonia solution | Quercetin | Yellow coloration and disappearance of color | Presence of flavonoid |
| NaOH solution | Quercetin | Yellow coloration and disappearance of color | Presence of flavonoid | |
| Test for saponin | Froth test | Detergent | Formation of 1cm layer of foam | Presence of saponin |
| Test for gum | Molish’s reagent | Liquid glue | Reddish ring | Presence of gum |
| Steroids test | Salkowski test | Norgesterol | Golden yellow color | Presence of steroids |
| Test for alkaloids | Dragendroffs reagent | Nicotine | Orange brown precipitate was observed | Presence of alkaloids |
| Mayer’s reagent | Nicotine | Creamy white color precipitate | Presence of alkaloids | |
| Tests for terpenoids | Salkowski test | Lemon | reddish brown coloration at the interface | Presence of terpenoids |
| Test for glycosides | NaOH solution | Aloe vera | Yellow color | Presence of glycosides |
| Test for protein & amino acids | Xanthoprotein test | Egg albumin | Formation of yellow color | Presence of protein |
| Test for acidic compounds | Sodium bicarbonate solution | Salicylic acid | Production of effervescences | Presence of acidic compounds |
Test for anti–oxidant potentiality
1. DPPH free Radical Scavenging activity test
A. Qualitative Antioxidant Assay
Test Material
Aristolochia tagala Cham extract.
Apparatus
- TLC plates containing fluorescent material
- Beaker
- Fine capillary tube
- Spirit lamp
- UV detector with short (254 nm) and long (360 nm) wavelength
- Spray gun
- Filter paper
- Forceps
Reagents
- DPPH (007886%) solution in ethanol
- n–hexane
- Ethyl acetate
- DCM
- Distilled water
- Methanol
- Chloroform
- Ascorbic acid
Table 4.2: Solvent system used for TLC
| Groups | Solvent system | Ratio |
| Non–polar | n–hexane : Ethyl acetate | 2:1 |
| Medium polar | CHCl3 : CH3OH | 5:1 |
| Polar | CHCl3 : CH3OH : H2O | 40:10:1 |
Experimental Methodology
This test was performed to see the presence of antioxidant groups in the plant extract. 2, 2 – diphenyl –1–picryl – hydrazyl (DPPH) is a stable free radical, which has the ability to change color in the presence of antioxidants. DPPH forms deep pink color when it is dissolved in ethanol. Then DPPH (0.02% w/v) solution in ethanol is sprayed on the chromatogram of the extract, it forms pale yellow or yellow color on purple background which indicates the presence of antioxidants49.
TLC Plate Preparation
Commercially available TLC plate is cut into appropriate size of 5 cm long and 5 cm wide.
Sample Application
- A fine capillary tube was used as spotter for sample application in the TLC
- A very little amount of plant extract was taken in a small vial and diluted suitably with ethanol.
- The sample was spotted in uniform size (about 0.3 cm) on TLC
- The sample was applied several times in each spot to get better
- Each spot was dried before applying another volume of solution to the same
- A little amount of ascorbic acid (as standard) was taken in a small vial and diluted suitably with ethanol and was applied by spotter at the same
- Only sample was spotted on three TLC plates (one set) for the detection of UV positive components and on another three plate’s (another set) ascorbic acid was also spotted as standard for the detection of antioxidant positive
Development of Chromatogram
- The chromatogram was developed by ascending technique.
- Three solvent systems in the ratio mentioned before were kept in three jars.
- Two plates were placed in each jar in such a manner that the sample spots were just above the solvent surface.
- Filter papers were kept into each jar by wetting with respective solvent systems to keep those jars saturated and the jars were closed tightly.
- The plates were then removed from the jars and dried with a current of air suitably.
Observation Antioxidant positive components detection
- After drying the plates, they were viewed under UV detector both in short (254 nm) and long (366 nm) wavelength and various regions were marked with the help of a pencil.
- One plate from each solvent system was sprayed with 0.007886% ethanol solution of DPPH on it by spray gun.
- The plates were dried with a current of air suitably.
Spots which were observed at longer wavelength were manifested by the symbol [ ] and spots which were observed at shorter wavelength were manifested by the symbol ( ).
B. Quantitative Antioxidant Assay
Apparatus
- Test tubes
- Beakers
- Sonicator
- Pipette
- Electronic balance
- UV spectrophotometer
Reagents
- Methanol
- 007886% DPPH in methanol solution
- DMSO (Dimethyl sulfoxide)
- Ascorbic acid (as positive control)
Preparation of Sample
Sample of the various fraction of Aristolochia tagala cham were prepared in the following way–
| No. | Procedure |
| 1. | 3mg of plant extract was taken in test with 3 mL of ethanol and shaken properly to make the stock solution. |
| 2. | 1mL stock solution added with 9mL ethanol to prepare 10mL sample solution |
| 3. | 0.8mL stock solution added with 9.2mL ethanol to prepare 10mL sample solution |
| 4. | 0.6mL stock solution added with 9.4mL ethanol to prepare 10mL sample solution |
| 5. | 0.4mL stock solution added with 9.6mL ethanol to prepare 10mL sample solution |
| 6. | 0.2mL stock solution added with 9.8mL ethanol to prepare 10mL sample solution |
| 7. | 0.1mL stock solution added with 9.9mL ethanol to prepare 10mL sample solution |
| 8. | 0.05mL stock solution added with 9.95mL ethanol to prepare 10mL sample solution |
Preparation of Standard
Standard of the ascorbic acid was prepared in the same way adjusted to 10mL with ethanol.
Preparation of 0.007886 % (w/v) DPPH
7.8 mg of DPPH was dissolved in 100 mL methanol to prepare 0.007886 % (w/v) DPPH.
Preparation of Blank
2 mL ethanol was added in 6mL DPPH (0. 007886% ) which was used as blank.
Methodology50
- At first 7 test tubes were taken to make aliquots of 7 conc. (8, 16, 32, 64, 128, 256 and 512 μg/mL) for plant extract (sample) and in another 7 test tubes were used to prepare the aliquots of 7 conc. (8, 16, 32, 64, 128, 256 and 512 μg/mL) for ascorbic acid (standard)
- Plant extract and ascorbic acid were weighed 3 times and dissolved in to make the required concentrations by dilution technique. Here ascorbic acid was taken as positive control.
- DPPH was weighed and dissolved in ethanol to make 007886% (w/v) solution. To dissolve homogeneously sonicator was used.
- Another 7 fresh test tubes were taken and 1 mL of different concentration of plant extracts was taken in each test tube and 3 mL of DPPH in ethanol was added to each test tube.
- Then another 7 fresh test tubes were prepared for the standard as well and the procedure was followed as the previous time.
- After mixing, the test tubes were tubes were kept in dark for 30 minutes to complete the reactions. Then UV spectrophotometer was used to measure at 517 nm.
- % of inhibition was calculated as– % inhibition = [(Blank absorbance – Sample absorbance) / Blank absorbance] X 100
- IC50 was determined from % inhibition vs. log conc. graph.
2. Determination of Total Phenolic Content (TPC)
| Apparatus · Test tubes · Beakers · Pipette · UV spectrophotometer · Electronic balance · Volumetric flask | Reagents · Methanol · Distilled water · Folin–Ciocalteu (FC) reagent · Gallic acid |
Method for Determination of Total phenolic Content
The total phenolic content of different fraction of Aristolochia tagala Cham ethanol extract as determined by the modified Folin–Ciocalteu method51.
- 5 ml of methanol solution of extract (l mg/ml) was mixed with 5 ml 10% (v/v) Folin–Ciocalteu reagent in where Folin–Ciocalteu reagent was dissolved in distilled water.
- Then 4 ml 7.5% w/v aqueous Sodium carbonate solution was added to the mixture.
- Blank was concomitantly prepared, containing 0.5 ml methanol, 5 ml 10% (v/v) Folin–Ciocalteu’s reagent dissolved in distilled water and 4 ml 7.5% w/v aqueous Sodium carbonate solution.
- The mixture was vortexed for 15 second and allowed to incubated in a thermostat at 400C for 30 minutes.
- The absorbance was measured at λmax=765 nm against the blank by using spectrophotometer.
The following equation was obtained from a standard Gallic acid calibration curve
Y =5.547x – 0.0292; R² = 0.9533
Where Y is the absorbance and x is the concentration of Gallic acid (mg/ml).
Based on the measured absorbance, Gallic Acid Equivalent (GAE) was read (mg/ml) from the calibration line by using the following equation
Then total phenolic content (TPC) in plant ethanol extract in Gallic acid equivalents (GAE) was calculated by using the following equation
Total phenolic content value is expressed in terms of mg of Gallic acid equivalent (GAE) per gram of dry extract, which is a common reference compound.
3. Determination of Total Flavonoid Content (TFC)
| Apparatus · Test tubes · Beakers · Pipette · UV spectrophotometer · Electronic balance · Volumetric flask | Reagents · Methanol · Distilled water · 5% w/v Sodium nitrite (NaNO2) · 10% w/v aluminum chloride (AlCl3) · 1M sodium hydroxide (NaOH) · Quercetin |
Method for Determination of Total Flavonoids Content
Flavonoids are well–known antioxidant constituents of plants and possess a broad spectrum of chemical and biological activity, including radical scavenging properties 52.
The total flavonoid content of ethanol extracts was determined according to Aluminum trichloride colorimetric method53.
- 1 ml methanol solution of ethanol extract (1 mg/ml) was mixed with 4 ml distilled water and 0.3 ml 5% (w/v) sodium nitrate solution.
- Five minutes later, 0.3 ml 10% (w/v) aluminum chloride was added to the mixture.
- After one minute 2 ml of 1 M sodium hydroxide solution was added to the mixture.
- The volume of the mixture was adjusted to 10 ml with distilled water.
- Blank was concomitantly prepared and the final blank solution contain 1 ml methanol,4 ml distilled water and 0.3 ml 5% sodium nitrate solution,0.3ml 10% aluminum chloride, aluminum chloride, 2 ml of 1 M sodium hydroxide and the volume was adjusted to 10 ml with distilled water.
- The mixture was vortexes for 15 seconds and the solution was allowed to stand for 30 min for reaction at room temperature.
- The absorbance was measured at λmax = 510 nm against the blank by using spectrophotometer (double beam Shimadzu UV/ visible spectrophotometer.
- All determinations were performed in duplicate.
The following equation was obtained from a standard quercetin calibration curve.
Y = 0.4166x + 0.0269; R² = 0.9855
Where Y is the absorbance and x is the concentration of quercetin (mg/ml).
Based on the measured absorbance, quercetin equivalent (QE) was read (mg/ml) from the calibration line by using the following equation.
![]()
Then total flavonoid content (TFC) in plant ethanol extract in quercetin equivalents (QE) was calculated by using the following equation.
![]()
Total flavonoid content value is expressed in terms of mg of quercetin equivalent (QE)/gram of dry extract, which is a common reference compound.
- Determination of Total Tannin Content (TTC)
| Apparatus · Test tube · Beaker · Pipette · UV spectrophotometer · Electronic balanc | Reagents · Ethanol · Folin–Ciocalteu reagents · Distilled water · 35% Na2CO3 · Gallic acid (as positive control) |
Method for Determination of Total Tannin Content
The tannins were determined using the Folin–Ciocalteu phenol reagents as reported by Amorim et al., 200854. Briefly 0.005 g of plant extract of Aristolochia tagala cham were mixed with 5 mL of ethanol separately & sonicated for 5 minutes.
The total flavonoid content of n–hexane, DCM, Ethyl acetate and Water fraction were determined according to aluminum trichloride colorimetric method55.
- At first, 0.1 mL standard solution of each concentration (0.5, 0.4, 0.3, 0.2, 0.1 mg/mL) and 0.1 mL extract sample was taken separately in different test tubes.
- 7.5 mL of distilled water was added to the each test tube.
- Then 0.5 mL of FC reagent was added to the test tube.
- 1mL of 35% Na2CO3 was added to the test tube and the solution was diluted Q.S. to 10 mL with distilled water.
- Then all test tubes vortex for 15 second and kept at room temperature for 30 minutes.
- Then absorbance of the solution was measured at 725 nm.
- Blank was prepared by following all the above steps except the addition of gallic acid and sample.
The following equation was obtained from a standard gallic acid calibration curve
y = 0.99x + 0.0663; R² = 0.9941
Where y is the absorbance and x is the concentration of gallic acid (mg/ml).
Based on the measured absorbance, gallic acid equivalent (GAE) was read (mg/ml) from the calibration line by using the following equation.
![]()
Then total tannin content (TTC) in plant ethanol extract in gallic acid equivalents (GAE) was calculated by using the following equation.
![]()
Total tannin content value is expressed in terms of mg of gallic acid equivalent (GAE)/gram of dry extract, which is a common reference compound.
Evaluation of Antidiarrheal Activity by Castor oil induced diarrhea
Materials
- Hand gloves
- 1 mL syringe
- 3 mL syringe
- Castor oil
- Loperamide
- Balance
- Feeding needle
- Beaker
- Distilled water
Study design
The mice were randomly selected and divided into eight groups denoted to 10 groups consisting of 4 mice in each group. Each group received a specific treatment i.e, control, reference, test sample etc. Each mouse was weighed properly and the doses of the test sample, reference and control substances were adjusted accordingly.
Table 4.3: Experimental profiles to assess the antidiarrheal activity.
| Animal Group | Treatment | Dose (Per Kg–body weight) | Rout of administration |
| I (Control) | 1% Tween –80 In water | 10 mL | Oral |
| II (Standard) | Loperamide | 3 mg | Oral |
| III (Test group–I) | n–hexane leaves extract | 250 mg | Oral |
| IV (Test group–II) | n–hexane leaves extract | 500 mg | Oral |
| V (Test group–III) | DCM plant extract | 250 mg | Oral |
| VI (Test group–IV) | DCM plant extract | 500 mg | Oral |
| VII (Test group–V) | Ethyl acetate plant extract | 250 mg | Oral |
| VIII (Test group–VI) | Ethyl acetate plant extract | 500 mg | Oral |
| IX (Test group–VII) | Water plant extract | 250 mg | Oral |
| X (Test group–VIII) | Water plant extract | 500 mg | Oral |
Experimental Animal
Young Swiss–albino mice aged 6–7 weeks, average weight 22–30g were used for this experiment. The mice were purchased from Jahangirnagar University, Dhaka, Bangladesh. They were kept in standard environmental condition for one week for adaptation after their purchase and fed with formulated rodent food and water.
Preparation of sample
To prepare the test samples at the doses of 250 and 500 mg/kg body weight of samples were measured respectively. The extract was triturated in unidirectional manner by the addition of small amount of tween–80. After proper mixing of extract and tween–80, the distilled water was slowly added. The final volume was made 10 mL.
Preparation of standard
For the preparation of standard loperamide at the dose of 3 mg/kg body weight, 3 mg equivalent loperamide was triturated with small amount of tween–80 and then adjusted with distilled water to make final volume 10 mL.
Methodology 56
The mice were fed with the samples 1 hour prior to the oral administration of castor oil at a dose of 0.7mL per mouse. Individual mouse of each group was placed in separate cage having blotting paper placed in every cage lined with the floor to examine for the presence of diarrhea every hour for 4 hours after the castor oil administration. Number of stools or any fluid material that stained the blotting paper were counted at each successive hour during the 4 hours period and was noted for each mouse. The latent period of each mouse was also counted. At the beginning of each hour new blotting papers were placed for the old ones.
Evaluation of Antihyperglycemic Activity by Oral Glucose Tolerance Test
Materials
| Apparatus · Hand gloves · 1 ml syringe · 3 ml syringe · Balance · Feeding needle | Reagents · Needle · Glucometre & strips · Powdered glucose · Tween–80 · Glibenclamide · Distilled water |
Experimental Animal
Young Swiss–albino mice aged 6–7 weeks, average weight 22–30g were used for this experiment. The mice were purchased from Jahangirnagar University, Dhaka, Bangladesh. They were kept in standard environmental condition for one week for adaptation after their purchase and fed with formulated rodent food and water.
Preparation of Standard
For the preparation of standard Glibenclamide at the dose of 5 mg/kg body weight, 5 mg equivalent Glibenclamide was measured and triturated with small amount of tween–80 and triturated with small amount of tween–80 and then adjusted with distilled water to make final volume 10 mL.
Preparation of Sample
To prepare the test samples at the doses of 250 and 500 mg/kg body weight of samples were measured respectively. The extract was triturated in unidirectional manner by the addition of small amount of tween–80. After proper mixing of extract and tween–80, the distilled water was slowly added. The final volume was made 10 mL.
Preparation of Glucose solution
For the preparation of glucose solution at the dose of 10 g/kg body weight, 50 g glucose was measured in the electric balance and dissolved in 50 mL of distilled water.
Experimental methodology57
The experimental animals were tested in a fasting state (having no food or drink except water for at least 12 hours but not greater than 16 hours). The mice were randomly selected and divided into ten groups denoted consisting of 5 mice in each group. Each group received a specific treatment i.e. negative control, positive control and the test samples. Each mouse was weighed properly and the doses of the test samples, reference and control substances were adjusted accordingly. After the selection and weighing the mice for control, standard and test groups the test samples, standard and control solution, according to the respective dose, were given orally by means of a feeding needle. After 30 minutes later, to all groups glucose solution (2 gm/kg body weight) was administered orally with the help of a feeding needle. Blood glucose levels were measured at 0 minutes, 30 minutes, 90 minutes and 150 minutes after glucose administration57-60. For determination of blood glucose level, blood sample was collected by piercing the tail tips with a sharp needle. After collection of blood, the tail tips were exposed to povidone iodine ointment to counteract the possibility of infection and inflammation. The blood glucose level is determined by using the glucometer and compatible blood glucose strips. The blood glucose level was measured in mmol/L (Bnouham et al., 2003).
Table 4.4: Experimental profile to assess the effect of plant extracts in antihyperglycemic activity test.
| Animal Group | Treatment | Dose (Per Kg–body weight) | Rout of administration |
| I (Control) | 1% Tween –80 In water | 10 mL | Oral |
| II (Standard) | Glibecinamide | 5 mg | Oral |
| III (Test group–I) | n–hexane fraction | 250 mg | Oral |
| IV (Test group–II) | n–hexane fraction | 500 mg | Oral |
| V (Test group–III) | DCM fraction | 250 mg | Oral |
| VI (Test group–IV) | DCM fraction | 500 mg | Oral |
| VII (Test group–V) | Ethyl acetate fraction | 250 mg | Oral |
| VIII (Test group–VI) | Ethyl acetate fraction | 500 mg | Oral |
| IX (Test group–VII) | Water fraction | 250 mg | Oral |
| X (Test group–VIII) | Water fraction | 500 mg | Oral |
Evaluation of Anthelmintic Activity
Materials
- Pipettes (10 ml)
- Measuring cylinder
- Volumetric flask (100 ml)
- Petri dish
- Beaker
- Balance
Experimental pathogens
Live adult helminths Paramphistomum cervi was collected from freshly slaughtered cattle at local abattoirs of Gallamari, Khulna, Bangladesh. Helminths will be properly cleaned and kept in 0.9% phosphate–buffered saline (PBS) of pH 7.4 at the temperature of 37±1ºC until the performance of test. PBS was prepared by dissolving 0.2 g KCl, 1.78 g Na2HPO4, 0.27 g KH2PO4 and 8.01 g NaCl in 1 L of distilled water to get isotonic solution. All the chemicals including liquid solvents used in the present investigation were of analytical grade.
Study design
Anthelmintic activity of the extract was investigated on live parasites and Paramphistomum cervi (P. cervi) of cattle. The parasites were divided into different groups consisting of six parasites in each group. Extract at the concentrations of 25, 50,100 and 200 mg/mL and reference standard albendazole (collected from Beximco pharmaceutical Ltd., Bangladesh) at the concentrations of 15 mg/mL of 10 mL in PBS were prepared and transferred to Petri dishes. Control group was treated with 0.1% tween–80 in PBS. Six parasites were placed in each Petri dish and observed. The time of paralysis was recorded when no movement was observed unless shaken vigorously. The death time was recorded after evaluating that the parasites did not move when shaken vigorously, dipped in warm water (50°C) or subjected to external stimuli. Anthelmintic activity is expressed as the time required for paralysis and death of parasites as compared to control.
Preparation of sample
To prepare the suspension of ethanol extract of Aristolochia tagala cham at the concentrations of 25, 50,100 and 200 mg/mL; 0.25 0.5,1 and 2gm of extract were taken and triturated with 0.2% v/v of Tween 80 as a suspending agent and final volume was made to 10 mL for respective concentration with PBS. For the preparation of standard albendazole at concentrations of 15 mg/mL, 150 mg of albendazole powder were taken and triturated with 0.2% v/v of Tween 80 as a suspending agent and final volume was made to 10 mL for respective concentration with PBS.
Preparation of Standard
For the preparation of standard albendazole at concentrations of 10 mg/mL 15 mg/mL 100 mg and 150 mg of albendazole powder were taken and triturated with 0.2% v/v of tween 80 as a suspending agent and final volume was made to 10 mL for respective concentration with PBS.
Experimental Methodology58
- 10 mL of control, standard and extract of each concentration were taken in different Petri dishes.
- Six parasites were taken in each different Petri dishes.
- Time taken for paralysis for each parasite was recorded.
- Time taken for death for each parasite was recorded.
RESULT & DISCUSSION: PHYTOCHEMICAL SCREENING
Extraction
Extraction is the separation of medicinally active portions of plant (and animal) tissues using selective solvents through standard procedures. The products so obtained from plants are relatively complex mixtures of metabolites, in liquid or semisolid state or (after removing the solvent) in dry powder form and are intended for oral or external use1.
As a result of modern extraction, isolation techniques and pharmacological testing procedure, new plant drugs usually find their way into medicine as purified substances rather than in the form galenical preparations. The precise mode of extraction naturally depends on the texture and water content of the plant material being extracted. There are two type of procedure for obtaining organic constituents–
- Cold extraction
- Hot extraction.
The extract obtained is then concentrated and constituents are separated by different methods such as chromatography. As a standard precaution against loss of material, concentrated extracts should be stored in the refrigerator.
25.7 gm crude extract of Aristolochia tagala cham was obtained from 650 gm of dried powder material. Therefore, yield value (%) =![]() × 100 %
× 100 %
= 4 %
Partitioning
Partitioning is a process in which liquid–liquid extraction is done to separate the components of a mixture between two immiscible solvent phases of different densities60. Typically, one of the phases will be aqueous, and the other a non–polar lipophilic organic solvent such as ether, dichloromethane, chloroform, or ethyl acetate60. Partitioning processes include removal of soluble compounds from a solid matrix, such as occurs in brewing coffee or tea, or in decaffeinating coffee with liquid carbon dioxide. In the organic chemistry laboratory, however, partitioning almost always refers to the transfer of compounds from one liquid solvent to another liquid solvent60.
25.7 gm crude ethanolic extract was subjected to fractional separation using four different solvent and the amount of extract is given beow.
Table: 5.1: Amount of extract in different solvent.
| Extract name | Amount (gm) |
| n–hexane | 15.6 gm |
| DCM | 1 gm |
| Ethyl acetate | 700 mg |
| Water | 7 gm |
Phytochemical screening
The plant kingdom represents an enormous reservoir of biologically active compounds with various chemical structures and protective/disease preventive properties (Phytochemical). This Phytochemical, often secondary metabolites present in smaller quantities in higher plants, include the alkaloids, steroids, flavonoids, tannins, and many others. Nearly 50% of drugs used in medicine are of plant origin, and only a small fraction of plants with medicinal activity has been assayed. The phytochemicals isolated are then screened for different types of biological activity44.
The experimental findings from the study of Aristolochia tagala cham plant various fraction showed the presence or absence of the following organic compounds as listed below:
Table: 5.2: Result of chemical group test of Aristolochia tagala
| Constituents | n–hexane fraction | DCM fraction | Ethyl acetate fraction | Water fraction |
| Reducing sugar | + | + | _ | _ |
| Tannins | + | + | + | + |
| Flavonoids | + | + | + | _ |
| Saponins | _ | _ | _ | + |
| Gums | _ | + | _ | _ |
| Steroids | + | + | _ | _ |
| Alkaloids | + | + | _ | _ |
| Glycosides | _ | + | _ | _ |
| Protein | + | + | + | _ |
| Acidic compounds | + | + | + | _ |
| Terpenoids | + | + | + | _ |
| Phenolic compounds | + | + | + | _ |
+ = Presence; – = Absence
The experimental findings from the study showed that–
1. n–hexane extract of Aristolochia tagala has organic compounds like–
Tannin, Flavonoid, Alkaloid, Protein, Terpenoid, Reducing sugar, Phenolic and Acidic compounds.
2. DCM extract of Aristolochia tagala cham has organic compounds like–
Reducing sugar, Tannin, Flavonoid, Steroids, Glycosides, Protein, Terpenoid, Phenolic and Acidic compounds.
3. Ethyl acetate extract of Aristolochia tagala cham has organic compounds like–
Tannin, Flavonoid, Protein, Terpenoid, Phenolic and Acidic compounds.
4. Water extract of Aristolochia tagala cham has organic compounds like–
Tannin, Saponin, Phenolic compounds.
In the current study, phytochemical properties of Aristolochia tagala cham were evaluated. Phytochemical group test of the extracts of Aristolochia tagala plants revealed the presence of phytochemical compounds such as phenolic, tannins, flavonoids, terpenoids, and alkaloids21. In Aristolochia tagala Cham methanol extract it was observed that it contained compounds such as phenolics, tannins, flavonoids, terpenoids, etc., exhibited antioxidant capacity21. A wide variety of flavonoids are present in the 95% methanol A. tagala dried leaves extract. The presence of flavonoids gives credence to the use of A. tagala in treating fever and dysentery24. Phenols like gentisic acid, pyragallol, 2–methyl resorcinol, orcinol, catechol and sugars like ribose, rhamnose, galactose, and glucose were identified in A. tagala. leaves. Naturally occurring phenolic compounds have free radical scavenging properties38. The result obtained is compatible with one of the uses of A.tagala preparation in traditional medicine for rheumatism, cancer, hepatic disorder and aging disease .The alkaloid, berberine was identified leaf samples of A. tagala. In vitro experimental and clinical results indicate that berberine as an excellent disinfectant and use in tooth ache39. GCMS analysis of the plant samples showed the presence of sesquiterpenes, which decrease the progression of cancer25. The results of the study showed that Aristolochia species demonstrated a strong antioxidant, anticancer and antibacterial activity and deserve detailed pharmacological studies32.
They are precursors for the synthesis of useful drugs and are safe for human health58. Most of the phytochemicals such as phenols, tannin, glycoside terpenoid and steroids can reduce bowel syndrome, blood sugar and also show anthelmintic action59.
The phytochemical tests carried out on Aristolochia tagala Cham extract revealed the presence of several important constituents which might be responsible for its traditional medicinal uses.
RESULT & DISCUSSION: ANTIOXIDANT ASSAY
DPPH Free Radical Scavenging Activity Test
Free radicals are metastable chemical species which, after being generated in vivo as byproducts of various biochemical reactions, tend to rob electrons from the molecules in the immediate surroundings in order to replace their own losses. These radicals may be envisaged as molecular sharks, which if not scavenged effectively on time, are capable of damaging crucial bio–molecules including those present in cell membranes, mitochondria, DNA etc. and thus predisposing various pathophysiological states 50 . The role of free radicals, especially of the so called ‘reactive oxygen species’ (ROS), has been well–established in the pathogenesis of many disease conditions such as rheumatoid arthritis, hemorrhagic shock, cardiovascular disorders, cystic fibrosis, some metabolic disorders, neurodegenerative diseases (e.g. Parkinsonism, Alzheimer’s disease), gastrointestinal ulcerogenesis, AIDS and even early senescence61 . Antioxidants can take the form of enzymes in the body, vitamin supplements, or industrial additives and act as radical scavengers. They are routinely added to metals, oils, foodstuffs, and other materials to prevent damage caused by free radicals. Antioxidants halt the chain reaction initiated by free radicals. Some antioxidants donate electrons to stabilize and neutralize the dangerous free radicals. Other antioxidants work against the molecules that form free radicals, destroying them before they can begin the domino effect that leads to oxidative damage62. Several plant extracts and different classes of phytochemicals have been found to have quite prominent antioxidant activity. The objective of the present study was to investigate both the qualitative and quantitative in vitro antioxidant activity of various fraction of Aristolochia tagala .
Test for Qualitative Antioxidant Activity
Optimum diluted stock solutions are spotted on pre–coated silica gel TLC plates and the plates are developed in solvent systems of different polarities (polar, medium polar and non–polar) to resolve polar and non–polar components of the extract. The plates are dried at room temperature and are sprayed with 0.004% 2, 2–diphenyl–1–picryl hydrazyl (DPPH) in ethanol. DPPH forms deep pink color when it is dissolved in ethanol. When it is sprayed on the chromatogram of the extract, it forms pale yellow or yellow color which indicates the presence of antioxidants. Bleaching of DPPH by the resolved bands is observed for 10 minutes and the color changes (yellow on purple background) are noted63.
Thin Layer Chromatography (TLC)
Thin Layer Chromatography (TLC) is a chromatographic technique that is useful for separating organic compounds. Because of the simplicity and rapidity of TLC, it is often used to monitor the progress of organic reactions and to check the purity of products. TLC is a method of analysis in which the stationary phase (a finely divided solid) is spread as a thin layer on a rigid supporting plate and a liquid (mobile phase) is allowed to migrate across the surface of the plate. In this process, the separation takes place on a planar surface and the mobile phase flow across the plate by capillary action. The main purpose of this technique is to detect polar, non– polar and medium polar groups present in the plant extract under UV light at short (254nm) and long (360nm) wavelength64.
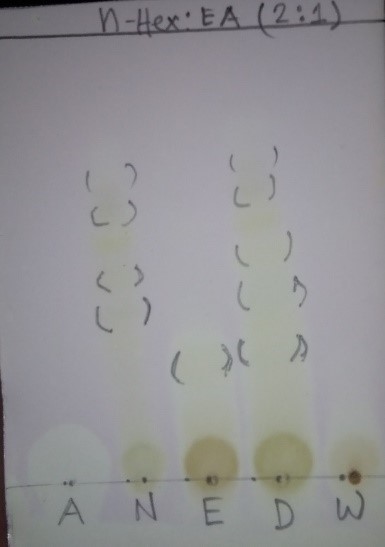
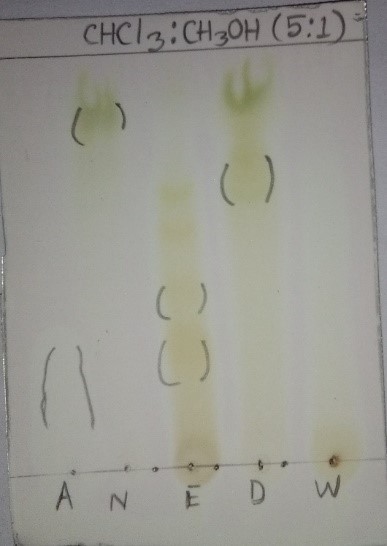
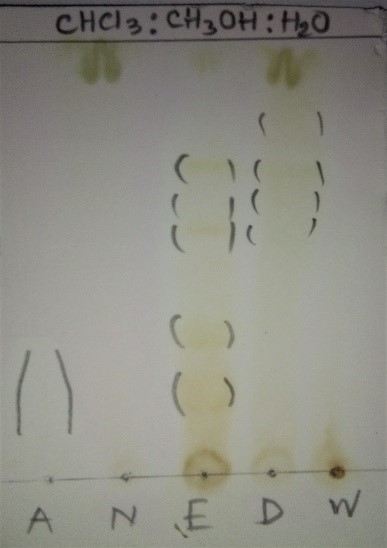
Figure 6.1: Comparison of TLC plate for different fraction of Aristolochia tagala cham extract with Standard (Ascorbic acid) after applying 0.004% DPPH solution of ethanol.
TLC analysis for antioxidant constituents
Antioxidant constituents of studied leaves were analysis by TLC. Phenolic compounds such as phenolic acid, flavonoid and tannin are commonly found in plants, and they have been reported to have multiple biological effects, including antioxidant activity65-68. Different fractions of ethanol extract were subjected to TLC. The plates were developed in n–hexane: Ethyl acetate (2:1), CHCl3: CH3OH (5:1), CHCl3: CH3OH: H2O (40:10:1). All developed plates were sprayed with 0.004% DPPH reagent to give antioxidant constituents. Plate sprayed with DPPH reagent showed the present of some spots, with yellow color corresponding with antioxidant behavior. The active antioxidant constituents of the extract were detected in sunlight as yellow spots produced via reduction of DPPH by resolved bands against purple back ground on the TLC plate69-70. Ascorbic acid was used as a reference compound.
Test for Quantitative Antioxidant activity (DPPH free Radical Scavenging)
The antioxidant potential of the ethanol extract is determined on the basis of their scavenging activity of the stable 2, 2–diphenyl–1–picryl hydrazyl (DPPH) free radical. DPPH is a stable free radical containing an odd electron in its structure and usually utilized for detection of the radical scavenging activity in chemical analysis. The aliquots of the different concentrations (8–512 μg/mL) of the extract were added to 3 mL of 0.004% w/v solution of DPPH. Absorbance at 517 nm was determined after 30 min, and IC50 (Inhibitory conc. 50%) is determined. IC50 value denotes the concentration of sample required to scavenge 50% of the DPPH free radicals44.
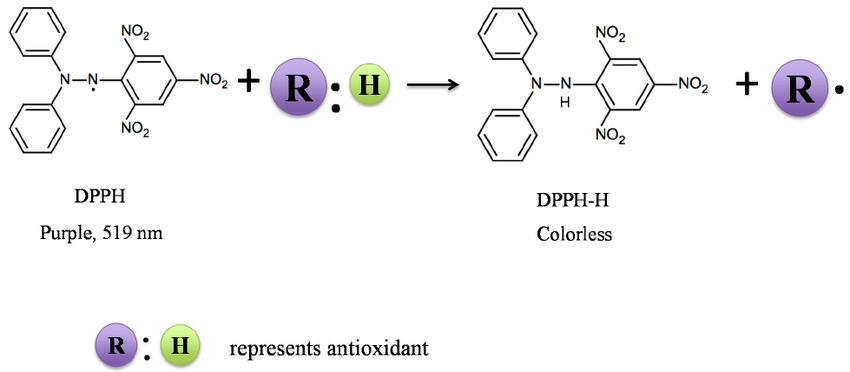
Figure 6.2: A typical free radical scavenging reaction of DPPH
Data Presentation
Table: 6.1: The results from the DPPH free radical scavenging of ascorbic acid
| Conc. (μg/mL) | Log conc. | Abs. 1 | Abs. 2 | Avg. Absorbance | %inhibition | IC50 (μg/mL) |
| Control | 0 | 0.700 | 0.705 | 0.703 | 0 | 30.20 |
| 8 | 0.90 | 0.507 | 0.510 | 0.508 | 27.74 | |
| 16 | 1.20 | 0.471 | 0.473 | 0.472 | 32.86 | |
| 32 | 1.51 | 0.418 | 0.421 | 0.419 | 40.33 | |
| 64 | 1.81 | 0.309 | 0.311 | 0.310 | 55.90 | |
| 128 | 2.11 | 0.212 | 0.215 | 0.213 | 69.70 | |
| 256 | 2.41 | 0.170 | 0.174 | 0.172 | 75.53 | |
| 512 | 2.71 | 0.102 | 0.106 | 0.104 | 85.21 |
Figure 6.3: Absorbance vs. log concentration graph for standard (ascorbic acid)
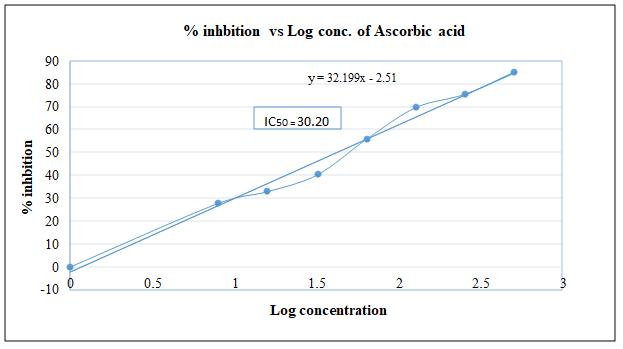
Figure 6.4: % inhibition DPPH vs. concentration graph for standard (ascorbic acid)
Table 6.2: DPPH Scavenging Assay of Aristolochia tagala cham n–hexane fraction
| Conc. (μg/mL) | Log conc. | Abs. 1 | Abs. 2 | Avg. Absorbance | %inhibition | IC50 (μg/mL) |
| Control | 0 | 0.700 | 0.705 | 0.703 | 0 | 112.20 |
| 8 | 0.90 | 0.647 | 0.649 | 0.648 | 7.82 | |
| 16 | 1.20 | 0.620 | 0.622 | 0.621 | 11.66 | |
| 32 | 1.51 | 0.540 | 0.546 | 0.543 | 22.76 | |
| 64 | 1.81 | 0.423 | 0.424 | 0.424 | 39.69 | |
| 128 | 2.11 | 0.342 | 0.351 | 0.347 | 50.64 | |
| 256 | 2.41 | 0.239 | 0.243 | 0.241 | 65.72 | |
| 512 | 2.71 | 0.126 | 0.120 | 0.123 | 82.50 |
Figure 6.5: Absorbance vs. log concentration graph for A. tagala n–hexane fraction.
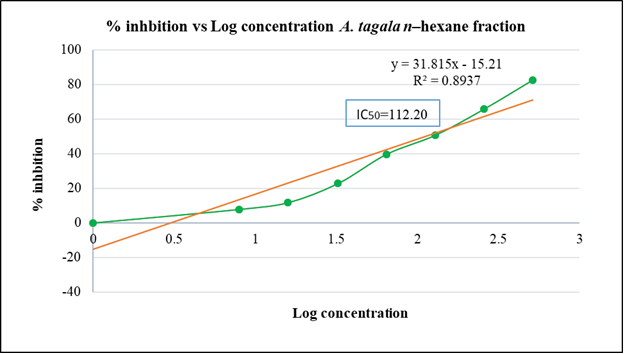
Figure 6.6: % inhibition DPPH vs. concentration graph for A. tagala cham n–hexane fraction
Table 6.3: DPPH Scavenging Assay of Aristolochia tagala aerial DCM parts extract
| Conc.(μg/ml) | Log conc. | Absorbance 1 | Absorbance 2 | Average Absorbance | % of Inhibition | IC50 (μg/ml) |
| Control | 0 | 0.700 | 0.705 | 0.703 | ––– | 141.24 |
| 8 | 0.90 | 0.531 | 0.529 | 0.530 | 24.61 | |
| 16 | 1.20 | 0.488 | 0.476 | 0.482 | 31.43 | |
| 32 | 1.51 | 0.347 | 0.321 | 0.334 | 52.49 | |
| 64 | 1.81 | 0.307 | 0.309 | 0.308 | 56.19 | |
| 128 | 2.11 | 0.269 | 0.264 | 0.267 | 62.02 | |
| 256 | 2.41 | 0.208 | 0.205 | 0.207 | 70.55 | |
| 512 | 2.71 | 0.140 | 0.146 | 0.143 | 79.66 |
Figure 6.7: Absorbance vs. log concentration graph for A. tagala Cham DCM fraction
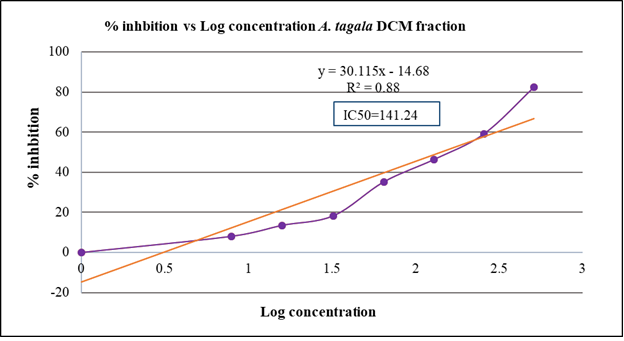
Figure 6.8: % inhibition DPPH vs. concentration graph for A. tagala Cham DCM fraction
Table 6.4: DPPH Scavenging Assay of A. tagala ethyl acetate fraction
| Conc.(μg/ml) | Log conc. | Absorb. 1 | Absorb. 2 | Average Absorbance | % of Inhibition | IC50 (μg/ml) |
| Control | 0 | 0.700 | 0.705 | 0.703 | 0 | 72.44 |
| 8 | 0.90 | 0.626 | 0.618 | 0.622 | 8.14 | |
| 16 | 1.20 | 0.595 | 0.593 | 0.594 | 10.93 | |
| 32 | 1.51 | 0.540 | 0.548 | 0.544 | 15.93 | |
| 64 | 1.81 | 0.451 | 0.455 | 0.453 | 25 | |
| 128 | 2.11 | 0.346 | 0.344 | 0.345 | 35.81 | |
| 256 | 2.41 | 0.275 | 0.269 | 0.272 | 43.14 | |
| 512 | 2.71 | 0.151 | 0.160 | 0.156 | 54.71 |
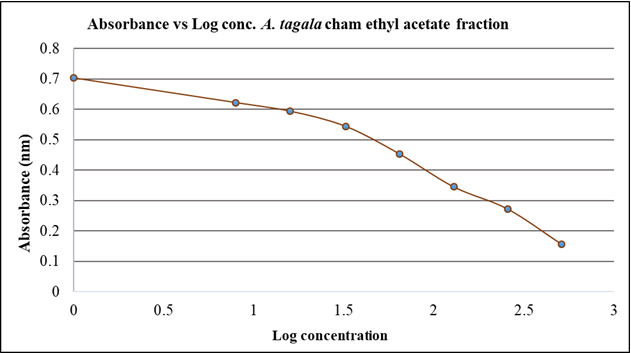
Figure 6.9: Absorbance vs. log concentration graph for Aristolochia tagala ethyl acetate fraction
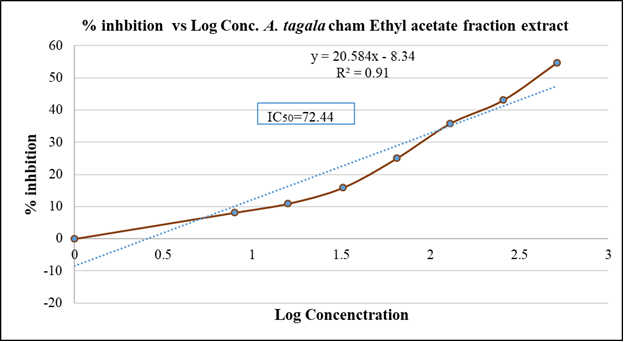
Figure 6.10: Absorbance vs. log concentration graph for Aristolochia tagala cham Ethyl acetate fraction.
Table 6.5: DPPH Scavenging Assay of Aristolochia tagala cham water fraction
| Conc. (μg/mL) | Log conc. | Abs. 1 | Abs. 2 | Avg. Absorbance | %inhibition | IC 50 (μg/mL) |
| Control | 0 | 0.700 | 0.705 | 0.703 | 0 | 231.74 |
| 8 | 0.90 | 0.659 | 0.662 | 0.661 | 6.05 | |
| 16 | 1.20 | 0.638 | 0.634 | 0.636 | 9.53 | |
| 32 | 1.51 | 0.605 | 0.607 | 0.606 | 13.80 | |
| 64 | 1.81 | 0.526 | 0.528 | 0.527 | 25.04 | |
| 128 | 2.11 | 0.435 | 0.437 | 0.436 | 37.98 | |
| 256 | 2.41 | 0.332 | 0.332 | 0.332 | 52.77 | |
| 512 | 2.71 | 0.141 | 0.143 | 0.142 | 79.80 |
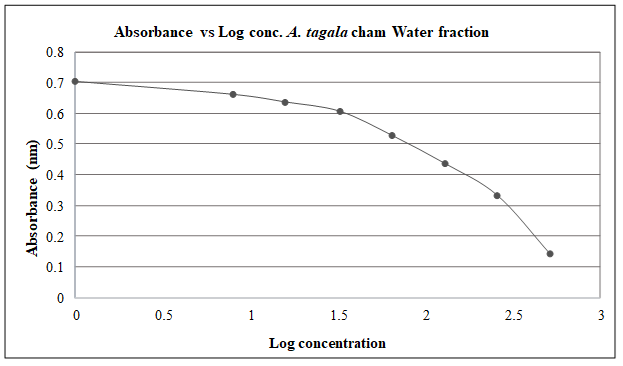
Figure 6.11: Absorbance vs. log concentration graph for Aristolochia tagala cham Water fraction.
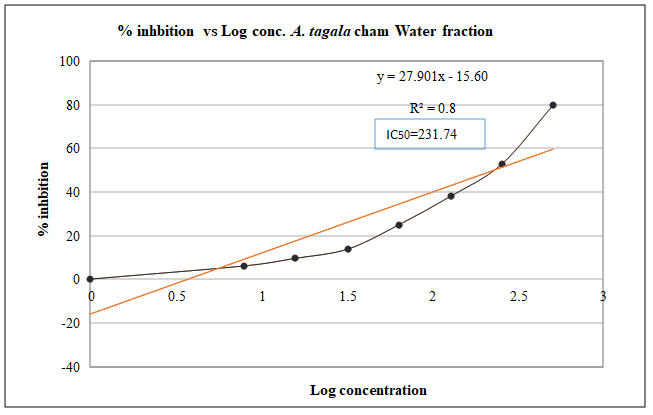
Figure 6.12: % inhibition DPPH vs. concentration graph for Aristolochia tagala Water fraction
Table 6.6: DPPH scavenging capacity of Ascorbic acid and different fraction of Aristolochia tagala cham extract
| Name of extract | IC50 (μg/ml) |
| Ascorbic acid | 30.20 |
| n–hexane | 112.20 |
| DCM | 141.24 |
| Ethyle acetate | 72.44 |
| Water | 231.74 |
A rapid, simple and inexpensive method to measure antioxidant capacity of plant extract involves the use of the free radical, DPPH. DPPH is widely used to test the ability of compounds to act as free radical scavengers or hydrogen donors, and to evaluate antioxidant activity. It has also been used to quantify antioxidants in complex biological systems in recent years. The DPPH method can be used for solid or liquid samples and is not specific to any particular antioxidant component, but applies to the overall antioxidant capacity of the sample19 .
Different fraction s of Aristolochia tagala Cham were subjected to DPPH radical scavenging assay. All extracts showed antioxidant activity which, in the present case, is directly proportional to the concentration. At 512 µg/ml, Aristolochia tagala Cham ethyl acetate fraction s exhibited the highest activity, comparable to the reference compound ascorbic acid. It also showed the lowest IC50 value (72.24 µg/ml), which denotes the highest antioxidant activity among the four extracts. A low IC50 value indicates high antioxidant activity70-71. In Aristolochia tagala Cham methanol extract it was observed that it contained compounds such as phenolics, tannins, flavonoids, terpenoids, etc., exhibited antioxidant capacity32. Naturally occurring phenolic compounds have free radical scavenging properties.25 Among four fraction s we found better quantity of phenolic, flavonoid and tannin compounds in Ethyl acetate fraction so it gives better antioxidant activity than other.
These plants contain aristolochic acid and terpenoids. The antioxidative effect is mainly due to phenolic components, such as phenolic acids, and phenolic diterpenes (Shahidi et al., 1992). The antioxidant activity of phenolic compounds is mainly due to their redox properties, which can play an important role in absorbing and neutralizing free radicals, quenching singlet and triplet oxygen, or decomposing peroxides (Osawa, 1994). In A. longa the total phenolics were estimated as 1.47 mg and free radical scavenging activity of these phenols were estimated by Djeridane et al. (2006). Phenolic compounds are also thought to be capable of regenerating endogenous tocopherol, in the phospholipid bilayer of lipoprotein particles, back to its active antioxidant form. They are also known to inhibit various types of oxidizing enzymes. These potential mechanisms of antioxidant action make the diverse group of phenolic compounds an interesting target in the search for health-beneficial phytochemicals (Halliwell and Gutteridge, 1989; Hall and Cuppett, 1997).
Estimation of Total Phenolic Content
Phenolics or polyphenols are secondary plant metabolites that are ubiquitously present in plants and plant products. Many of the phenolics are responsible for reduced risk of developing chronic diseases (cardiovascular disease, cancer, diabetes, etc.), due to their antioxidant activities. Phenolic compounds contribute to the overall antioxidant activities of plants mainly due to their redox properties. Generally, the mechanisms of phenolic compounds for antioxidant activity are neutralizing lipid free radicals and preventing decomposition of hydroperoxides into free radicals72.
Table 6.7: UV Absorbance of Gallic acid (standard) at 765 nm.
| Concentration (mg/ml) | Absorbance 1 | Absorbance 2 | Average |
| 0.15 | 0.774 | 0.765 | 0.769 |
| 0.1 | 0.636 | 0.624 | 0.63 |
| 0.08 | 0.351 | 0.352 | 0.351 |
| 0.06 | 0.302 | 0.307 | 0.305 |
| 0.04 | 0.18 | 0.178 | 0.179 |
| 0.02 | 0.087 | 0.086 | 0.087 |
Figure 6.13: Total phenolic content determination of Aristolochia tagala extract with the help of galic acid standard calibration curve.
Table 6.8: UV absorbance of sample at 765 nm.
| Sample extract | 1st Reading | 2nd reading | Average |
| n–hexane extract | 0.451 | 0.460 | 0.456 |
| DCM extract | 0.652 | 0.669 | 0.661 |
| Ethyl acetate extract | 0.317 | 0.314 | 0.316 |
| Water extract | 0.510 | 0.534 | 0.522 |
Table 6.9: Determination of phenolic content of various fraction of Aristolochia tagala plant extracts.
|
Sample |
Average Absorbance at 765 | GAE | TPC (mg GAE/g) |
| n–hexane extract | 0.456 | 0.088 | 88 |
| DCM extract | 0.661 | 0.124 | 124 |
| Ethyl acetate extract | 0.316 | 0.0621 | 62.01 |
| Water extract | 0.522 | 0.099 | 99 |
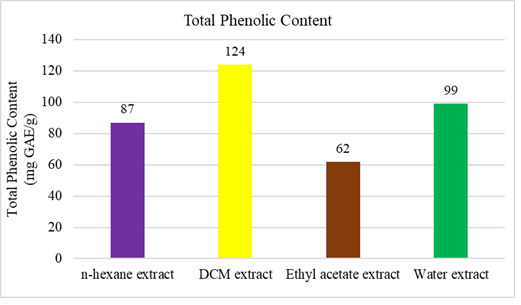
Fig.6.14: Total phenolic content of Aristolochia tagala extract.
Estimation of Total Flavonoid Content
Flavonoids (or bioflavonoids) (from the Latin word flavus meaning yellow, their color in nature) are a class of plant secondary metabolites. These are the most common group of polyphenolic compounds that are found ubiquitously in plants. These are widely distributed in plant fulfilling many functions73. Flavonoids and other plant phenolics are especially common in leaves, flowering tissues and woody parts such as stems and bark. They are important in plant for normal growth development and defense against infection and injury73. Flavonoids are the most important pigments for flower coloration producing yellow or red/blue pigmentation in petals. Those colors are a mean to attract pollinator animals. They also protect plants from attack by microbes and insects. These plant secondary metabolites also show anti–allergic, anti–inflammatory, anti–microbial and anticancer activity74. Researchers have become interested in flavonoids and other phenolic for their medicinal properties, especially their potential role in the prevention of cancer and heart diseases75.
Table 6.10: UV Absorbance of Quercetin (standard) at 510 nm.
| Concentration (mg/ml) | Absorbance 1 | Absorbance 2 | Average |
| 1 | 0.774 | 0.765 | 0.770 |
| 0.75 | 0.636 | 0.624 | 0.63 |
| 0.50 | 0.351 | 0.352 | 0.352 |
| 0.25 | 0.302 | 0.307 | 0.305 |
| 0 | 0.18 | 0.178 | 0.179 |
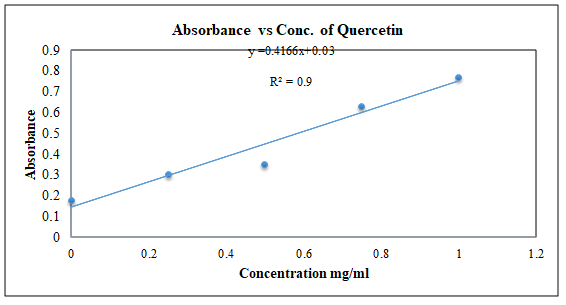
Figure 6.15: Total Flavonoid content determination of Aristolochia tagala extract with the help of Quercetin standard calibration curve.
Table 6.11: UV Absorbance of Aristolochia tagala at 510 nm
| Sample extract | 1st Reading | 2nd reading | Average |
| n–hexane extract | 0.472 | 0.480 | 0.476 |
| DCM extract | 0.174 | 0.180 | 0.177 |
| Ethyl acetate extract | 0.235 | 0.241 | 0.238 |
| Water extract | 0.031 | 0.035 | 0.033 |
Table 6.12: Determination of Flavonoid content of Aristolochia tagala extracts
| Sample | Average absorbance at 510 nm | QE | TFC (mg QE/g) |
| n–hexane extract | 0.476 | 1.078012 | 1078 |
| DCM extract | 0.177 | 0.360298 | 360 |
| Ethyl acetate extract | 0.238 | 0.506721 | 507 |
| Water extract | 0.033 | 0.014642 | 15 |
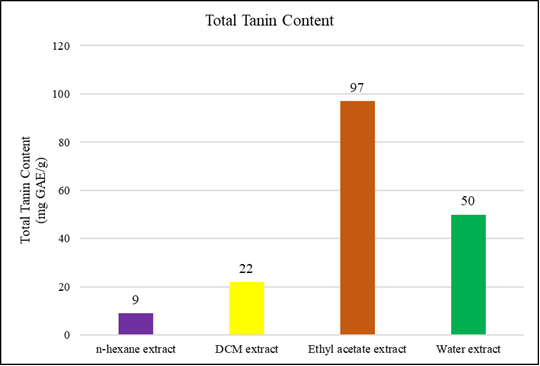
Fig.6.16: Total Flavonoid content of Aristolochia tagala extract.
Estimation of Total Tannin Content
Tannin is an astringent, bitter plant polyphenolic compound that binds to and precipitates proteins and various other organic compounds including amino acids and alkaloids. The tannin compounds are widely distributed in many species of plants, where they play a role in protection from predation, and perhaps also as pesticides, and in plant growth regulation65. Tannins have marked anti–tumor, anti–viral, and anti–HIV activities along with inhibition of lipid peroxidation and plasmin, mediation of DNA nicking and amelioration of renal failure etc66.
Table 6.13: UV Absorbance of Gallic acid (standard) at 725 nm.
| Concentration ( mg/ml) | Absorbance 1 | Absorbance 2 | Average |
| 0.5 | 0.560 | 0.558 | 0.559 |
| 0.4 | 0.479 | 0.475 | 0.477 |
| 0.3 | 0.346 | 0.344 | 0.345 |
| 0.2 | 0.265 | 0.267 | 0.266 |
| 0.1 | 0.169 | 0.170 | 0.170 |
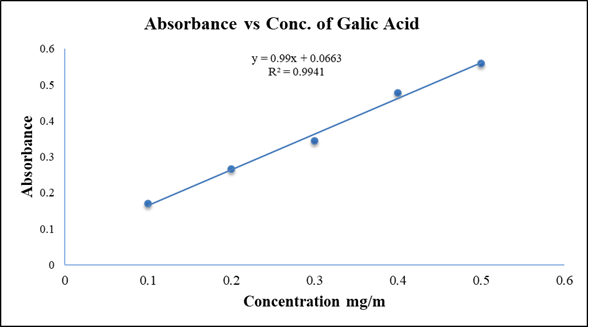
Fig.6.17: Total Tannin content determination of extracts of Aristolochia tagala with the help of Gallic acid standard calibration curve
Table 6.14: UV Absorbance of sample Aristolochia tagala at 725 nm
| Sample extract | 1st Reading | 2nd reading | Average |
| n–hexane extract | 0.076 | 0.075 | 0.076 |
| DCM extract | 0.096 | 0.082 | 0.089 |
| Ethyl acetate extract | 0.162 | 0.164 | 0.163 |
| Water extract | 0.116 | 0.116 | 0.116 |
Table 6.15: Determination of Tannin content of various fraction of Aristolochia tagala plant extracts
| Sample | Average Absorbance at 725 | GAE | TTC (mg GAE/g) |
| n–hexane extract | 0.0755 | 0.009293 | 9 |
| DCM extract | 0.089 | 0.022929 | 23 |
| Ethyl acetate extract | 0.163 | 0.097677 | 98 |
| Water extract | 0.116 | 0.050202 | 50 |
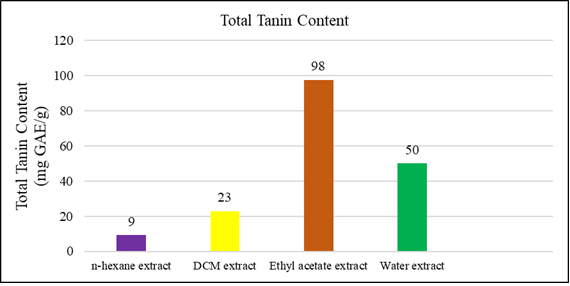
Fig.6.18: Total Tanin content of Aristolochia tagala extract
Different fractions of Aristolochia tagala Cham extracts have different TPC, TFC, and TTC levels [Figure 6.14, 6.16, 6.18.] TPC in different fractions extracts of A. tagala plant was estimated through measure blue color intensity formed at λmax 765 nm. The maximum TPC was obtained in DCM (124 mg GAE/g of extract), followed by n–hexane (88 mg GAE/g of extract), aqueous (99 mg GAE/g of extract), and ethyl acetate (62 mg GAE/g of extract). TFC in the plant extracts studied by determining absorbance at 510 nm λmax. Maximum flavonoid content was obtained in n–hexane (1078 mg QE /g of extract) followed by ethyl acetate (507 mg QE /g of extract), DCM (360 mg QE /g of extract) and aqueous (15 mg QE/g of extract)70. TTC in different fractions extracts of A. tagala cham plant was estimated through measure absorbance at λmax 725 nm. The maximum TTC was obtained in ethyl acetate (97 mg GAE/g of extract), followed by aqueous (50 mg GAE/g of extract), DCM (23 mg GAE/g of extract), and n–hexane (9 mg GAE/g of extract). In Aristolochia tagala Cham methanol extract it was observed that it contained compounds such as phenolics, tannins, flavonoids, terpenoids, etc., exhibited antioxidant capacity. The roots of A. tagala crude aqueous–methanol extract also contain aristolochic acid I, aristolactam IIIa, beta–sitosterol, kaempferol, and stigmasterol35-36. A wide variety of flavonoids are present in the 95% methanol A. tagala dried leaves extract . The presence of flavonoids gives credence to the use of A.tagala in treating fever and dysentery25. Phenols like gentisic acid, pyragallol, 2–methyl resorcinol, orcinol, catechol and sugars like ribose, rhamnose, galactose, and glucose were identified in A. tagala. leaves. Naturally occurring phenolic compounds have free radical scavenging properties38. A. bracteolata and A. indica contains high amount of phenols and flavonoids 76. The result obtained is compatible with one of the uses of A.tagala preparation in traditional medicine for rheumatism, cancer, hepatic disorder and aging disease .The alkaloid, berberine was identified leaf samples of A. tagala. In vitro experimental and clinical results indicate that berberine as an excellent disinfectant and use in tooth ache39. The results of the study showed that Aristolochia species demonstrated a strong antioxidant, anticancer and antibacterial activity and deserve detailed pharmacological studies32.
RESULT & DISCUSSION: EVALUATION OF ANTIDIARRHEAL ACTIVITY
Diarrhea is an alteration in the normal intestinal motility as well as bowel movement, characterized by increased frequency of bowel sound and movement, wet stool with or without blood, abdominal pain and discomfort with weakness. Clinically it is used to describe increased liquidity of stool, usually associated with increased frequency. Regardless of the understanding causes, treatment and prevention of diarrheal diseases, an estimated 4.6 million people, with 2.5 million children, die from diarrhea every year, particularly in developing countries76-77. Diarrhea may be acute or chronic. Acute diarrhea being the most common is usually caused by an infectious agent, even though drugs, poisons or acute inflammatory reactions can contribute a lot77.
Likely, antibiotics and gut motility suppressing agents bid the other treatment option, wherein reverse dehydration, shorten the length of illness and reduce the period of time when an individual is infected78. Treatment with pharmacological agents that are pathogen specific or that suppress severe symptoms would be of benefit to patients suffering from prolonged diarrhea. Despite the availability of a vast spectrum of approaches for diarrheal management, a vast majority of the people of Bangladesh have been known to treat diarrhea with a variety of medicinal plants.
Diarrhea was considered by the presence of stool or any fluid material that stained the blotting paper placed in every cage lined with the floor. Time taken before the first defecation was considered as the ‘Latent period’. The latent period and stool count after 4 hours of test group were compared with control group to evaluate antidiarrheal activity. Antidiarrheal agents increase latent period and decrease total stool count79.
Table 7.1: Experimental profile to assess the effect of various fractions of extract in castor oil induced diarrhea in mice.
| Animal Group | Treatment | Dose (Per Kg–body weight) | Rout of administration |
| I (Control) | 1% Tween –80 In water | 10 ml | Oral |
| II (Standard) | Loperamide | 3 mg | Oral |
| III (Test group–I) | n–hexane fraction | 250 mg | Oral |
| IV (Test group–II) | n–hexane fraction | 500 mg | Oral |
| V (Test group–III) | DCM fraction | 250 mg | Oral |
| VI (Test group–IV) | DCM fraction | 500 mg | Oral |
| VII (Test group–V) | Ethyl acetate fraction | 250 mg | Oral |
| VIII (Test group–VI) | Ethyl acetate fraction | 500 mg | Oral |
| IX (Test group–VII) | Water fraction | 250 mg | Oral |
| X (Test group–VIII) | Water fraction | 500 mg | Oral |
Table7.2: Animal profile and dose used in castor oil induced diarrhea in mice.
| Group | Administerd (dose) | Mice no. | Weight (gm) | Amount admin. (ml) |
| I (Control) | _ | C1 | 24 | 0.24 |
| C2 | 22 | 0.22 | ||
| C3 | 23 | 0.23 | ||
| C4 | 25 | 0.25 | ||
| II (Standard) | Loperamide (3 mg/kg) | S1 | 23 | 0.23 |
| S2 | 26 | 0.26 | ||
| S3 | 24 | 0.24 | ||
| S4 | 24 | 0.24 | ||
| III (Test group–I) | n–hexane fraction (250 mg/kg) | T1 | 22 | 0.22 |
| T2 | 24 | 0.24 | ||
| T3 | 23 | 0.23 | ||
| T4 | 26 | 0.26 | ||
| IV (Test group–II) | n–hexane fraction (500 mg/kg) | T1 | 24 | 0.24 |
| T2 | 25 | 0.25 | ||
| T3 | 23 | 0.23 | ||
| T4 | 25 | 0.25 | ||
| V (Test group–III) | DCM fraction (250 mg/kg) | T1 | 24 | 0.24 |
| T2 | 25 | 0.25 | ||
| T3 | 26 | 0.26 | ||
| T4 | 24 | 0.24 | ||
| VI (Test group – IV) | DCM fraction (500 mg/kg) | T1 | 25 | 0.25 |
| T2 | 23 | 0.23 | ||
| T3 | 25 | 0.25 | ||
| T4 | 23 | 0.23 | ||
| VII (Test group –V) | Ethyl acetate fraction (250 mg/kg) | T1 | 22 | 0.22 |
| T2 | 24 | 0.24 | ||
| T3 | 23 | 0.23 | ||
| T4 | 25 | 0.25 | ||
| VIII (Test group–VI) | Ethyl acetate fraction (500 mg/kg) | T1 | 21 | 0.21 |
| T2 | 23 | 0.23 | ||
| T3 | 25 | 0.25 | ||
| T4 | 24 | 0.24 | ||
| IX (Test group–VII) | Water fraction (250 mg/kg) | T1 | 22 | 0.22 |
| T2 | 24 | 0.24 | ||
| T3 | 23 | 0.23 | ||
| T4 | 23 | 0.23 | ||
| X (Test group–VIII) | Water fraction (500 mg/kg) | T1 | 25 | 0.25 |
| T2 | 24 | 0.24 | ||
| T3 | 26 | 0.26 | ||
| T4 | 22 | 0.22 |
Table 7.3: Effect of extract of various fractions of Aristolochia tagala on prolongation of the latent period of castor oil induced diarrhoeal episode in mice.
| Group | Number of mice | Latent period (min) | Mean latent period (min) | SD | SEM |
| I (Control) 1% tween–80 in water | C1 | 31 | 31.25 | 5.8 | 2.89 |
| C2 | 39 | ||||
| C3 | 25 | ||||
| C4 | 30 | ||||
| II (Standard) Loperamide 3 mg/kg | S1 | 165 | 174.75 | 8.18 | 4.09 |
| S2 | 171 | ||||
| S3 | 182 | ||||
| S4 | 181 | ||||
| III (Test group) n–hexane fraction 250 mg/kg | T1 | 88 | 97 | 12.52 | 6.26 |
| T2 | 115 | ||||
| T3 | 96 | ||||
| T4 | 89 | ||||
| IV (Test group) n–hexane fraction 500 mg/kg | T1 | 132 | 120.5 | 21.54 | 10.77 |
| T2 | 145 | ||||
| T3 | 100 | ||||
| T4 | 105 | ||||
| V (Test group) DCM fraction 250 mg/kg | T1 | 79 | 68.75 | 10.97 | 5.48 |
| T2 | 65 | ||||
| T3 | 55 | ||||
| T4 | 76 | ||||
| VI (Test group) DCM fraction 500 mg/kg | T1 | 90 | 92.25 | 6.55 | 3.28 |
| T2 | 102 | ||||
| T3 | 88 | ||||
| T4 | 89 | ||||
| VII (Test group) Ethyl acetate fraction 250 mg/kg | T1 | 42 | 38.75 | 6.95 | 3.47 |
| T2 | 45 | ||||
| T3 | 29 | ||||
| T4 | 39 | ||||
| VIII (Test group) Ethyl acetate fraction 500 mg/kg | T1 | 38 | 57.25 | 13.65 | 6.82 |
| T2 | 62 | ||||
| T3 | 59 | ||||
| T4 | 70 | ||||
| IX (Test group) Water fraction 250 mg/kg | T1 | 26 | 30.75 | 5.12 | 2.56 |
| T2 | 38 | ||||
| T3 | 29 | ||||
| T4 | 30 | ||||
| X (Test group) Water fraction 500 mg/kg | T1 | 46 | 36.5 | 8.22 | 4.11 |
| T2 | 38 | ||||
| T3 | 26 | ||||
| T4 | 36 |
SD– Standard deviation; SEM– Standard error of mean
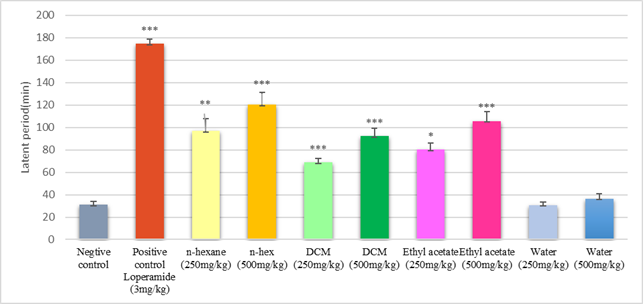
Fig.7.1: Effect of various fraction of Aristolochia tagala cham plant extract on latent period of defecation in castor oil induced diarrheal episode in mice. [p < 0.05(*);p<0.005(**), p < 0.0001(***)]
Table 7.4: Effect of extract of Aristolochia tagala on stool count in castor oil induced diarrheal episode in mice.
| Group | Number of mice | No. of stool after 4 h. | Mean no. of stool | % inhibition 0f defecation | SD | SEM |
| I (Control) 1% tween–80 in water | C1 | 21 | 20.3 | ––– | 2.98 | 1.49 |
| C2 | 17 | |||||
| C3 | 24 | |||||
| C4 | 19 | |||||
| II (Standard) Loperamide 3 mg/kg | S1 | 03 | 3.0 | 85.22 | 0.81 | 0.41 |
| S2 | 02 | |||||
| S3 | 03 | |||||
| S4 | 04 | |||||
| III (Test group) n–hexane fraction 250 mg/kg | T1 | 11 | 10.3 | 49.26 | 1.50 | 0.75 |
| T2 | 09 | |||||
| T3 | 09 | |||||
| T4 | 12 | |||||
| IV (Test group) n–hexane fraction 500 mg/kg | T1 | 07 | 8.3 | 59.11 | 1.26 | 0.63 |
| T2 | 10 | |||||
| T3 | 08 | |||||
| T4 | 08 | |||||
| V (Test group) DCM fraction 250 mg/kg | T1 | 16 | 14.3 | 29.56 | 1.71 | 0.85 |
| T2 | 15 | |||||
| T3 | 12 | |||||
| T4 | 14 | |||||
| VI (Test group) DCM fraction 500 mg/kg | T1 | 12 | 12 | 40.89 | 2.94 | 1.47 |
| T2 | 16 | |||||
| T3 | 11 | |||||
| T4 | 09 | |||||
| VII (Test group) Ethyl acetate fraction 250 mg/kg | T1 | 22 | 17 | 16.25 | 3.37 | 1.68 |
| T2 | 15 | |||||
| T3 | 16 | |||||
| T4 | 15 | |||||
| VII (Test group) Ethyl acetate fraction 250 mg/kg | T1 | 16 | 16.8 | 17.24 | 0.96 | 0.48 |
| T2 | 18 | |||||
| T3 | 16 | |||||
| T4 | 17 | |||||
| IX (Test group) Water fraction 250 mg/kg | T1 | 18 | 19.5 | 3.94 | 1.29 | 0.65 |
| T2 | 21 | |||||
| T3 | 20 | |||||
| T4 | 19 | |||||
| X (Test group) Water fraction 500 mg/kg | T1 | 17 | 16.3 | 19.70 | 2.98 | 1.48 |
| T2 | 13 | |||||
| T3 | 15 | |||||
| T4 | 20 |
SD– Standard deviation; SEM– Standard error of mean
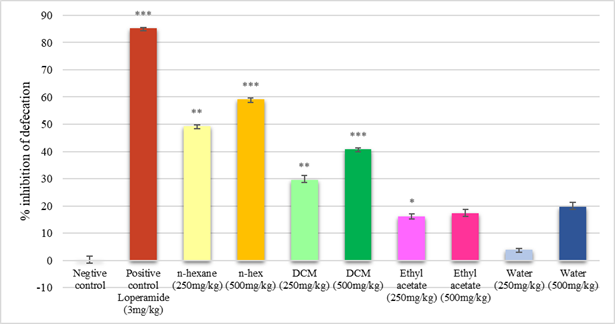
Figure 7.2: Effect of various fraction of Aristolochia tagala cham plant extract on the basis of % inhabitation of defecation in castor oil induced [p < 0.05(*);p<0.005(**), p < 0.0001(***)]
In the present study the antidiarrheal activity of various fraction Aristolochia tagala cham extract were evaluated in castor oil induced diarrheal mice. In the castor oil induced diarrheal mice, of ethanol extract of Aristolochia tagala cham mainly n–hexane and DCM fractions at the doses of 250 and 500 mg/kg body weight of mice significantly decreased the total number of faeces as well as delayed the onset of diarrhea in a dose dependent manner when compared to vehicle–treated negative control group. In this experiment Loperamide was used as positive control for antidiarrheal activity. We compared the antidiarrheal effect of the test extract at 500 mg/kg body weight with the effect of 250 mg/kg body weight dose. We found that the antidiarrheal effect of n–hexane & DCM fraction at dose 500 mg/kg was significantly higher than that with 250 mg/kg dose and the difference is statistically significant (P<0.0001) . This finding further suggests that the test extract exerts antidiarrheal activity in a dose dependent manner. Percent inhibition of defecation of n–hexane fraction at doses 250 and 500 mg/kg body weight was 49.26 and 59.11 and DCM fraction at doses 250 and 500 mg/kg body weight was 29.56 and 40.89 respectively whereas standard loperamide (3 mg/kg) was 85.22.
Medicinal plants have been investigated for their activity in gut motility, intestinal transit, and water absorption or reduce intraluminal fluid accumulation 56, 79. Diarrhea refers to excess passage of watery stools which is caused by decreased consistency or increased frequency of bowel movements. The possible mechanism of diarrhea would be the change in active ion transport system either by increasing chloride secretion or decreasing sodium absorption. It may also include the increase in luminal osmolality, change in intestinal motility and increase in tissue hydrostatic pressure56 . Among the all mechanisms, castor oil induces diarrhea by stimulating intestinal motility and secretory processes 47. Antidiarrheal activity and antidysenteric properties of medicinal plants were found to be due to the presence of tannins, alkaloids, saponins, flavonoids, steroids and/or terpenoids56, 80. These classes of compounds identified in our extract could be responsible for antidiarrheal activity. This can be due to the fact that the steroid present in extract increased the reabsorption of water and Na + and water by decreasing intestinal motility as observed in the decrease of intestinal transit by charcoal meal (Longanga et al., 2000).
Result & Discussion: Evaluation of Antihyperglycemic Activity (OGTT)
Diabetes mellitus, is a chronic metabolic disorder characterized by a high blood glucose concentration–hyperglycemia (fasting plasma glucose > 7.0 mmol/L or plasma glucose > 11.1 mmol/L 2 hours after a meal) and gross derangement in carbohydrate, protein, and fat metabolism – caused by insulin deficiency, often combined with insulin resistance81. It has been reported that the chronic hyperglycemia of diabetes is associated with complications like renal failure, coronary artery disorder, neurological complications, cerebrovascular disease, blindness, limb amputation, long term dysfunctions and failure of various organs and eventually premature death81.
Type 1 diabetes results from inadequate synthesis of insulin by cells of the pancreas, while type II diabetes is characterized primarily by insulin resistance (a condition in which bodies don’t use insulin correctly) or cell dysfunction82. Management of this disease may include lifestyle modifications, diet, exercise, and long term use of oral hypoglycemic agents or insulin therapy. Recently, phyto–medicines gains greater importance compared to synthetic antidiabetic drugs due to several adverse effects of the synthetic drugs. It has been assumed that plant based drugs are considered to be less toxic and free from adverse effects in comparison to modern allopathic medicines.
Postprandial hyperglycemia, an excessive increase of blood glucose within a short period of time caused by absorbing substantial glucose in small intestine and abnormal glycemic control, is an important risk factor for cardiovascular diseases and is involved in the pathogenesis of atherosclerosis83. Ethnobotanical information suggests that about 800 medicinal plants possess hypoglycemic or antidiabetic potential and the bioactive compounds such as glycosides, alkaloids, terpenoids, carotenoids and flavonoids are effective antidiabetic drugs both in preclinical and clinical studies84.
Oral glucose tolerance test is a preliminary in vivo method to evaluate the antidiabetic activity of plant extracts and other test samples. It is a medical test in which glucose is given and blood samples are taken afterward to determine how it is quickly cleared from blood.
At the present study oral glucose tolerance test of different fractions of ethanolic Aristolochia tagala cham. Extract were screened and compared with the standard.
Table 8.1: Data presentation of blood glucose level (mmol/L) of glibenclamide with control.
| Treatment (Per kg body weight) | Blood glucose level ( mmol / L) | |||
| 0 min | 30 min | 90 min | 150 min | |
| Control | 3.9 | 8.9 | 7.7 | 6.7 |
| 5.4 | 8.3 | 6.5 | 4.3 | |
| 5.5 | 6.8 | 6.5 | 4.7 | |
| 4.3 | 13.5 | 8.7 | 6.3 | |
| Average ± SD | 4.78±0.80 | 9.38±2.89 | 7.35± 1.06 | 5.5±1.18 |
| Glibenclamide (10mg/kg) | 3.8 | 6.9 | 1.4 | 4.4 |
| 6.6 | 9.5 | 3.4 | 6.4 | |
| 5.4 | 7.8 | 2 | 5.3 | |
| 3.3 | 4.1 | 3 | 5.8 | |
| Average ± SD | 4.78±1.51 | 7.08± 2.26 | 2.45± 0.9 | 5.48±0.85 |
Table 8.2: Data presentation of blood glucose level (mmol/L) of various fractions of Aristolochia tagala.
| Treatment (Per kg body weight) | Blood glucose level ( mmol / L) | ||||
| 0 min | 30 min | 90 min | 150 min | ||
| n hexane fraction (250 mg/kg) | 4.78 | 8.50 | 6.1 | 6.9 | |
| 5.02 | 9.56 | 4.9 | 5.8 | ||
| 4.88 | 9.60 | 6.4 | 7.4 | ||
| 4.84 | 10.66 | 5.0 | 6.8 | ||
| Average ± SD | 4.88±0.10 | 9.58±0.87 | 5.6± 0.76 | 6.73± 0.67 | |
| n hexane fraction (500 mg/kg) | 4.2 | 7.3 | 6.8 | 5 | |
| 5.2 | 7.4 | 4.6 | 5.1 | ||
| 4.7 | 10.4 | 5.4 | 6.3 | ||
| 3.2 | 5.1 | 3.9 | 4.8 | ||
| Average ± SD | 4.3± 0.85 | 7.55±2.18 | 5.18±1.24 | 5.3± 0.68 | |
| DCM fraction (250 mg/kg) | 7.1 | 10.9 | 6 | 6.9 | |
| 7.6 | 10.5 | 7.2 | 8.8 | ||
| 6.3 | 9.4 | 6.4 | 7.8 | ||
| 7.7 | 9.4 | 6.8 | 7.9 | ||
| Average ± SD | 7.18±.64 | 10.05±0.77 | 6.6±0.52 | 7.85±0.78 | |
| DCM fraction (500 mg/kg) | 7.5 | 9.8 | 6.3 | 7.4 | |
| 5.3 | 7.7 | 4.6 | 6.4 | ||
| 7.5 | 10.2 | 6.4 | 8.5 | ||
| 6.0 | 7.3 | 5.8 | 6.1 | ||
| Average ± SD | 6.58±1.11 | 8.75±1.46 | 5.78±0.83 | 7.1±1.08 | |
| Ethyl acetate fraction (250 mg/kg) | 3.4 | 13.2 | 7.8 | 6.7 | |
| 5.2 | 9.6 | 8.0 | 7.2 | ||
| 11.2 | 10.5 | 7.6 | 6.0 | ||
| 6.1 | 9.4 | 8.2 | 6.7 | ||
| Average ± SD | 6.48±3.34 | 10.68±1.75 | 7.9±0.26 | 6.65±0.49 | |
| Ethyl acetate fraction (500 mg/kg) | 6.3 | 9.6 | 7.2 | 6.3 | |
| 7.8 | 13.5 | 7.6 | 6.5 | ||
| 4.3 | 11.2 | 8.6 | 6.8 | ||
| 7.1 | 12.6 | 8.7 | 7.1 | ||
| Average ± SD | 6.38±1.51 | 11.73±1.7 | 8.03±0.74 | 6.68±0.35 | |
| Water fraction (250 mg/kg) | 4.2 | 7.3 | 9.7 | 5.5 | |
| 5.1 | 11.2 | 9.2 | 5.48 | ||
| 4.4 | 8.7 | 9.7 | 6.42 | ||
| 4.6 | 12.7 | 10.4 | 6.4 | ||
| Average ± SD | 4.68±0.38 | 9.98±0.13 | 9.75±0.40 | 5.48±0.53 | |
| Water fraction (500 mg/kg) | 3.9 | 6.8 | 6.05 | 7.1 | |
| 6.5 | 9.6 | 8.50 | 9.5 | ||
| 5.5 | 7.7 | 6.02 | 7.02 | ||
| 3.2 | 4.2 | 3.63 | 5.5 | ||
| Average ± SD | 4.78±1.50 | 7.08±2.20 | 6.05±1.90 | 7.28±1.60 | |
![Oral glucose tolerance evaluation of Aristolochia tagala Cham different fraction extract compared with standard & control. [p < 0.05(*)]](https://rsisinternational.org/journals/ijrsi/wp-content/uploads/2024/05/Oral-glucose-tolerance-evaluation-of-Aristolochia-tagala-Cham-different-fraction-extract-compared-with-standard-control.png)
Fig.8: Oral glucose tolerance evaluation of Aristolochia tagala Cham different fraction extract compared with standard & control. [p < 0.05(*)]
A.tagala showed significant (p<0.05) antihyperglycemic activity in mice as compared to control groups Glibenclamide. Blood glucose level was appreciably decreased in time dependent manner by the extract.
After oral administration of plant extract 500 mg/kg b.wt. DCM and ethyl acetate fraction showed better activity and blood glucose level were 5.78 mmol/L & 8.03 mmol/L at 90 minutes.
Aqueous and n-hexane fraction lessened blood glucose level 5.18 mmol/L and 6.05 mmol/L at 90 minutes.
For oral administration plant extract 250 mg/kg b.wt DCM and ethyl acetate fraction lessened blood glucose level 6.6 mmol/L and 7.9 mmol/L at 90 minutes.
Aqueous and n-hexane decresed blood glucose level 9.75 mmol/L and 5.6 mmol/L at 90 minutes.
Oral glucose tolerance evaluation or oral glucose tolerance test (OGTT) is one of the acceptable method to evaluate the hypoglycemic activity of plant extracts and other test samples. The test is performed by the method described by Mohamed Bnouham85. It is a medical test in which glucose is given and blood samples are taken afterward to determine how it is quickly cleared from blood. At the present study antihyperglycemic activity of different fractions of ethanolic Aristolochia tagala cham. extract were screened and compared with the standard and control group. Glibenclamide was used as standard drug. Diabetes mellitus is one of the most common chronic disease and is associated with hyperglycaemia. Glibenclamide has been used for many years to treat diabetes by stimulate insulin secretion from pancreatic β–cells. 1486-87. Free radicals are found to be associated with many diseases, including diabetes. In diabetes mellitus, the supplement of antioxidant agents show promising effect on the reverse of the oxidative stress biomarkers and diabetic complications. [2][6] Phytochemical analysis of Aristolochia tagala cham obtained from this study showed the presence of phenols, tannin, glycosides, terpenoids, and saponin of which the antidiabetic effects have been established87-90. The possible mechanism by which methanolic extract of Aristolochia tagala cham reduced hypoglycemic action might be due to presence of phenolic and flavonoids. These phytochemical constituents might be increasing either the pancreatic secretion of insulin from β–cells of islets of Langerhans or increased peripheral utilization of glucose91-92. The DCM & Ethyl acetate fraction contain great amounts of phenolic compounds (124 & 66 mg GAE/g extract) and flavonoids (360.30 & 506.72 mg QE/g extract). These results agree with previous report that high phenolic & flavonoid content were correlated with strong antioxidant activity87, 89. It can be anticipated that the antioxidant activity of Aristolochia tagala Cham may be beneficial in the long–term treatment of diabetic patients.
Phytochemical verification and identification of the active ingredients responsible for its antidiabetic activity need further investigation.
RESULT & DISCUSSION: EVALUATION OF ANTHELMINTIC ACTIVITY
Helminthes infections are among the most common infections in human beings in which human intestinal parasitic worms are vectored through air, food, and water, which causes disease state, secretes toxins, and steals the vital nutrients from host bodies93. Anthelmintics or antihelminthics are drugs that expel parasitic worms (helminths) from the body, by either stunning or killing them. They may also be called vermifuges (stunning) or vermicides (killing). Helminth infections are among the most widespread infections in humans, distressing a huge population of the world. Anthelmintics are the drugs that may act locally to expel worms from the GIT or systemically to eradicate adult helminthes or development forms that invade organs and tissues. Most of the existing anthelmintic produces side effects such as abdominal pain, loss of appetite, nausea, vomiting, headache and diarrhoea. Chemotherapy is the only treatment and effective tool to cure and control helminthes infection, as effective vaccines against helminthes have not been developed so far. Herbal drugs have been in use since ancient times for the treatment of parasitic diseases in human and could be of value in preventing the development of resistance94.
The objective of the present study is to evaluate anthelmintic activity of various fraction of Aristolochia tagala cham ethanolic extract .
Data presentation
Table 9.1: Anthelmintic activity of ethanol extract of Aristolochia tagala cham on the basis of paralysis time on P. cervi
| Treatments Concentration (mg/mL) | Worm no. | Time taken for paralysis in min. | Mean time of paralysis in min. | SD | SEM |
| Control 0.2% Tween–80 in water | C1 | ––– | ––– | ––– | ––– |
| C2 | ––– | ||||
| C3 | ––– | ||||
| C4 | ––– | ||||
| C5 | ––– | ||||
| C6 | ––– | ||||
| Standard Albendazole 15 mg/mL | S1 | 10.2 | 11.5 | 1.05 | 0.43 |
| S2 | 12.1 | ||||
| S3 | 11.4 | ||||
| S4 | 13.2 | ||||
| S5 | 12.5 | ||||
| S6 | 11.3 | ||||
| n hexane fraction 25mg/mL | T1 | 81.3 | 85.83 | 4.92 | 2.01 |
| T2 | 78.2 | ||||
| T3 | 88.8 | ||||
| T4 | 87.2 | ||||
| T5 | 89.2 | ||||
| T6 | 90.3 | ||||
| n hexane fraction 50 mg/mL | T1 | 50.2 | 47.12 | 2.26 | 0.92 |
| T2 | 46.3 | ||||
| T3 | 48.6 | ||||
| T4 | 47.3 | ||||
| T5 | 43.5 | ||||
| T6 | 46.8 | ||||
| n hexane fraction 100 mg/mL | T1 | 31.5 | 32.60 | 3.03 | 1.24 |
| T2 | 33.6 | ||||
| T3 | 28.7 | ||||
| T4 | 37.4 | ||||
| T5 | 30.6 | ||||
| T6 | 33.8 | ||||
| n hexane fraction 200 mg/mL | T1 | 23.4 | 25.85 | 1.64 | 0.67 |
| T2 | 25.7 | ||||
| T3 | 26.3 | ||||
| T4 | 28.4 | ||||
| T5 | 25.1 | ||||
| T6 | 26.2 | ||||
| DCM fraction 25 mg/mL | T1 | 40.3 | 39.4 | 1.81 | 0.74 |
| T2 | 39.3 | ||||
| T3 | 42.5 | ||||
| T4 | 38.2 | ||||
| T5 | 37.5 | ||||
| T6 | 38.5 | ||||
| DCM fraction 50 mg/mL | T1 | 23.5 | 24.02 | 1.82 | 0.74 |
| T2 | 24.5 | ||||
| T3 | 27.3 | ||||
| T4 | 22.3 | ||||
| T5 | 24.0 | ||||
| T6 | 22.5 | ||||
| DCM fraction 100 mg/mL | T1 | 13.2 | 13.27 | 1.04 | 0.43 |
| T2 | 13.5 | ||||
| T3 | 12.1 | ||||
| T4 | 15.0 | ||||
| T5 | 13.5 | ||||
| T6 | 12.3 | ||||
| DCM fraction 200 mg/mL | T1 | 7.1 | 7.5 | 1.15 | 0.47 |
| T2 | 8.5 | ||||
| T3 | 9.3 | ||||
| T4 | 6.5 | ||||
| T5 | 6.3 | ||||
| T6 | 7.5 | ||||
| Ethyl acetate fraction 25mg/mL | T1 | 27.3 | 26.7 | 1.68 | 0.68 |
| T2 | 25.1 | ||||
| T3 | 27.3 | ||||
| T4 | 24.2 | ||||
| T5 | 28.3 | ||||
| T6 | 28.1 | ||||
| Ethyl acetate fraction 50 mg/mL | T1 | 14.2 | 14.8 | 1.05 | 0.99 |
| T2 | 15.1 | ||||
| T3 | 14.2 | ||||
| T4 | 16.3 | ||||
| T5 | 13.5 | ||||
| T6 | 15.3 | ||||
| Ethyl acetate fraction 100 mg/mL | T1 | 6.4 | 6.7 | 0.77 | 0.32 |
| T2 | 7.2 | ||||
| T3 | 6.3 | ||||
| T4 | 5.4 | ||||
| T5 | 7.5 | ||||
| T6 | 7.1 | ||||
| Ethyl acetate fraction 200 mg/mL | T1 | 3.3 | 3.6 | 0.93 | 0.38 |
| T2 | 4.2 | ||||
| T3 | 2.4 | ||||
| T4 | 5.1 | ||||
| T5 | 3.4 | ||||
| T6 | 3.2 | ||||
| Water fraction 25 mg/mL | T1 | 25.65 | 25.08 | 0.80 | 0.33 |
| T2 | 24.05 | ||||
| T3 | 26.10 | ||||
| T4 | 25.00 | ||||
| T5 | 24.25 | ||||
| T6 | 25.40 | ||||
| Water fraction 50 mg/mL | T1 | 19.05 | 19.358 | 1.20 | .49 |
| T2 | 19.35 | ||||
| T3 | 20.50 | ||||
| T4 | 18.20 | ||||
| T5 | 21.00 | ||||
| T6 | 18.05 | ||||
| Water fraction 100 mg/mL | T1 | 13.65 | 13.525 | 0.59 | 0.24 |
| T2 | 14.00 | ||||
| T3 | 12.65 | ||||
| T4 | 14.25 | ||||
| T5 | 13.50 | ||||
| T6 | 13.10 | ||||
| Water fraction 200 mg/mL | T1 | 07.50 | 8.466 | 0.98 | 0.40 |
| T2 | 09.60 | ||||
| T3 | 07.25 | ||||
| T4 | 08.15 | ||||
| T5 | 09.00 | ||||
| T6 | 09.30 |
Table 9.2: Anthelmintic activity of ethanol extract of Aristolochia tagala cham on the basis of death time on P. cervi
| Treatments Concentration (mg/mL) | Worm no. | Time taken for death in min. | Mean time of death in min. | SD | SEM |
| Control 0.2% Tween–80 in water | C1 | ––– | ––– | ––– | ––– |
| C2 | ––– | ||||
| C3 | ––– | ||||
| C4 | ––– | ||||
| C5 | ––– | ||||
| C6 | ––– | ||||
| Standard Albendazole 15 mg/mL | S1 | 18.30 | 18.16 | 0.6785 | 0.27 |
| S2 | 17.50 | ||||
| S3 | 19.10 | ||||
| S4 | 17.25 | ||||
| S5 | 18.30 | ||||
| S6 | 18.50 | ||||
| n hexane fraction 25mg/mL | T1 | 120.1 | 120.73 | 7.38 | 3.01 |
| T2 | 118.0 | ||||
| T3 | 130.6 | ||||
| T4 | 115.2 | ||||
| T5 | 112.0 | ||||
| T6 | 128.5 | ||||
| n hexane fraction 50 mg/mL | T1 | 78.10 | 77.9667 | 2.36 | 0.96 |
| T2 | 77.30 | ||||
| T3 | 79.50 | ||||
| T4 | 81.60 | ||||
| T5 | 76.40 | ||||
| T6 | 74.90 | ||||
| n hexane fraction 100 mg/mL | T1 | 52.10 | 50.6667 | 2.0086 | 0.820 |
| T2 | 53.20 | ||||
| T3 | 47.60 | ||||
| T4 | 49.30 | ||||
| T5 | 50.50 | ||||
| T6 | 51.30 | ||||
| n hexane fraction 200 mg/mL | T1 | 35.70 | 38.6667 | 3.4599 | 1.4125 |
| T2 | 39.20 | ||||
| T3 | 43.70 | ||||
| T4 | 41.50 | ||||
| T5 | 37.10 | ||||
| T6 | 34.80 | ||||
| DCM fraction 25 mg/mL | T1 | 52.50 | 51.10 | 1.88 | 0.77 |
| T2 | 49.50 | ||||
| T3 | 53.40 | ||||
| T4 | 51.30 | ||||
| T5 | 51.50 | ||||
| T6 | 48.30 | ||||
| DCM fraction 50 mg/mL | T1 | 32.00 | 33.50 | 1.47 | 0.65 |
| T2 | 33.30 | ||||
| T3 | 35.10 | ||||
| T4 | 36.10 | ||||
| T5 | 32.30 | ||||
| T6 | 33.30 | ||||
| DCM fraction 100 mg/mL | T1 | 22.40 | 21.68 | 1.259 | 0.50 |
| T2 | 21.50 | ||||
| T3 | 20.50 | ||||
| T4 | 22.10 | ||||
| T5 | 23.50 | ||||
| T6 | 20.10 | ||||
| DCM fraction 200 mg/mL | T1 | 13.00 | 51.10 | 1.88 | 0.77 |
| T2 | 14.50 | ||||
| T3 | 14.50 | ||||
| T4 | 12.30 | ||||
| T5 | 12.50 | ||||
| T6 | 13.10 | ||||
| Ethyl acetate fraction 25mg/mL | T1 | 33.3 | 33.2 | 1.53 | 0.68 |
| T2 | 32.5 | ||||
| T3 | 34.5 | ||||
| T4 | 30.2 | ||||
| T5 | 34.2 | ||||
| T6 | 34.5 | ||||
| Ethyl acetate fraction 50 mg/mL | T1 | 21.6 | 20.3 | 1.35 | 0.60 |
| T2 | 19.3 | ||||
| T3 | 20.5 | ||||
| T4 | 22.1 | ||||
| T5 | 18.1 | ||||
| T6 | 20.5 | ||||
| Ethyl acetate fraction 100 mg/mL | T1 | 9.5 | 9.5 | 0.74 | 0.33 |
| T2 | 10.2 | ||||
| T3 | 9.2 | ||||
| T4 | 9.3 | ||||
| T5 | 10.5 | ||||
| T6 | 8.2 | ||||
| Ethyl acetate fraction 200 mg/mL | T1 | 5.2 | 5.4 | 0.70 | 0.31 |
| T2 | 5.5 | ||||
| T3 | 6.2 | ||||
| T4 | 6.5 | ||||
| T5 | 4.2 | ||||
| T6 | 5.3 | ||||
| Water fraction 25 mg/mL | T1 | 40.85 | 39.12 | 1.38 | 0.563 |
| T2 | 40.05 | ||||
| T3 | 38.10 | ||||
| T4 | 39.25 | ||||
| T5 | 37.00 | ||||
| T6 | 39.45 | ||||
| Water fraction 50 mg/mL | T1 | 31.50 | 30.72 | 0.93 | 0.378 |
| T2 | 30.00 | ||||
| T3 | 30.15 | ||||
| T4 | 29.95 | ||||
| T5 | 32.20 | ||||
| T6 | 30.50 | ||||
| Water fraction 100 mg/mL | T1 | 20.50 | 20.091 | 0.658 | 0.268 |
| T2 | 21.00 | ||||
| T3 | 19.55 | ||||
| T4 | 19.20 | ||||
| T5 | 20.35 | ||||
| T6 | 19.95 | ||||
| Water fraction 200 mg/mL | T1 | 16.50 | 15.475 | 0.776 | 0.317 |
| T2 | 15.35 | ||||
| T3 | 16.00 | ||||
| T4 | 15.65 | ||||
| T5 | 14.25 | ||||
| T6 | 15.10 |
![Anthelmintic activity of standard albendazole and Aristolochia tagala extract (n hexane & DCM fraction) on the basis of paralysis and death time on P. cervi [p < 0.05(*);p<0.005(**), p < 0.0001(***)]](https://rsisinternational.org/journals/ijrsi/wp-content/uploads/2024/05/Anthelmintic-activity-of-standard-albendazole-and-Aristolochia-tagala-extract-n-hexane-DCM-fraction-on-the-basis-of-paralysis-and-death-time-on-P.-cervi.png)
Figure 9.1: Anthelmintic activity of standard albendazole and Aristolochia tagala extract (n hexane & DCM fraction) on the basis of paralysis and death time on P. cervi [p < 0.05(*);p<0.005(**), p < 0.0001(***)]
![Anthelmintic activity of standard albendazole and A. tagala extract (Ethyl acetate &Water fraction) on the basis of paralysis and death time on P. cervi [p < 0.05(*);p<0.005(**), p < 0.0001(***)]](https://rsisinternational.org/journals/ijrsi/wp-content/uploads/2024/05/Anthelmintic-activity-of-standard-albendazole-and-A.-tagala-extract-Ethyl-acetate-Water-fraction-on-the-basis-of-paralysis-and-death-time-on-P.-cervi.png)
Figure 9.2: Anthelmintic activity of standard albendazole and A. tagala extract (Ethyl acetate &Water fraction) on the basis of paralysis and death time on P. cervi [p < 0.05(*);p<0.005(**), p < 0.0001(***)]
The results of the anthelmintic activity tests are summarized in Table 9.2 .All the four concentrations of A. tagala various fraction were active against Paramphistomum cervi helminths included in this study and the results were statistically significant. The results of the test showed that n–hexane, DCM, ethyl acetate, aqueous fraction of Aristolochia tagala cham at dose of 25 mg/mL, 50 mg/mL, 100 mg/mL and 200 mg/mL exhibit paralysis and death of Paramphistomum cervi helminths faster at high concentrations. n–hexane extract of Aristolochia tagala cham at dose of 25 mg/mL, 50 mg/mL,100 mg/mL and 200 mg/mL paralyzed P. cervi at about 85.83 , 47.12, 32.60 and 25.85minutes. All these concentrations of dose also occurred death of P. cervi at about 120.73 , 77.96, 50.66 and 38.67 minutes.DCM extract of Aristolochia tagala cham at dose of 25 mg/mL, 50 mg/mL,100 mg/mL and 200 mg/mL paralyzed P. cervi at about 39.4 , 24.02, 13.27 and 7.5 minutes. All these concentrations of dose also occurred death of P. cervi at about 51.10 , 33.50, 21.68 and 13.30 minutes. Ethyl acetate extract of Aristolochia tagala cham at dose of 25 mg/mL, 50 mg/mL,100 mg/mL and 200 mg/mL paralyzed P. cervi at about 26.7 , 14.8, 6.7 and 3.6 minutes. All these concentrations of dose also occurred death of P. cervi at about 33.2 , 20.3, 9.5 and 5.4 minutes. Aqueous extract of Aristolochia tagala Cham at dose of 25 mg/mL, 50 mg/mL,100 mg/mL and 200 mg/mL paralyzed P. cervi at about 25.08 , 19.36, 13.53 and 8.47 minutes. All these concentrations of dose also occurred death of P. cervi at about 39.12, 30.72, 20.09 and 15.48 minutes. Positive control (albendazole) caused the paralysis and death of P. cervi at 11.5 and 18.16 min respectively whereas no paralysis or death occurred for control (0.2% Tween–80 in water) group.
In the present study, the extract reduced both paralysis and death time of cattle helminths P. cervi. as a dose dependent fashion. The activity of the extract was comparable to the standard reference, Albendazole, causes degenerative alterations in the intestinal cells of the worm by binding to the colchicine–sensitive site of β–tubulin, thus inhibiting its polymerization or assembly into microtubules95 . The anthelmintic activity of plant materials is usually judged on the basis of loss of movement or paralysis and complete destruction or death of live parasites in in vitro studies96-97. Albendazole act through the reduction of glucose uptake as well as to the depletion of glycogen store which results gradual paralysis and subsequently death. Although the extract mechanism involved with the observed anthelmintc activity of the extract is known, polyphenolics present in the extract may play a role in it. Preliminary phytochemical screening has shown the presence of alkaloids, tanins, flavonoids, steroids, glycosides and reducing sugars.
Phytochemical analysis of the crude extract revealed the presence of tannins, phenolics, flavanoids and alkaloids which are known to exhibit anthelmintic property. Tannins and Phenolics are known to interfere with the energy generation in helminth parasites by uncoupling oxidative phosphorylation98. Previous phytochemical investigation of Aristolochia tagala cham indicated the presence of phenolics, tannins, flavonoids and steroids in their crude methanolic extracts33. Tannins and alkaloids are another phytochemical compound which are also renowned for their anthelmintic action99. These compounds may act on the CNS of the parasites causing paralysis and death of worms or interfere with the energy generation in the helminthes by uncoupling the oxidative phosphorylation or they bind to free proteins in the gastrointestinal tract of the host animal or to glycoprotein on the cuticle of the parasite and causes death58, 100. These classes of compounds identified in our extract could be responsible for anthelmintic activity of Aristolochia tagala extracts. Ethyl acetate and aqueous fraction s showed better anthelmintic activity on P.cervi than n–hexane & DCM fractions.
This plant represents an important source of anthelmintic agent to fight against helminths and dictates for further investigation to identify active principles.
Aristolochia tagala Cham. (ATC) Aristolochia tagala Cham. (ATC)
Safety and efficacy:
Aristolochia tagala Cham. (ATC)do not cause acute nephrotoxicity or aggravate LPS-induced organ injuries in rats. A dried root of Aristolochia tagala Cham. (ATC) is often used in Thai traditional medicine as an antipyretic, anti-inflammatory agent, muscle relaxant, appetite-enhancing agent, and analeptic. Homnawakod, an important herbal recipe, originally contained ATC in its formula, however, some Aristolochia species have been reported to cause nephrotoxicity due to aristolochic acid (AA) and its derivatives, resulting in ATC removal from all formulae.
CONCLUSION
Medicinal plants have been of great interests as they serve as important source of natural products of health benefits. Bangladesh possesses a rich flora of medicinal plants including edible plants. But due to lack of scientific knowledge, medicinal and nutritional values about these edible plants are largely unexplored. The phytochemical tests carried out on different fraction s of Aristolochia tagala Cham revealed the presence of several important constituents which may lead to the development of drug formulation after investigation of further pharmacological and other activity. From the above results and discussion it can be concluded that the ethanol extracts and its n– hexane, ethyl Acetate, DCM & water fractions of Aristolochia tagala can contribute in national health care sector by using as natural source of medicine through identification of potential source of antioxidant and relative antioxidant, hypoglycemic, antidiarrheal, anthelmintic metabolites which justify the basis of using this plant’s extract as folkloric and further demand for investigations like LC–MS, GC–MS to isolate bioactive compounds, characterize its structure, to identify underlying mechanism, and cell line assay neutral red to divide the plants for pharmacological activity in–vivo and in–vitro.
REFERENCES
- Nassiri-Asl, M.; Shariati-Rad, S.; Zamansoltani, F., Anticonvulsant effects of aerial parts of Passiflora incarnata extract in mice: involvement of benzodiazepine and opioid receptors. BMC complementary and alternative medicine 2007, 7 (1), 26.
- Singh, J., The biodiversity crisis: a multifaceted review. Current Science 2002, 82 (6), 638-647.
- Hamilton, A. C., Medicinal plants, conservation and livelihoods. Biodiversity & Conservation 2004, 13 (8), 1477-1517.
- Halberstein, R. A., Medicinal plants: historical and cross-cultural usage patterns. Annals of epidemiology 2005, 15 (9), 686-699.
- Huang, H., Plant diversity and conservation in China: planning a strategic bioresource for a sustainable future. Botanical Journal of the Linnean Society 2011, 166 (3), 282-300.
- Rafieian-Kopaei, M., Medicinal plants and the human needs. Journal of HerbMed Pharmacology 2012, 1.
- Verma, S.; Singh, S., Current and future status of herbal medicines. Veterinary world 2008, 1 (11), 347.
- Ogaji, I. J.; Nep, E. I.; Audu-Peter, J. D., Advances in natural polymers as pharmaceutical excipients. 2012.
- Phillipson, J. D., Phytochemistry and medicinal plants. Phytochemistry 2001, 56 (3), 237-243.
- Jamshidi-Kia, F.; Lorigooini, Z.; Amini-Khoei, H., Medicinal plants: Past history and future perspective. Journal of herbmed pharmacology 2018, 7 (1).
- Schippmann, U.; Leaman, D.; Cunningham, A., A comparison of cultivation and wild collection of medicinal and aromatic plants under sustainability aspects. Frontis 2006, 75-95.
- Belemtougri, R.; Constantin, B.; Cognard, C.; Raymond, G.; Sawadogo, L., Effects of two medicinal plants Psidium guajava L.(Myrtaceae) and Diospyros mespiliformis L.(Ebenaceae) leaf extracts on rat skeletal muscle cells in primary culture. Journal of Zhejiang University Science B 2006, 7 (1), 56-63.
- Zargari, A., Medicinal Plants Tehran University Publication. Volume II 1991.
- Tilburt, J. C.; Kaptchuk, T. J., Herbal medicine research and global health: an ethical analysis. Bulletin of the World Health Organization 2008, 86, 594-599.
- Farnsworth, N. R.; Akerele, O.; Bingel, A. S.; Soejarto, D. D.; Guo, Z., Medicinal plants in therapy. Bulletin of the world health organization 1985, 63 (6), 965.
- Ganesan, A., The impact of natural products upon modern drug discovery. Current opinion in chemical biology 2008, 12 (3), 306-317.
- Yarnell, E.; Abascal, K., Dilemmas of traditional botanical research. HerbalGram 2002.
- Vickers, N. J., Animal Communication: When I’m Calling You, Will You Answer Too? Current Biology 2017, 27 (14), R713-R715.
- Fabricant, D. S.; Farnsworth, N. R., The value of plants used in traditional medicine for drug discovery. Environmental health perspectives 2001, 109 (suppl 1), 69-75.
- González, F.; Stevenson, D. W., Perianth development and systematics of Aristolochia. Flora 2000, 195 (4), 370-391.
- Kuo, P.-C.; Li, Y.-C.; Wu, T.-S., Chemical Constituents and Pharmacology of the Aristolochia (馬兜鈴 mădōu ling) species. Journal of traditional and complementary medicine 2012, 2 (4), 249-266.
- How, F.-C., A dictionary of the families and genera of Chinese seed plants. science press: 1984.
- Andrei, E., Farmacopeia homeopatica Brasileira. Sao Paulo 1977.
- Mohanraj, R., Changes in bioactive components of Aristolochia tagala. Cham, a rare species of medicinal importance during its in vitro development through direct regeneration. bioRxiv 2016, 037028.
- Murugan, R.; Shivanna, K.; Rao, R., Pollination biology of Aristolochia tagala, a rare species of medicinal importance. Current Science 2006, 795-798.
- Kirtikar, K. R.; Basu, B. D., Indian Medicinal Plants. Indian Medicinal Plants. 1918.
- Ravikumar, K.; Ved, D.; Vijaya Sankar, R.; Udayan, P., 100 Red listed medicinal plants of conservation concern in Southern India. 2000.
- Battu, G. R.; Parimi, R.; Chandra Shekar, K. B., In vivo and in vitro pharmacological activity of Aristolochia tagala (syn: Aristolochia acuminata) root extracts. Pharmaceutical biology 2011, 49 (11), 1210-1214.
- Rajashekharan, S.; Pushpangadan, P.; Kumar, P. R.; Jawahar, C.; Nair, C. R.; Amma, L. S., Ethno-medico-bot anical studies of cheriya arayan-and valiya arayan-(Aristolochia indica, Linn; Aristolochia tagala, Cham). Ancient science of life 1989, 9 (2), 99.
- Dey, A.; De, J. N., Traditional use of plants against snakebite in Indian subcontinent: a review of the recent literature. African Journal of Traditional, Complementary and Alternative Medicines 2012, 9 (1), 153-174.
- Biswas, A.; Bari, M.; Roy, M.; Bhadra, S., Inherited folk pharmaceutical knowledge of tribal people in the Chittagong hill tracts, Bangladesh. 2010.
- Hadem, K. L. H.; Sharan, R. N.; Kma, L., Phytochemicals of Aristolochia tagala and Curcuma caesia exert anticancer effect by tumor necrosis factor-α-mediated decrease in nuclear factor kappaB binding activity. Journal of basic and clinical pharmacy 2015, 7 (1), 1.
- Hadem, K. L. H.; Sharan, R. N.; Kma, L., Inhibitory potential of methanolic extracts of Aristolochia tagala and Curcuma caesia on hepatocellular carcinoma induced by diethylnitrosamine in BALB/c mice. Journal of carcinogenesis 2014, 13.
- Tripatara, P.; Onlamul, W.; Booranasubkajorn, S.; Wattanarangsan, J.; Huabprasert, S.; Lumlerdkij, N.; Akarasereenont, P.; Laohapand, T., The safety of Homnawakod herbal formula containing Aristolochia tagala Cham. in Wistar rats. BMC complementary and alternative medicine 2012, 12 (1), 170.
- Hadem, K. L. H.; Sen, A., Identification of compounds of Aristolochia tagala and apoptotic activity in HeLa cells. Pharmacognosy Magazine 2018, 14 (59), 571.
- Liu, F.; Ooi, V.; Chang, S., Free radical scavenging activities of mushroom polysaccharide extracts. Life sciences 1997, 60 (10), 763-771.
- Kumar, M. S.; Rajeswari, A. N., Evaluation of antimicrobial activities of Aristolochia Indica (Linn). Int J Pharm Pharma Sci 2011, 3 (4), 271-272.
- Laouer, H.; Yabrir, B.; Djeridane, A.; Yousfi, M.; Beldovini, N.; Lamamra, M., Composition, antioxidant and antimicrobial activities of the essential oil of Marrubium deserti. Natural product communications 2009, 4 (8), 1934578X0900400824.
- Su, Y.-H.; Liu, Y.-B.; Zhang, X.-S., Auxin–cytokinin interaction regulates meristem development. Molecular plant 2011, 4 (4), 616-625.
- Ghani, A., Medicinal plants of Bangladesh: chemical constituents and uses. Asiatic society of Bangladesh: 1998.
- Ghani, A., Practical phytochemistry (including methods of phytochemical studies). Parash Publishers, Dhaka, Bangladesh: 2005.
- MAKINDE, A. M.; FAJUYIGBE, E. A., Secondary Metabolites and Bioactivity of Hyophila involuta (Hook) Jaeg. Notulae Scientia Biologicae 2015, 7 (4), 456-459.
- Sofowara, A., Medicinal plants and traditional plants in Africa. Chichester and New York 1982.
- Harborne, J., Methods of extraction and isolation. Phytochemical methods 1998, 3, 60-66.
- Ayoola, G.; Coker, H.; Adesegun, S.; Adepoju-Bello, A.; Obaweya, K.; Ezennia, E. C.; Atangbayila, T., Phytochemical screening and antioxidant activities of some selected medicinal plants used for malaria therapy in Southwestern Nigeria. Tropical Journal of Pharmaceutical Research 2008, 7 (3), 1019-1024.
- Abdullahi, M.; Ilyas, N.; Hajara, I.; Kabir, Y., Isolation and Characterisation of an Αlpha-amyrin Acetate Isolated from the Leaves of Microtrichia perotitii DC (Asteraceae). Chemical Science International Journal 2017, 1-8.
- Yadav, R.; Agarwala, M., Phytochemical analysis of some medicinal plants. Journal of phytology 2011.
- Amer, M. E.; Abou-Shoer, M. I.; Abdel-Kader, M. S.; El-Shaibany, A.; Abdel-Salam, N. A., Alkaloids and flavone acyl glycosides from Acanthus arboreus. Journal of the Brazilian Chemical Society 2004, 15 (2), 262-266.
- Sadhu, S. K.; Okuyama, E.; Fujimoto, H.; Ishibashi, M., Separation of Leucas aspera, a medicinal plant of Bangladesh, guided by prostaglandin inhibitory and antioxidant activities. Chemical and pharmaceutical bulletin 2003, 51 (5), 595-598.
- Uddin, S. N.; Akond, M.; Mubassara, S.; Yesmin, M. N., Antioxidant and Antibacterial activities of Trema cannabina. Middle-East Journal of Scientific Research 2008, 3 (2), 105-108.
- Wolfe, K.; Wu, X.; Liu, R. H., Antioxidant activity of apple peels. Journal of agricultural and food chemistry 2003, 51 (3), 609-614.
- Miliauskas, G.; Venskutonis, P.; Van Beek, T., Screening of radical scavenging activity of some medicinal and aromatic plant extracts. Food chemistry 2004, 85 (2), 231-237.
- Saha, M.; Hasan, S.; Akter, R.; Hossain, M.; Alam, M.; Alam, M.; Mazumder, M., In vitro free radical scavenging activity of methanol extract of the leaves of Mimusops elengi Linn. Bangladesh Journal of Veterinary Medicine 2008, 6 (2), 197-202.
- Amorim, E. L.; Nascimento, J. E.; Monteiro, J. M.; Peixoto Sobrinho, T.; Araújo, T. A.; Albuquerque, U. P., A simple and accurate procedure for the determination of tannin and flavonoid levels and some applications in ethnobotany and ethnopharmacology. Functional Ecosystems and Communities 2008, 2 (1), 88-94.
- Sobiyi, K.; Tom Ashafa, A., In vitro anthelmintic activity of Heliotropium indicum, Senna fistula and Spigelia anthelmia used as worm expeller in South West Nigeria. Bangladesh Journal Pharmacology 2015, 10, 417-422.
- Hasan, M. M.; Hossain, A.; Shamim, A.; Rahman, M. M., Phytochemical and pharmacological evaluation of ethanolic extract of Lepisanthes rubiginosa L. leaves. BMC complementary and alternative medicine 2017, 17 (1), 496.
- Djilani, A.; Toudert, N.; Djilani, S., Evaluation of the hypoglycemic effect and antioxidant activity of methanol extract of Ampelodesma mauritanica roots. Life Sciences and Medicine Research 2011, 31, 1-6.
- Islam, T.; Das, A.; Shill, K. B.; Karmakar, P.; Islam, S.; Sattar, M. M., Evaluation of membrane stabilizing, anthelmintic, antioxidant activity with phytochemical screening of methanolic extract of Neolamarckia cadamba fruits. J Med Plants Res 2015, 9 (5), 151-8.
- Wang, J.; Li, J.; Cao, J.; Jiang, W., Antifungal activities of neem (Azadirachta indica) seed kernel extracts on postharvest diseases in fruits. African Journal of Microbiology Research 2010, 4 (11), 1100-1104.
- Leo, A.; Hansch, C.; Elkins, D., Partition coefficients and their uses. Chemical reviews 1971, 71 (6), 525-616.
- Halliwell, B.; Murcia, M. A.; Chirico, S.; Aruoma, O. I., Free radicals and antioxidants in food and in vivo: what they do and how they work. Critical Reviews in Food Science & Nutrition 1995, 35 (1-2), 7-20.
- Hamid, A.; Aiyelaagbe, O.; Usman, L.; Ameen, O.; Lawal, A., Antioxidants: Its medicinal and pharmacological applications. African Journal of pure and applied chemistry 2010, 4 (8), 142-151.
- Dash, S.; Nath, L. K.; Bhise, S., Antioxidant and antimicrobial activities of Heracleum nepalense D Don root. Tropical Journal of Pharmaceutical Research 2005, 4 (1), 341-347.
- Galib, N. A.; Ali, K. S.; Munaiem, R. T.; Mohammed, A. S., PHYTOCHEMICAL SCREENING AND THIN LAYER CHROMATOGRAPHY OF ACACIA ETBAICA SSP. UNCINATA LEAVES. 2017.
- Thorington, R. W.; Thorington Jr, R. W.; Ferrell, K. E., Squirrels: the animal answer guide. JHU press: 2006.
- Hsu, F.-L.; Huang, W.-J.; Wu, T.-H.; Lee, M.-H.; Chen, L.-C.; Lu, H.-J.; Hou, W.-C.; Lin, M.-H., Evaluation of antioxidant and free radical scavenging capacities of polyphenolics from pods of Caesalpinia pulcherrima. International journal of molecular sciences 2012, 13 (5), 6073-6088.
- Manik, R.; Selvamani, P.; Latha, S., Antibacterial activity of leaf extracts of Aristolochia bracteate retz. Indian journal of pharmaceutical sciences 2006, 68 (4).
- Sati, H.; Sati, B.; Saklani, S.; Bhatt, P. C.; Mishra, A. P., Phytochemical and pharmacological potential of Aristolochia indica: A review. Research journal of pharmaceutical, biological and chemical sciences 2011, 2 (4), 647-654.
- Galib, N. A.; Algfri, S. K., Phytochemical screening and antioxidant evaluation by DPPH of Capparis cartilaginea Decne leaves. Journal of Medicinal Plants 2016, 4 (5), 280-286.
- Kannan, R. R. R.; Arumugam, R.; Meenakshi, S.; Anantharaman, P., Thin layer chromatography analysis of antioxidant constituents from seagrasses of Gulf of Mannar Biosphere Reserve, South India. Int J ChemTech Res 2010, 2 (3), 1526-1530.
- Torre, G. D.; Arollado, E.; Atienza, A.; Manalo, R., Evaluation of antioxidant capacity and identification of bioactive compounds of crude methanol extracts of Caesalpinia pulcherrima (L.) Swartz. Indian Journal of Pharmaceutical Sciences 2017, 79 (1), 113-123.
- Javanmardi, J.; Stushnoff, C.; Locke, E.; Vivanco, J., Antioxidant activity and total phenolic content of Iranian Ocimum accessions. Food chemistry 2003, 83 (4), 547-550.
- Kähkönen, M. P.; Hopia, A. I.; Vuorela, H. J.; Rauha, J.-P.; Pihlaja, K.; Kujala, T. S.; Heinonen, M., Antioxidant activity of plant extracts containing phenolic compounds. Journal of agricultural and food chemistry 1999, 47 (10), 3954-3962.
- Ruela de Sousa, R. R.; Queiroz, K. C. S.; Souza, A. C. S.; Gurgueira, S. A.; Augusto, A. C.; Miranda, M. A.; Peppelenbosch, M. P.; Ferreira, C. V.; Aoyama, H., Phosphoprotein levels, MAPK activities and NFκB expression are affected by fisetin. Journal of enzyme inhibition and medicinal chemistry 2007, 22 (4), 439-444.
- Khatiwora, E.; Adsul, V. B.; Kulkarni, M. M.; Deshpande, N.; Kashalkar, R., Spectroscopic determination of total phenol and flavonoid contents of Ipomoea carnea. International Journal of ChemTech Research 2010, 2 (3), 1698-1701.
- Kosek, M.; Bern, C.; Guerrant, R. L., The global burden of diarrhoeal disease, as estimated from studies published between 1992 and 2000. Bulletin of the world health organization 2003, 81, 197-204.
- Thapar, N.; Sanderson, I. R., Diarrhoea in children: an interface between developing and developed countries. The Lancet 2004, 363 (9409), 641-653.
- Mekonnen, B.; Asrie, A. B.; Wubneh, Z. B., Antidiarrheal activity of 80% methanolic leaf extract of Justicia schimperiana. Evidence-Based Complementary and Alternative Medicine 2018, 2018.
- Pérez-Gutiérrez, S.; Zavala-Mendoza, D.; Hernández-Munive, A.; Mendoza-Martínez, Á.; Pérez-González, C.; Sánchez-Mendoza, E., Antidiarrheal activity of 19-deoxyicetexone isolated from Salvia ballotiflora Benth in mice and rats. Molecules 2013, 18 (8), 8895-8905.
- Umer, S.; Tekewe, A.; Kebede, N., Antidiarrhoeal and antimicrobial activity of Calpurnia aurea leaf extract. BMC complementary and alternative medicine 2013, 13 (1), 21.
- Taylor, C. R.; Merin, L. M.; Salunga, A. M.; Hepworth, J. T.; Crutcher, T. D.; O’Day, D. M.; Pilon, B. A., Improving diabetic retinopathy screening ratios using telemedicine-based digital retinal imaging technology: the Vine Hill study. Diabetes care 2007, 30 (3), 574-578.
- Lyra, R.; Oliveira, M.; Lins, D.; Cavalcanti, N., Prevenção do diabetes mellitus tipo 2. Arquivos Brasileiros de Endocrinologia & Metabologia 2006, 50 (2), 239-249.
- Heise, T.; Nosek, L.; Rønn, B. B.; Endahl, L.; Heinemann, L.; Kapitza, C.; Draeger, E., Lower within-subject variability of insulin detemir in comparison to NPH insulin and insulin glargine in people with type 1 diabetes. Diabetes 2004, 53 (6), 1614-1620.
- Alarcon-Aguilara, F.; Roman-Ramos, R.; Perez-Gutierrez, S.; Aguilar-Contreras, A.; Contreras-Weber, C.; Flores-Saenz, J., Study of the anti-hyperglycemic effect of plants used as antidiabetics. Journal of ethnopharmacology 1998, 61 (2), 101-110.
- Bnouham, M.; Merhfour, F.-Z.; Ziyyat, A.; Mekhfi, H.; Aziz, M.; Legssyer, A., Antihyperglycemic activity of the aqueous extract of Urtica dioica. Fitoterapia 2003, 74 (7-8), 677-681.
- Susila, R.; Gladys, R. J.; Arunadevi, R.; Jothi, J.; Arunachalam, C.; Balagurusamy, K., A review on anti-diabetic herbs of Siddha system with special reference to it’s organoleptic quality (taste) as per tridosam concept.
- Van Doan, H.; Riyajan, S.; Iyara, R.; Chudapongse, N., Antidiabetic activity, glucose uptake stimulation and α-glucosidase inhibitory effect of Chrysophyllum cainito L. stem bark extract. BMC complementary and alternative medicine 2018, 18 (1), 1-10.
- Abdallah, H. M.; Salama, M. M.; Abd-Elrahman, E. H.; El-Maraghy, S. A., Antidiabetic activity of phenolic compounds from Pecan bark in streptozotocin-induced diabetic rats. Phytochemistry Letters 2011, 4 (3), 337-341.
- Nazaruk, J.; Borzym-Kluczyk, M., The role of triterpenes in the management of diabetes mellitus and its complications. Phytochemistry reviews 2015, 14 (4), 675-690.
- Piluzza, G.; Bullitta, S., Correlations between phenolic content and antioxidant properties in twenty-four plant species of traditional ethnoveterinary use in the Mediterranean area. Pharmaceutical biology 2011, 49 (3), 240-247.
- Kumar, V.; Ahmed, D.; Gupta, P. S.; Anwar, F.; Mujeeb, M., Anti-diabetic, anti-oxidant and anti-hyperlipidemic activities of Melastoma malabathricum Linn. leaves in streptozotocin induced diabetic rats. BMC complementary and alternative medicine 2013, 13 (1), 222.
- Raju, M. G.; Reddy, T. H. S., Anti-diabetic and hypolipidemic activity of methanolic extract of Aristolochia bracteolata on streptozotocin induced diabetic rat model. International Journal of Pharmaceutical Sciences and Research 2017, 8 (3), 1173.
- Murugamani, V.; Raju, L.; Anand Raj, V. B.; Sankar, G. G., The new method developed for evaluation of anthelmintic activity by housefly worms and compared with conventional earthworm method. ISRN pharmacology 2012, 2012.
- Goodman, L. S.; Limbird, L.; Hardman, J.; Gilman, A., Insecticides. Goodman & Gilman’s the pharmacological basis of therapeutics. 10th Edition, Mc Graw-Hill, New York, USA 2001.
- Farasat, M.; Khavari-Nejad, R.-A.; Nabavi, S. M. B.; Namjooyan, F., Antioxidant activity, total phenolics and flavonoid contents of some edible green seaweeds from northern coasts of the Persian Gulf. Iranian journal of pharmaceutical research: IJPR 2014, 13 (1), 163.
- Goto, C.; Kasuya, S.; Koga, K.; Ohtomo, H.; Kagei, N., Lethal efficacy of extract fromZingiber officinale (traditional Chinese medicine) or [6]-shogaol and [6]-gingerol inAnisakis larvae in vitro. Parasitology Research 1990, 76 (8), 653-656.
- Bashtar, A.-R.; Hassanein, M.; Abdel-Ghaffar, F.; Al-Rasheid, K.; Hassan, S.; Mehlhorn, H.; Magda, A.-M.; Morsy, K.; Al-Ghamdi, A., Studies on monieziasis of sheep I. Prevalence and antihelminthic effects of some plant extracts, a light and electron microscopic study. Parasitology research 2011, 108 (1), 177-186.
- Hoste, H.; Manolaraki, F.; Brunet, S.; Arroyo López, C.; Martínez-Ortiz de Montellano, C.; Sotiraki, S.; Torres Acosta, F., The anthelmintic properties of tannin-rich legume forages: from knowledge to exploitation in farm conditions. Challenging strategies to promote the sheep and goat sector in the current global context. Zaragoza: CIHEAM/CSIC/un iversidad de León/FAO 2011, 295-304.
- Ekeanyanwu, R.; Etienajirhevwe, O., In vitro anthelmintic potentials of Xylopia aethiopica and Monodora myristica from Nigeria. Afr J Biochem Res 2012, 6 (9), 115-120.
- Yasmin, F.; Hossain, M.; Sarder, A.; Bokshi, B., Analgesic, Antidiarrheal, Antioxidant, Cytotoxic and Oral Glucose Tolerance Activities of Ethanolic Leaf Extract of Aristolochia indica L.
- https://www.ncbi.nlm.nih.gov/pmc/articles/PMC3519600/
- Djeridane A, Yousfi M, Nadjemi B, Maamri S, Djireb, Focker P (2006). Agric. Food Chem. 50: 5294-5299.
- Hall CA, Cuppett SL (1997). Structure-activities of natural antioxidants. In: Aruoma OI, Cuppett SL, eds., Antioxidant Methodology: In vivo and in vitro Concepts. AOCS Press Champaign, IL, pp. 141-172.
- Halliwell B, Gutteridge JM (1989). Free Radicals, ageing and disease. In: Halliwell B, Gutteridge JM (eds.). Free Radicals in Biology and Medicine, 2nd ed. Clarendon Press, Oxford. pp. 446-493.
- Koleva II, Van Beek TA, Linssen JPH, De Groot A, Evstatieva LN (2002). Screening of plant extracts for antioxidant activity: a comparative study on three testing methods. Phytochem. Anal. 13: 8-17.
- Lee JC, Kim HR, Jim KJ (2002). Antioxidant property of an extract of the stem of Opuntia ficus-indica Var.saboten J. Agric. Food Chem. 50: 6490-6496.
- Lo liger J (1991). The use of antioxidants in food. In Aruoma OI, Halliwell B (Eds) Free radicals and food additives. Taylor and Francis, London. pp. 129–150.
- Osawa T (1994). Novel natural antioxidants for utilization in food and biological systems. In Uritani I, Garcia VV, Mendoza EM (Eds) Post harvest biochemistry of plant food-materials in the tropics. Japan Scientific Societies Press, Japan. pp. 241-251.
- Shahidi F, Janitha PK, Wanasundara PD (1992). Phenolic antioxidants. Crit. Rev. Food Sci. Nutr. 32(1): 67-103.