
Comparing a Multi-Terminal High Voltage Direct Current and Unified Power Flow Control for Short Circuit Level Reduction in Iraqi 400 Kv Grid
- Akram N. Merzah
- Abbas H. Abbas
- Firas M. Tuaimah
- Alaa B. Salman
- Aqil H. Muhsen
- Asmaa A. Mohammed
- 271-283
- Jul 30, 2024
- Engineering
Comparing a Multi-Terminal High Voltage Direct Current and Unified Power Flow Control for Short Circuit Level Reduction in Iraqi 400 Kv Grid
Akram N. Merzah1,2*, Abbas H. Abbas1, Firas M. Tuaimah2, Alaa B. Salman3, Aqil H. Muhsen3, Asmaa A. Mohammed3
1 Electrical Engineering Department, University of Basrah, Iraq
2 Electrical Engineering Department, University of Baghdad, Iraq
3Operation and Control Office, Ministry of Electricity, Iraq
*Corresponding Author
DOI: https://doi.org/10.51244/IJRSI.2024.1107018
Received: 23 June 2024; Accepted: 29 June 2024; Published: 30 July 2024
ABSTRACT
The demand for electricity has increased significantly in recent years; yet, the transmission and distribution networks are unable to meet unrestrained demands because of resource constraint. Losses in power lines exacerbate the unfavorable conditions for maximum power transfer. Recent decades have seen a rise in the use of FACTS and High Voltage Direct Current transmission in power systems due to its many advantages, which include reduced short circuit level (SCL), enhanced voltage profiles, reduced network power losses, and enhanced system reliability and safety. The paper presents a comparing study of the effectiveness of Unified Power Flow Control (UPFC) and Multi-Terminal High Voltage Direct Current (MT-HVDC) transmission in reducing short circuit current and network power losses for the Iraqi Super High Voltage (ISHV) grid. Modeling of Unified Power Flow Control and Multi-Terminal High Voltage Direct Current transmission is carried out using the Power System Simulator for Engineering (PSS/E) version 32 Package Program. The integration of multi-terminal HVDC transmission to the system resulted in a considerable decrease in short circuit levels and network power losses for the majority of buses in the system, as well as a reduction in the loading on the transmission lines in the southern region of Iraqi Super High Voltage grid, As a result, the South’s network performance will improve, hence improving Iraq’s electrical power system. Furthermore, when compared to installing a UPFC, the results showed that multi-terminal HVDC transmission reduces short circuit levels more efficiently.
Keywords: MT-HVDC, UPFC, SCL, Network Power Losses, PSS/E
INTRODUCTION
The growing need for electricity has led to the expansion of transmission networks. Power system performance degrades as transmission network size and complexity increase due to problems with voltage stability, load flow, and short circuit levels. Several approaches were being thought of and implemented for solving this issue. High voltage direct current (HVDC) transmission is one technique that has drawn significant interest in the last decade. Converting an existing HVAC transmission line to hybrid HVAC/HVDC systems is an alternative to HVAC systems for transporting large amount of power over long distances. Hybrid HVAC/HVDC transmission systems provide several advantages over HVAC transmission systems, such as improved voltage profile, lower cost of losses, system stability, better efficiency and control, and lower short circuit current levels[1][2]. The associated systems are developed with care, designed thoughtfully, and maintained suitably to guarantee reliable and high-quality electrical power services. The frequent incidence of faults prevents the systems from operating effectively and reliably [3]. There may be many different reasons of a problem, such as a short circuit, a natural calamity, an overload, or careless maintenance. Power system analysis carefully evaluates the frequency of these faults. A system failure can manifest in a number of ways, such as a double-line fault, a single line to ground fault, or a three-phase fault [4]. Fault current is the term used to describe the sudden increase in current that results from a short circuit or other power system fault [5].
In [6], HVAC and HVDC power transfer technologies were contrasted. Through the use of various fault kinds, the research of the two topologies was completed. The results show that for every fault scenario, the “fault current” in the HVAC transmission system is significantly higher than in the HVDC transmission system. In HVAC transmission systems, the effects of “fault current” are very harmful, but in HVDC transmission systems, they are light, inconsequential, and less dangerous. HVDC transmission systems are divided into two primary topologies: two-terminal and multi-terminal HVDC transmission systems, depending on the application, location, and technology [7]. The performance, economy, and efficiency of the A.C. power system are improved thanks to the HVDC link, which offers a variety of advantages [8]. By selecting the optimal location for the HVDC system, the issues caused by a transmission line that is overloaded are solved. In order to achieve this aim, a Genetic Algorithm (GA) is used to handle power flow in overloaded transmission lines, reduce power losses, and optimize the voltage profile [9]. By adding the reactive power flow, Grijalva suggested a technique to improve the linear available power transfer capability [10], although this is only applicable to AC networks. The impact of inserting High Voltage Direct Current (HVDC) on the system’s voltage stability, network power losses and power transfer capacity of transmission network under several cases of load contingency studied in [11]. IEEE 57-Bus test system is used for testing the addition of HVDC transmission based on genetic algorithm. On the transmission grid, the impact of optimal power flow for combined AC and VSC-MTDC systems connected to wind farms has expanded, as illustrated in [12], to decrease active losses , and to reduce the total generation cost[13][14]. The suggested method is based on the selection of transmission lines for alternating current (AC) systems that create higher short circuit levels (SCLs) in order to reduce the effects on the transmission system and on the lines nearby, and this is done after replacing the alternating current (AC) line with a two-point direct current line. An integrated a HVDC link into the Egyptian power grid. After adding an HVDC link, they observed that the power nodal prices are decreased due to an improved voltage profile for buses [15]. When these FACTS devices are positioned precisely, they provide the most significant improvement in power quality [16] [17]. Decrease the fault current of the system by utilizing these FACTS devices [18]. The first-generation FACTS devices have been considered by researchers [16], in addition to reducing the voltage level for fault current reduction [18].
This paper suggests the adding of two UPFC and multi-terminal high voltage direct current (MT-HVDC) transmission to south area of Iraqi Super High Voltage (ISHV) grid to reduce the short circuit level and total network losses. Analysis of the performance of two a proposed approach, UPFC, and multi-terminal HVDC transmission systems are considered.
MODELING OF UPFC AND HVDC SYSTEM
- Unified Power Flow Controller Modeling
The Unified Power Flow Controller concept called UPFC is a power electronics-based system which can provide simultaneous control of the transmission line impedance, phase angle, voltage magnitude and active and reactive power flow [19]. It’s has to voltage source convertor: The shunt converter acts like a STATCOM and the series converter acts like a SSSC. The series converter controls the phasor voltage in series with the line [20]. The transmission line current flows through this voltage source resulting in real and reactive power exchange between it and the ac system [21]. The controller can control active and reactive power in the transmission line [22]. As it is shown in Fig. 1, the basic structure of UPFC device is a combination of two compensators [23]: one connected in parallel called Static Compensator (STATCOM) and the other in series called Static Synchronous Series Compensator (SSSC). Both compensators are connected with “DC” link to exchange the real power between the output terminals of STATCOM and SSSC [19].
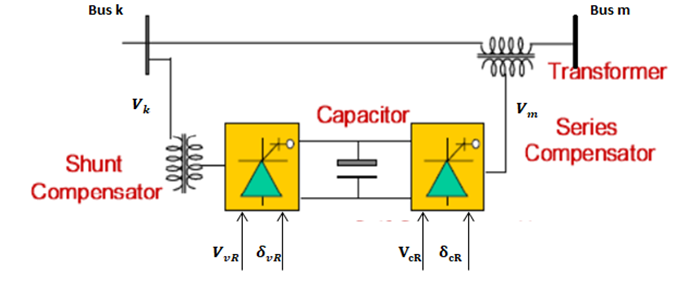
Fig.1 the basic structure of UPFC device
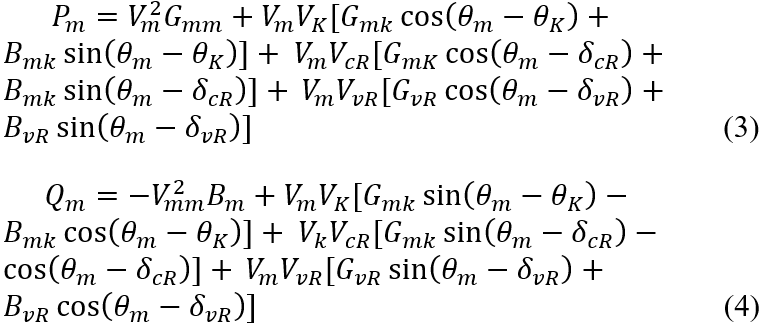
at Bus :
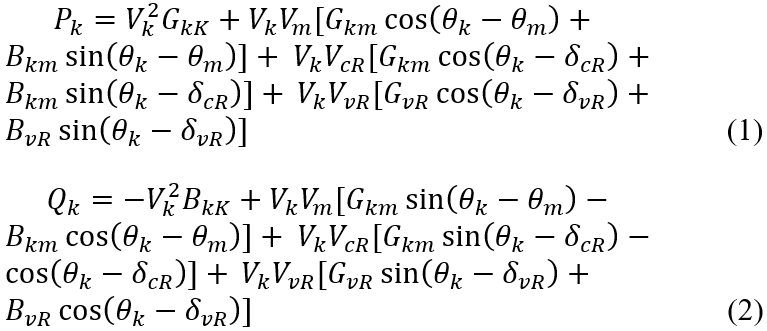
at Bus :
- HVDC Transmission system modeling
The HVDC modeling has been implemented in Voltage Source Converter VSC-HVDC system. Fig. 2 shows a graphical dSescription of the VSC-HVDC. Two converters, a rectifier and an inverter, are used in the VSC-HVDC system, and they are connected back-to-back or through a DC link [24].
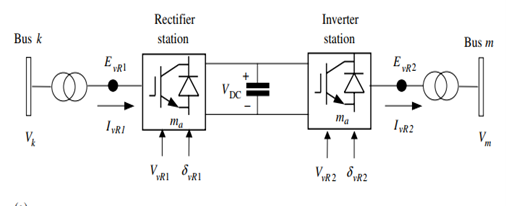
Fig. 2 description of the VSC-HVDC system
The correlation power equation and the phase voltage sources have the following appropriate expressions:
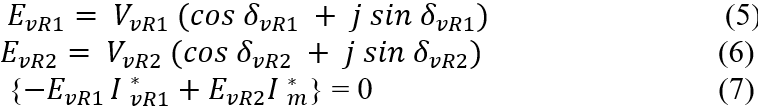
Where 𝐸𝑣R1 and 𝐸𝑣R2 are the HVDC shunt voltage sources in rectifier and inverter respectively and 𝑉𝑣R1 and 𝑉𝑣R2 are (the VSC output voltage 𝑉𝑣R) the shunt source voltage magnitude in rectifier and inverter, respectively with 𝛿𝑣R is the shunt source voltage angle.
According to the equivalent circuit given in figure (2), and assuming that the circuit is three phase, the admittance equation will be written as:
The active power flow between the AC system and the VSC was controlled by the phase angle 𝛿𝑣R.
The active and the reactive powers can be given as:
SHORT CITCUIT LEVEL (SCL)
The bus’s short circuit capacitance (SCC) or short circuit level (SCL) is calculated as the product of the pre-fault bus voltage and post-fault current magnitudes. It can be formulated as follows:
![]()
As AC systems increase in size, short circuit level rise along with the problems they cause. The HVDC jumper can be used to connect with two power systems without increasing the short circuit capacity since current control is crucial for DC transmission. Furthermore, the HVDC link does not cause the short circuit level at the connection buses to increase. Therefore, it won’t be required to change the circuit breakers in existing networks, which is very cost-effective. The HVDC systems by themselves do not significantly increase the AC power system’s short-circuit power.
POWER SYSTEM UNDER STUDY
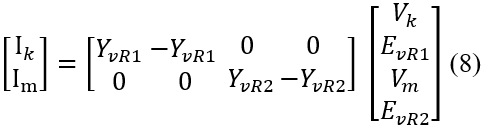
From a control standpoint, Iraqi electrical power system is divided into four operating subsystems: the North area, Middle area, Euphrates area, and South area. As shown in Fig. 3, the Iraqi (400 kV) super high voltage grid consists 52 buses, 27 of which are generating buses, 96 transmission lines [25].
In this study the network of south area (9-generator and 12 Bus bar) from the Iraqi power system is used as example, to show the proposed approach because more than 35 % from total generation in Iraqi power system comes from south area (it contains 9 from 27 generators placed at south area, especially at Basrah region). Because of the higher generation at this region, the Buses at this region have a higher short circuit level in the system. It raises transmission line losses and restricts the ability to transfer power. Power System Simulator for Engineering (PSS/E version 32 Package Program) was used to analyze the behavior of the system with adding the MT-HVDC transmission system and Unified Power Flow Controller (UPFC) in order to assess the reduction in short circuit level and losses at the transmission lines.
Fig. 3 the Iraqi (400 kV) super high voltage grid
RERULTS AND DISCUSSION
Three types of faults, which are three phase fault, line to ground fault, and one line outage fault (KAZG-SHBR), are assumed to occur near bus bar (4QRN) in the Basrah region in order to evaluate the reduction in short circuit level and transmission lines losses at the south area of Iraqi super high voltage grid. Fig. 4 shows the network of south area for Iraqi super high voltage grid.
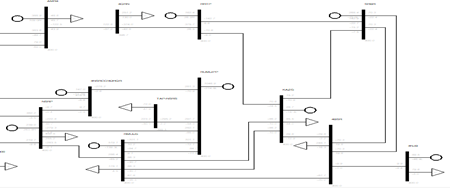
Fig. 4 south area network represented in PSS/E
Table Ⅰ show the short circuit level at the south area buses for the three types of fault before adding UPFC or MT-HVDC system.
TABLE Ⅰ SCL BEFOR ADDING UPFC or MT-HVDC
| Bus No. | Bus Name | SCL/Amp | ||
| 3-ph fault | L-G fault | L- out fault | ||
| 25400 | TAP-NSRS | 20668.3 | 12453.4 | 21715.2 |
| 25403 | NSRP | 28567.4 | 20789.6 | 31661.2 |
| 25404 | 4NSRCC/4DHQR | 26255.9 | 428.3 | 28513.7 |
| 26417 | AMR4 | 15172.9 | 12605.5 | 15205.4 |
| 27401 | RUMLIPP | 33216.5 | 49270.6 | 34522.1 |
| 27402 | 4QRN | 17220.9 | 12623.2 | 17273.9 |
| 27421 | HRTP | 25600.3 | 22084.2 | 25751.1 |
| 27426 | KAZG | 31494.8 | 27528.7 | 31853.2 |
| 27430 | RMULG | 33457.2 | 44858.8 | 34935.4 |
| 27450 | 4BSR | 30625.3 | 27865.4 | 30834.8 |
| 27451 | SHBR | 31731.0 | 30477.7 | 31949.9 |
| 27452 | 4NJB | 20424.4 | 10342.3 | 20504.7 |
At first, two UPFC (UPFC1 and UPFC2) are added to the south area in order to reduce the fault current and lines losses and simulate the behavior of the system under fault conditions. UPFC1is added between Bus (RUMLIPP) and Bus (NSRP), and UPFC2 added between Bus (KAZG) and Bus (HRTP) as shown in Fig. 5. And then three HVDC terminals are added to interconnect three areas of Iraqi super high voltage grid. First terminal placed at Bus (RUMLIPP) (Rumaila) in the south area, the second terminal at Bus (BGS4) (Baghdad South) in the middle area, and third terminal at Bus (KSEK4) (Mosul) in the north area, as shown in Fig. 6.
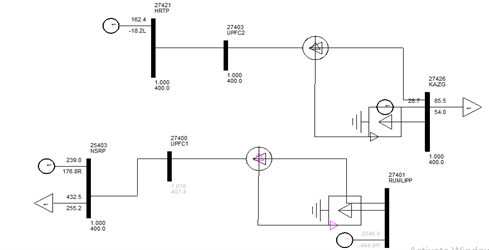
Fig. 5 Represent the UPFC with south area buses in PSS/E
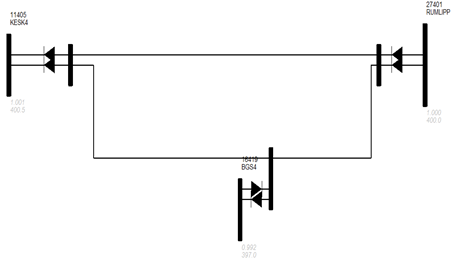
Fig. 6 Interconnected of MT-HVDC system with ISHV
In each case of fault, PSS/E was used to determine and compare the short circuit level with added two UPFC and MT-HVDC system. Short circuit level and its percentage reduction for buses of south area for the three type of fault are presented in Table Ⅱ, Table Ⅲ, and Table Ⅳ, respectively.
Table Ⅱ SCL for THE CASE of THREE PHASE FAULT
| Bus No. | Bus Name | HVAC | HVAC With UPFC | HVAC With MT-HVDC | ||
| SCL Amp | SCL Amp | SCL Reduction | SCL Amp | SCL Reduction | ||
| 25400 | TAP-NSRS | 20668.3 | 20250.0 | 2.024 % | 13119.9 | 36.521 % |
| 25403 | NSRP | 28567.4 | 26411.9 | 7.545 % | 20312.2 | 28.897 % |
| 25404 | 4NSRCC/4DHQR | 26255.9 | 24798.0 | 5.552 % | 18933.9 | 27.887 % |
| 26417 | AMR4 | 15172.9 | 13223.8 | 12.846 % | 11592.2 | 23.599 % |
| 27401 | RUMLIPP | 33216.5 | 31577.0 | 4.936 % | 29360.9 | 11.607 % |
| 27402 | 4QRN | 17220.9 | 15913.4 | 7.592 % | 12572.0 | 26.995 % |
| 27421 | HRTP | 25600.3 | 24611.5 | 3.862 % | 24143.2 | 5.691 % |
| 27426 | KAZG | 31494.8 | 30657.9 | 2.657 % | 29988.0 | 5.145 % |
| 27430 | RMULG | 33457.2 | 31924.9 | 4.580 % | 29854.4 | 10.768 % |
| 27450 | 4BSR | 30625.3 | 29941.6 | 2.232 % | 29487.3 | 3.716 % |
| 27451 | SHBR | 31731.0 | 30992.1 | 2.328 % | 30511.0 | 3.844 % |
| 27452 | 4NJB | 20424.4 | 20163.0 | 1.279 % | 19985.4 | 2.150 % |
Table Ⅲ SCL for THE CASE of LINE to GROUND FAULT
| Bus No. | Bus Name | HVAC | HVAC With UPFC | HVAC With MT-HVDC | ||
| SCL Amp | SCL Amp | SCL Reduction | SCL Amp | SCL Reduction | ||
| 25400 | TAP-NSRS | 12453.4 | 12154.4 | 2.401 % | 10119.3 | 18.742 % |
| 25403 | NSRP | 20789.6 | 18915.9 | 9.012 % | 17369.6 | 16.450 % |
| 25404 | 4NSRCC/4DHQR | 428.3 | 428.0 | 0.070 % | 426.5 | 0.420 % |
| 26417 | AMR4 | 12605.5 | 11539.3 | 8.458 % | 10757.3 | 14.661 % |
| 27401 | RUMLIPP | 49270.6 | 46864.0 | 4.884 % | 43607.7 | 11.493 % |
| 27402 | 4QRN | 12623.2 | 11419.8 | 9.533 % | 10691.6 | 15.301 % |
| 27421 | HRTP | 22084.2 | 21307.8 | 3.515 % | 21345.2 | 3.346 % |
| 27426 | KAZG | 27528.7 | 27064.4 | 1.686 % | 26748.7 | 2.833 % |
| 27430 | RMULG | 44858.8 | 43013.7 | 4.113 % | 40494.2 | 9.729 % |
| 27450 | 4BSR | 27865.4 | 27447.6 | 1.499 % | 27229.4 | 2.282 % |
| 27451 | SHBR5 | 30477.7 | 29970.0 | 1.665 % | 29717.5 | 2.494 % |
| 27452 | 4NJB | 10342.3 | 10297.1 | 0.437 % | 10265.9 | 0.738 % |
Table Ⅳ SCL for THE CASE of LINE OUTAGE FAULT
| Bus No. | Bus Name | HVAC | HVAC With UPFC | HVAC With MT-HVDC | ||
| SCL Amp | SCL Amp | SCL Reduction | SCL Amp | SCL Reduction | ||
| 25400 | TAP-NSRS | 21715.2 | 20250.6 | 6.744 % | 13110.1 | 39.627 % |
| 25403 | NSRP | 31661.2 | 26412.5 | 16.577 % | 20297.7 | 35.890% |
| 25404 | 4NSRCC/4DHQR | 28513.7 | 24798.6 | 13.030 % | 18921.1 | 33.642% |
| 26417 | AMR4 | 15205.4 | 15179.5 | 0.170 % | 11449.5 | 24.701% |
| 27401 | RUMLIPP | 34522.1 | 31660.2 | 8.290 % | 29208.2 | 15.392% |
| 27402 | 4QRN | 17273.9 | 17204.7 | 0.400 % | 12272.5 | 28.953% |
| 27421 | HRTP | 25751.1 | 25493.8 | 1.000 % | 22239.1 | 13.638% |
| 27426 | KAZG | 31853.2 | 31175.5 | 2.127 % | 29374.6 | 7.781% |
| 27430 | RMULG | 34935.4 | 32021.8 | 8.340 % | 29685.6 | 15.027% |
| 27450 | 4BSR | 30834.8 | 30448.2 | 1.254 % | 29484.6 | 4.378% |
| 27451 | SHBR5 | 31949.9 | 31547.4 | 1.260 % | 30495.1 | 4.553% |
| 27452 | 4NJB | 20504.7 | 20355.7 | 0.726 % | 19984.9 | 2.535% |
According to the tables above, adding an MT-HVDC transmission will reduce the short circuit level of all buses in the south area for the three types of faults when compared to adding a UPFC. For example, from table Ⅱ, the short circuit current for bus 4QRN reduced from (17220.9 Amp) to (15913.4 Amp) when adding a UPFC with percentage reduction of (7.592 %), and reduced to (12572.0 Amp) when added MT-HVDC transmission with percentage reduction of (26.995 %), and from Table Ⅲ, reduced from (12623.2 Amp) to (11419.8 Amp) when adding a UPFC with percentage reduction of (9.533 %), and reduced to (10691.6 Amp) when added MT-HVDC transmission with percentage reduction of (15.301 %). The average percentage reduction in short circuit level with adding a UPFC at three phase fault case is (4.786%), while with MT-HVDC transmission the average percentage reduction is (15.568%). Fig. 7, Fig. 8, and Fig. 10 illustrate the comparison of short circuit level reduction for three different types of faults: line to ground fault, three phase fault, and line outage fault.
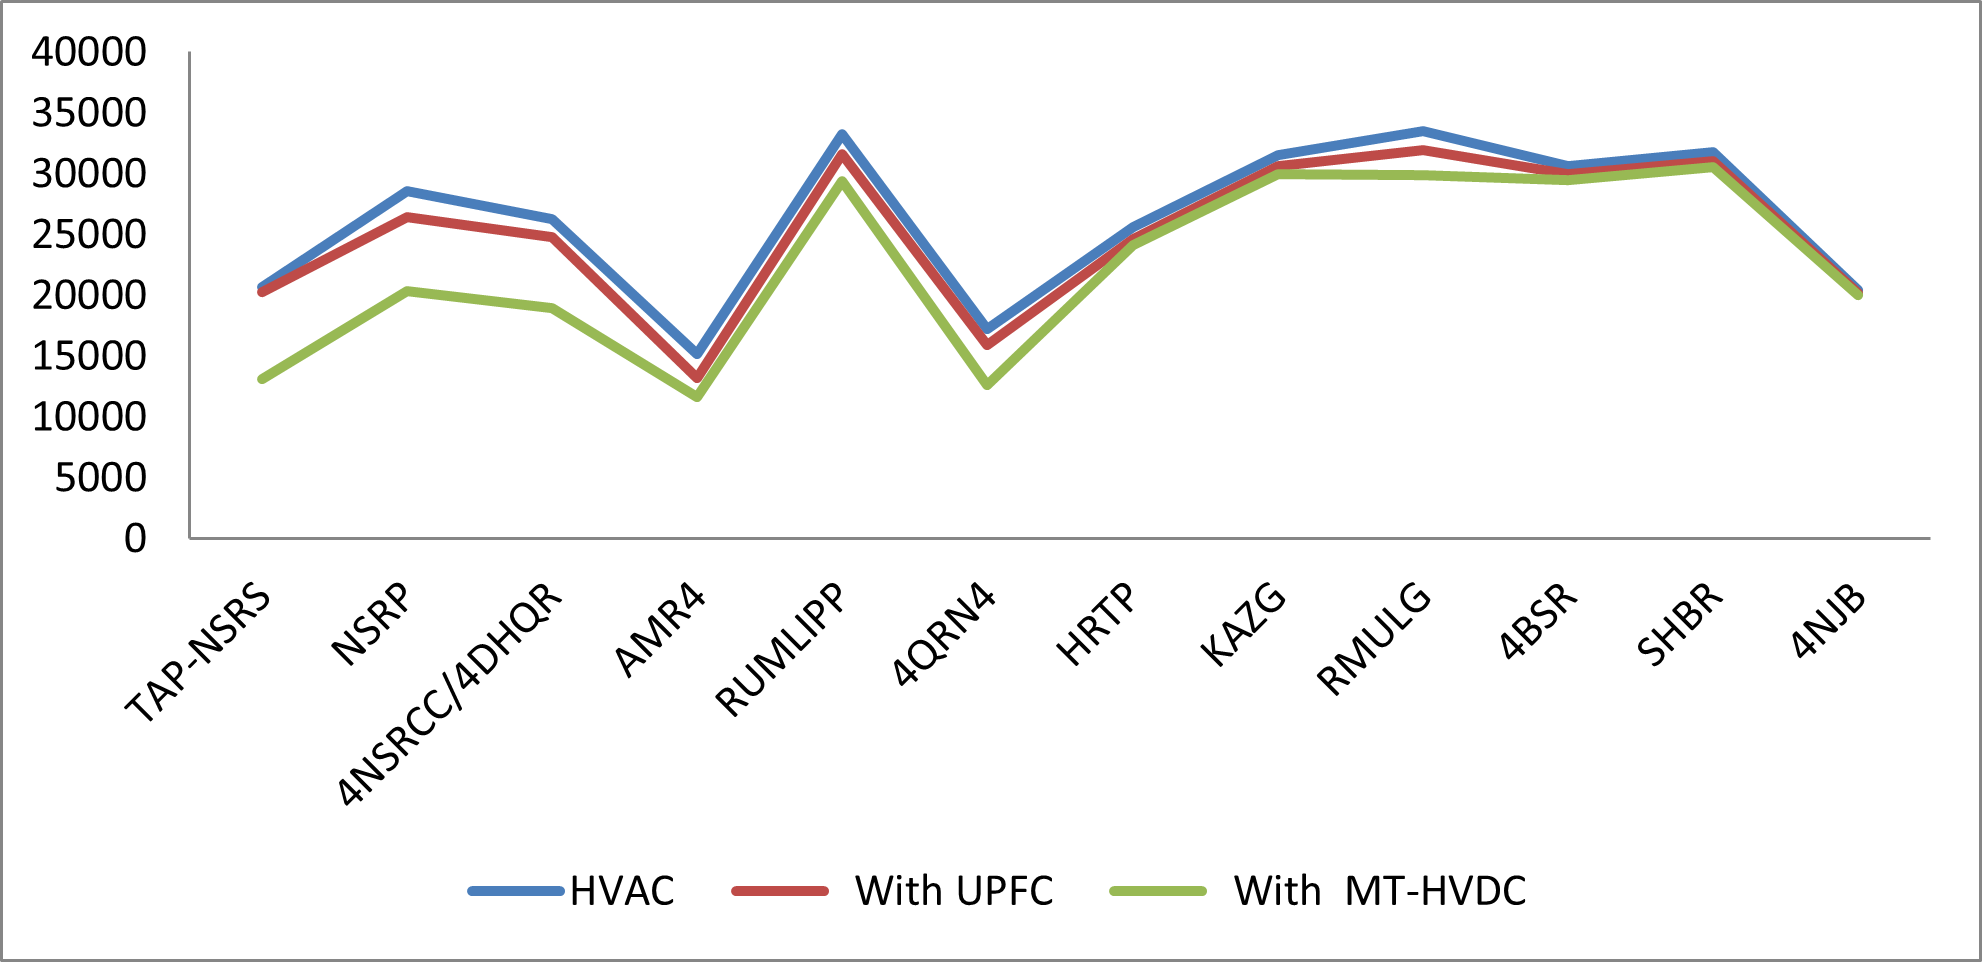
Fig. 7 SCL for three phase fault
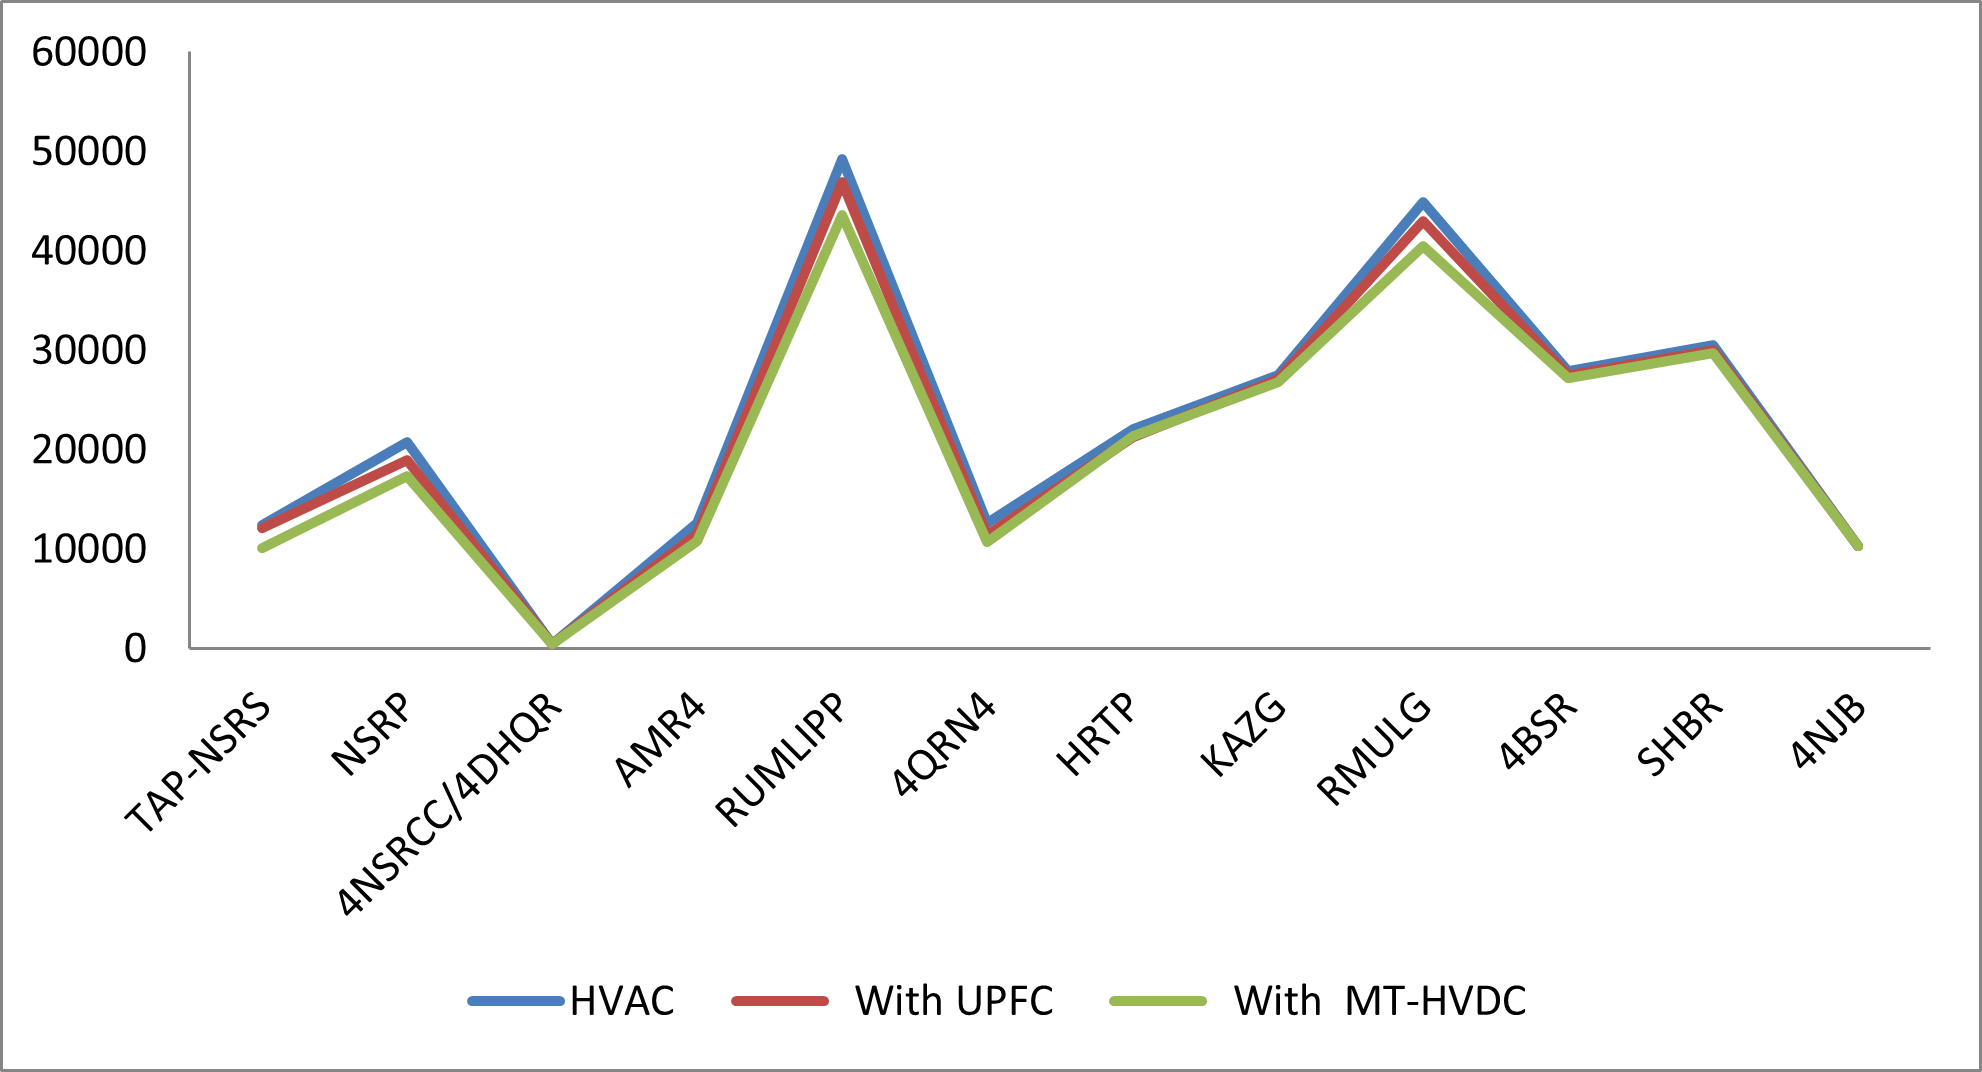
Fig. 8 SCL for line to ground fault
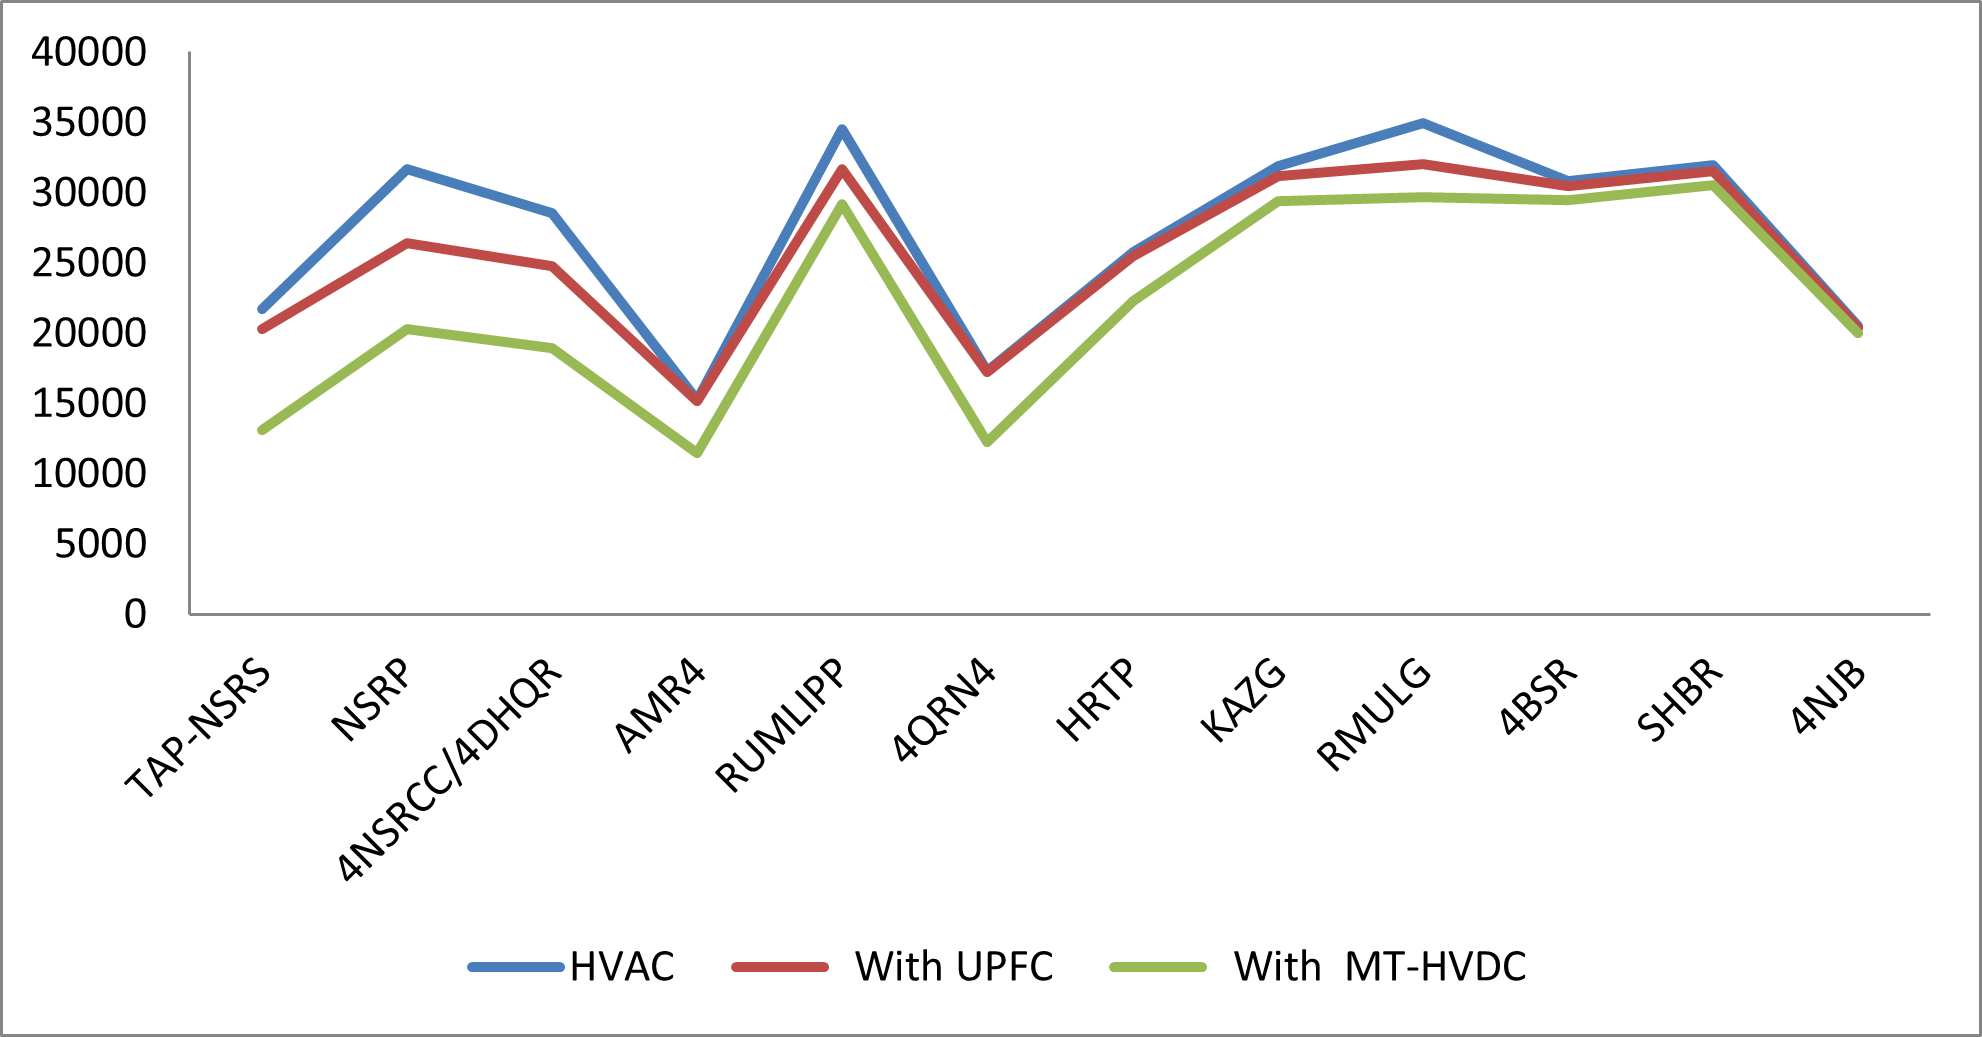
Fig. 9 SCL for line outage fault
As compared to installing a UPFC, the figures above demonstrate that adding an MT-HVDC transmission will reduce the short circuit level of buses in the south area. Therefore, adding new generation units, increasing the capacity of already-existing generators, or adding additional power from renewable sources can all increase transfer power without requiring the system’s protection equipment changed.
The comparative of active and reactive power losses at transmission lines of the south area without adding UPFC or MT-HVDC system and with adding it are shown in Table Ⅴ.
TABLE Ⅴ COMOARATIVE of LINE LOSSES WITHOUT ADDING UPFC or MT-HVDC and WITH ADDING IT
| Transmission
lines |
HVAC | HVAC With UPFC | HVAC With MT-HVDC | |||
| Losses | Losses | Losses | ||||
| MW | MVar | MW | MVar | MW | MVar | |
| HRTP-4QRN | 2.190 | 19.926 | 1.104 | 10.026 | 0.444 | 4.014 |
| HRTP-KAZG | 0.534 | 4.830 | 0.294 | 2.694 | 0.228 | 2.052 |
| HRTP-SHBR | 1.038 | 9.390 | 0.738 | 6.684 | 0.618 | 5.604 |
| 4QRN-AMR4 | 0.192 | 1.722 | 0.132 | 1.194 | 0.036 | 0.318 |
| KAZG-SHBR | 0.138 | 1.242 | 0.114 | 1.026 | 0.108 | 0.960 |
| KAZG-RUMLG | 1.614 | 13.434 | 1.404 | 11.67 | 1.068 | 8.898 |
| KAZG-4BSR | 0.138 | 1.254 | 0.102 | 0.942 | 0.09 | 0.846 |
| SHBR-4BSR | 0.048 | 0.372 | 0.048 | 0.36 | 0.042 | 0.318 |
| 4BSR-4NJB | 0.030 | 0.276 | 0.030 | 0.258 | 0.03 | 0.252 |
| RUMLIPP- RUMLG | 0.048 | 0.420 | 0.036 | 0.336 | 0.024 | 0.216 |
| RUMLIPP-NSRP | 5.016 | 45.156 | 1.986 | 17.886 | 0.678 | 6.000 |
| RUMLIPP-TAP NSR | 4.542 | 40.848 | 1.962 | 17.664 | 1.836 | 16.488 |
| RUMLIPP-4NSRCC | 5.310 | 43.488 | 2.100 | 17.184 | 2.064 | 16.926 |
Table Ⅵ compares the percentage reduction in active and reactive power losses of transmission lines with the addition of UPFC and MT-HVDC.
TABLE Ⅵ PERCENTAGE REDUCTION in ACTIVE and REACTIVE POWER LOSSES of TRANSMISSION LINES
| Transmission lines | Line losses reduction | |||
| HVAC With UPFC | HVAC With MT-HVDC | |||
| MW | MVar | MW | MVar | |
| HRTP-4QRN | 49.59 % | 49.68 % | 79.72 % | 79.85 % |
| HRTP-KAZG | 44.94 % | 44.22 % | 57.30 % | 57.51 % |
| HRTP-SHBR | 28.90 % | 28.81 % | 40.46 % | 40.32 % |
| 4QRN-AMR4 | 31.25 % | 30.66 % | 81.25 % | 81.53 % |
| KAZG-SHBR | 17.39 % | 17.39 % | 21.73 % | 22.70 % |
| KAZG-RUMLG | 13.01 % | 13.13 % | 33.83 % | 33.76 % |
| KAZG-4BSR | 26.08 % | 24.88 % | 34.78 % | 32.53 % |
| SHBR-4BSR | 0.00 % | 3.22 % | 12.50 % | 14.51 % |
| 4BSR-4NJB | 0.00 % | 6.52 % | 0.00 % | 8.69 % |
| RUMLIPP- RUMLG | 25.00 % | 20.00 % | 50.00 % | 48.57 % |
| RUMLIPP-NSRP | 60.40 % | 60.39 % | 86.48 % | 86.71 % |
| RUMLIPP-TAP NSR | 56.80 % | 56.75 % | 59.57 % | 59.63 % |
| RUMLIPP-4NSRCC | 60.45 % | 60.48 % | 61.13 % | 61.08 % |
Table Ⅴ and Table Ⅵ illustrate how each case leads to consistently reduce active and reactive power losses at the majority of transmission lines in this area. For instance, the active power losses for the line (HRTP-4QRN) are reduced from 2.190MW to 1.104MW with a percentage reduction of
49.59% when two UPFCs are added, while the active power losses are reduced to 0.444MW with a percentage reduction of 73.72% when multi-terminal HVDC transmission system is used. Fig. 10 compares the total active and reactive power losses of the southern area with and without the addition of MT-HVDC or UPFC systems.
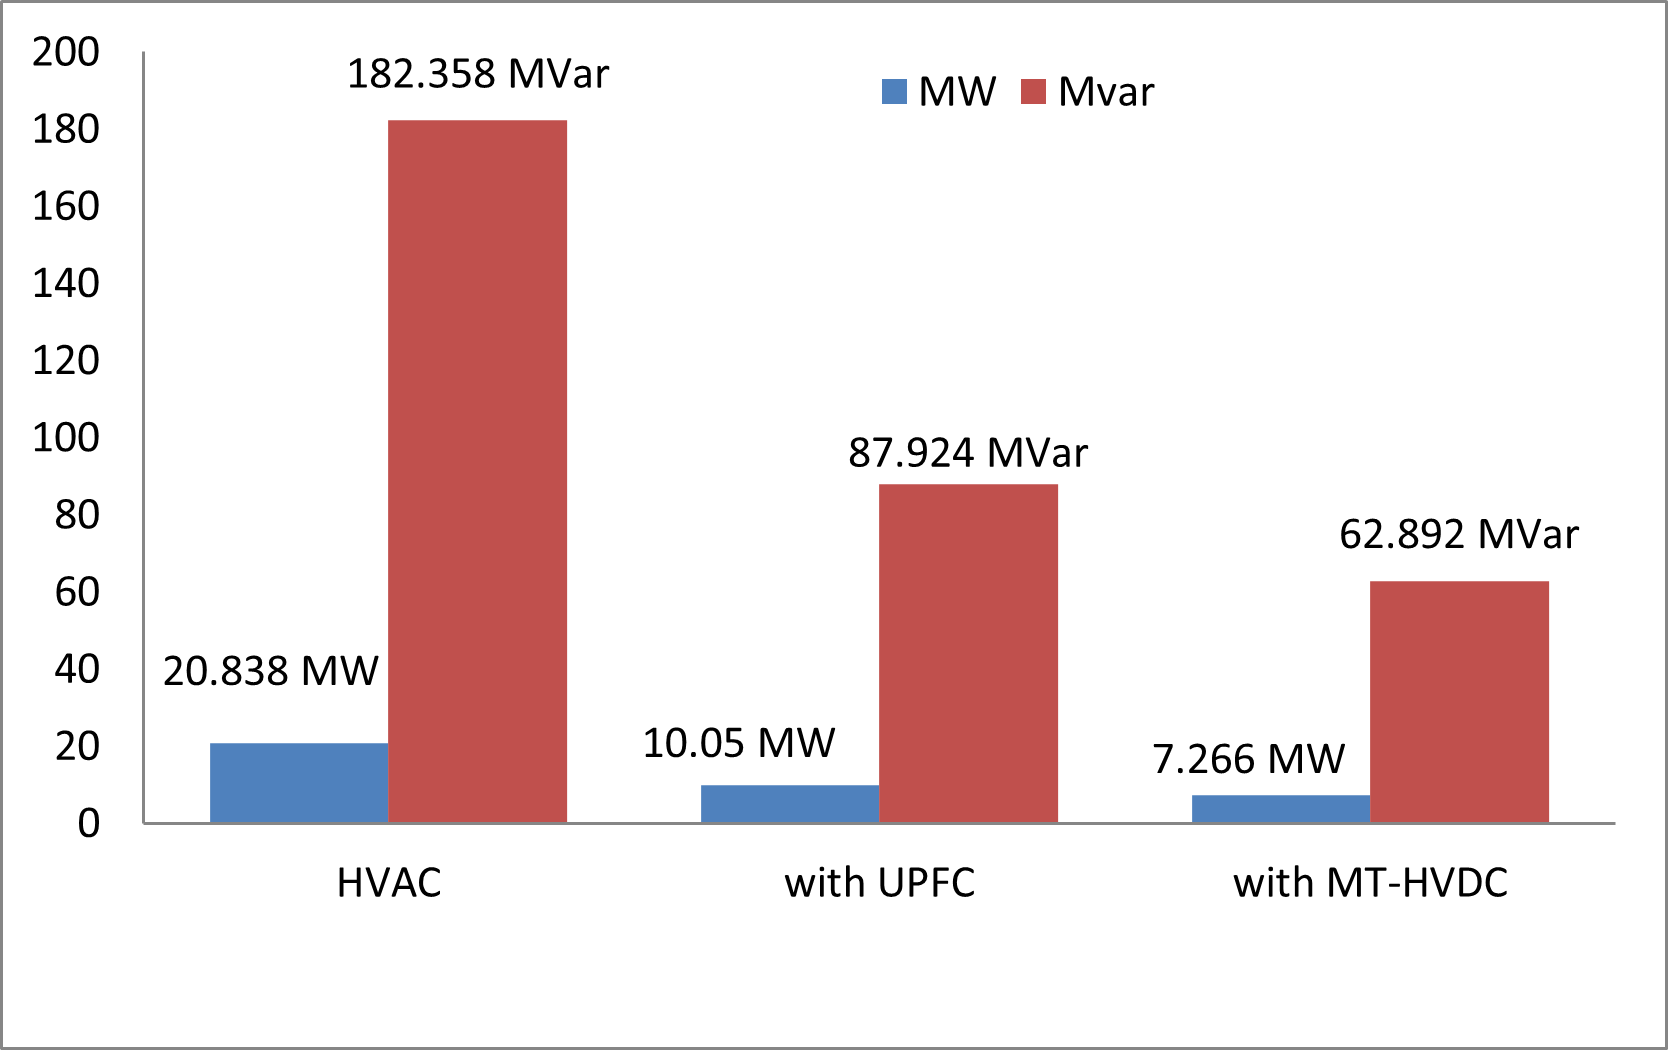
Fig. 10 Comparative of total active and reactive power losses of the south area
Fig.10 shows how adding UPFC or MT-HVDC transmission system reduces total active and reactive power losses at the southern portion of the Iraqi power system. It demonstrates that adding two UPFCs reduces active power losses from 20.838 MW to 10.05 MW, with a percentage reduction of 51.77%, and adding a multi-terminal HVDC system reduces active power losses to 7.266 MW, with a percentage reduction of 65.13%.
CONCLUSION
This study examined the impact of adding UPFC and MT-HVDC transmission system on the reduction in short circuit level and total network power losses at south area of the Iraqi super high voltage grid. UPFC and multi-terminal HVDC transmission are represented using the Power System Simulator for Engineering (PSS/E). Results show that, in comparison to adding two UPFC to the south area, adding one terminal (of the three terminals of the MT-HVDC system) to the south area and connecting it by DC link to the middle area and the north area results in a significant decrease in the short circuit level, transmission line losses, and total network losses. From the result, the active power losses are reduced by 51.77% after adding two UPFC while for the multi-terminal HVDC transmission system, the active power losses are reduced by 65.13%. The results show that the average reduction in short circuit level with MT-HVDC transmission is 15.568%, whereas the average reduction with adding a UPFC at three phase fault scenario is 4.786%. The results clearly show that, for three types of fault, a multi-terminal HVDC system is more effective at reducing short circuit levels and network power losses. Reduced short circuit levels and overall network losses will allow for increased power transfer capacity without needing replacement of the system’s protective equipment. The MT-HVDC transmission system not only reduces power losses and short circuit levels but also providing a routes to transfer extra power from the south to the middle or north without overloading the area’s AC transmission lines. As a result, the South’s network performance will improve, which will improve Iraq’s electrical power system.
ACKNOWLEDGEMENTS
We would like to extend a particular word of gratitude to the college of engineering University of Basrah and Operation and Control Office, Iraqi Ministry of Electricity,
REFERANCES
- Xiao H, Sun K, Pan J, Li Y, Liu Y, (2021 July). Review of hybrid HVDC systems combining line communicated converter and voltage source converter. International Journal of Electrical Power & Energy Systems. ;129:106713.
- Khazaei J, Idowu P, Asrari A, Shafaye A B, & Piyasinghe L, (2018). Review of HVDC control in weak AC grids. Electric power systems research. ; 162: 194-206.
- Schmitt H, (2006 January). Fault current limiters report on the activities of CIGRE WG A3.16. IEEE International Conference on Power and Energy Society General Meeting, 5, January.
- Kovalsky L, Yuan X, Tekletsadik K, Keri A, Bock J, & Breuer F, (2005). Applications of superconducting fault current limiters in electric power transmission systems. IEEE Transactions on Applied Superconductivity.: 15(2): 2130-2133.
- Xin Y, Gong W, Niu X, et al., (2006 July). Development of Superconducting Fault Current Limiters. the 6th International Conference on Power System Technology, Chongqing, China, July:1–5.
- Rahman M M, Rabbi M F, Islam M K, & Rahman F M, (2014, April). HVDC over HVAC power transmission system: Fault current analysis and effect comparison. In 2014 International Conference on Electrical Engineering and Information & Communication Technology: 1-6. IEEE.
- Li Z, Zhan R, Li Y, He Y, Hou J, Zhao X, & Zhang X P, (2018). Recent developments in HVDC transmission systems to support renewable energy integration. Global Energy Interconnection,; 1(5): 595-607.
- Wang H, & Redfern M A, (2010 August). The advantages and disadvantages of using HVDC to interconnect AC networks. In 45th International Universities Power Engineering Conference UPEC2010: 1-5. IEEE.
- Abbas Z N, & Tuaimah F M, (2021 February). Optimal location of high voltage direct current (HVDC) transmission line using genetic algorithm. In IOP Conference Series: Materials Science and Engineering,; 1076( 1): 012008.
- Grijalva S, Sauer PW, Weber JD. (2003). Enhancement of linear ATC calculations by the incorporation of reactive power flows. IEEE Transactions on Power Systems.; 18(2):619-24.
- Merzah AN, Abbas AH, Tuaimah FM, (2024 February). Enhancing Power Transmission Stability with HVDC Systems During Load Contingencies. Journal Européen des Systèmes Automatisés.;57(1).
- Cao J, Du W, Wang HF, Bu SQ, (2013 March). Minimization of transmission loss in meshed AC/DC grids with VSC-MTDC networks. IEEE Transactions on Power Systems.; 28(3):3047-55.
- Feng W, Tjernberg LB, Mannikoff A, Bergman A, (2013 July) A new approach for benefit evaluation of multiterminal VSC–HVDC using a proposed mixed AC/DC optimal power flow. IEEE Transactions on Power Delivery.; 29(1):432-43.
- Badr HM, Ali RS, Mahmood JR, (2022 April). Impact of Photovoltaic Systems Allocation on Congestion in Distribution Network: Iraq Case Study. Advances in Electrical & Computer Engineering.; 22(2).
- Salama AY, Shalaby M, Aziz AA, Refai RA, (2014 Mar). Aswan HighDam/Cairo proposed HVDC transmission system. Beni-Suef University Journal of Basic and Applied Sciences. ;3(1):37-44.
- Das MC, Dash R, Swain SC, Subburaj V, (2021 May). Performance enhancement of PI-controller using SVM for DFIG-grid interconnected system. In2021 2nd International Conference for Emerging Technology (INCET): 1-6). IEEE.
- Hassan SK, Tuaimah FM, (2020 June). Optimal location of unified power flow controller genetic algorithm based. International Journal of Power Electronics and Drive Systems.;11(2):886.
- Zellagui M, Hassan HA, Chaghi A, Ghorbani A, (2015 Jan). A comparative study of ground fault analysis for a practical case of a transmission line equipped with different series FACTS devices. Automatika.;56(3):262-74.
- Abdelkrim B, Merzoug Y, (2019 September). Robust stability power in the transmission line with the use of a UPFC system and neural controllers based adaptive control. International Journal of Power Electronics and Drive Systems (IJPEDS). ;10(3):1281-96.
- Oluwagbade ZV, Wara ST, Adejumobi IA, Mustapha AO, (2015 June). Effect of unified power flow controller on power system performance: A case study of Maryland 132/33/11 KV transmission station. International Journal of Emerging Technology and Advanced Engineering.;5(6):355-64.
- To’aima FM, Al-Aani YN, Salbi HA, (2015 July). Optimal location of static synchronous compensator (statcom) for ieee 5-bus standard system using genetic algorithm. Journal of Engineering.; 21(07):72-84.
- Akpojedje F O, Olomo A O, Mormah E C, and Okah E M, (2026). Optimal Power Flow Control on Power System Transmission Network using UPFC. Int. J. Eng. Trends Technol.;33(3): 118–125.
- AL-Rubayi RH, Ibrahim LG, (2020 January). Enhancement transient stability of power system using UPFC with M-PSO. Indonesian Journal of Electrical Engineering and Computer Science.; 17(1):61-9.
- Oni OE, Davidson IE, Mbangula KN, (2016 June). A review of LCC-HVDC and VSC-HVDC technologies and applications. In 2016 IEEE 16th International Conference on Environment and Electrical Engineering (EEEIC).: 1-7.IEEE.
- Iraqi Ministry of Electricity, (2022). Planning and Studies Office, Baghdad, Iraq.