
Geological and Geochemical Evaluation and Reserve Estimates of Ironstone Deposits of Ajali and Nsukka Formations in Owere Ezukala, Isuochi, Inyi, Achi and Environs, Southeastern, Nigeria.
- Akpunonu, Eliseus Okey
- Omeokachie, Adolphus Igwebuike
- 611-622
- Aug 8, 2024
- Geology
Geological and Geochemical Evaluation and Reserve Estimates of Ironstone Deposits of Ajali and Nsukka Formations in Owere Ezukala, Isuochi, Inyi, Achi and Environs, Southeastern, Nigeria.
*Akpunonu, Eliseus Okey and Omeokachie, Adolphus Igwebuike
Department of Geological Sciences, Nnamdi Azikiwe University, Awka, Anambra State, Nigeria.
DOI: https://doi.org/10.51244/IJRSI.2024.1107046
Received: 14 June 2024; Revised: 25 June 2024; Accepted: 28 June 2024; Published: 08 August 2024
ABSTRACT
This study is to assess the geological distribution and chemical composition of ironstone deposits of Ajali and Nsukka Formations in Owere Ezukala, Isuochi, Inyi, Achi, and environs for their industrial quality and to evaluate their reserves. The methods of study include field mapping, pitting, laboratory study and reserve estimation. Laboratory methods include thin section petrography and geochemistry. Field mapping results show that the ironstones are interbedded with sandstones of the Ajali and Nsukka Formations of the Anambra Basin. The results of the petrographic studies of the ironstones show that they consist of hematite varying from 35-70% in modal composition, with goethite embedded in masses of angular to subangular quartz. The geochemical analysis of ironstone samples show that total iron content varies from 21.36% – 64.19%. While the Owere Ezukala and Isuochi ironstone deposits with 38.33% – 64.19% and 42.32% – 49.67% total iron content respectively is suitable as raw material feedstock for the iron and steel production, the Inyi and Achi deposits with 21.36% – 30.91% and 24.38% – 34.50% total iron content respectively can be used as aggregates in engineering constructions. The effect of the deleterious elements TiO2, P2O5, BrO2 and sulphur present as trace will be mitigated by the application of the reverse anionic flotation method. The preliminary reserve of the ironstone was calculated and the result obtained shows that about 4,891,892.700 Tons occurs in the area of study. This quantity encourages location of steel industry within the Anambra Basin if other factors are available
Keywords: Ironstone, petrography, deleterious, reserve estimate, beneficiate.
INTRODUCTION
The ironstones under study are located within the stratigraphic units of Middle -Late Maastrichtian Ajali and the Late Maastrichtian – Danian Nsukka Formations of Anambra Basin, Southeastern Nigeria. The major occurrences were studied in Owere Ezukala, Isuochi, Inyi, Achi, Ogbunka, Awlaw, Enugwu-Abo Ufuma and Awgunta towns of southeastern Nigeria.
Iron ore and ironstone play a significant role in the supply of steel which forms a firm base for industrialization of Nations. Good estimation of iron ore and ironstone resources is a prerequisite for any sustainable steel production. The purpose of this study is to assess the quality and distribution of the ironstone of the study area and estimate their reserves.
The demand for steel will continue to rise due to increasing population, industrialization and housing development. There is need to have a data of information of the iron ore and ironstone resource of the Nigeria’s hard rock and soft rock basins. The geological and geochemical evaluation of ironstone resource of Anambra Basin has not been properly evaluated. This study provides geological and geochemical information about ironstone of the study area as well as its reserve estimates. The results will be a basis for the establishment of geological knowledge about currently unexplored ironstone deposits in other formations.
The origin of ironstones has been discussed by several authors (e.g. James, 1951, 1954; Hazel, 1955; Kimberly, 1974, 1989, 1994; Maynard, 1983; Adeleye, 1973, 1976; Macdiarmid and Park (1975), Ezepue and Mogbo, 1993; Franceschelli et al., 2000; Mutrux et al., 2003; Okoro and Nwajide, 2008).
Iron ore deposits are abundant in the schist belt of central Nigeria (Anike, 1987; Anike, et al., 1990; Anike, et al., 1993; Ojo, 1995). Two broad types of iron ore occur prominently in Nigeria. The first is the Banded Iron Formation (BIF) which occurs in folded bands and lenses associated with the Precambrian metasedimentary schist belts. Its prominent locations include Tajimi, Itakpe, Ajabanoko, Chokochoko, Birnin Gwari, Maru, Jamare, Farinruwa, KauraNamoda, Kakun, Isanlu, Roni and Ogbomosho. The second is the Cretaceous sedimentary iron deposits that occur around Agbaja, Koton karfi and Nsude areas (NGSA/MSMD 2010). Adeleye (1973, 1976) and Jones (1955) discuss the goethitic, oolithic and pisolithic ironstones of the Middle Niger Basin while Hazel (1955), Ezepue and Mogbo (1993) describe the occurrence of a similar goethitic ironstone deposit called Enugu ironstone.
Various methods had been employed to beneficiate the ironstone before use in direct reduction or blast furnace iron and steel making processes (example: Udomon 1996, Onyemaobi 1998, Ibekwe 1999)
The aim of this research is to evaluate the geological distribution and geochemistry of the ironstones of Ajali Sandstone and Nsukka Formation in Owere Ezukala, Inyi, Isuochi and their environs, South Eastern Nigeria and estimate their reserve.
Geologic Setting of Anambra Basin
The Anambra Basin is Cretaceous sedimentary domain partly sandwiched between the Southern Benue Trough below and the Niger Delta Basin above. It is one of the seven large sedimentary domains of Nigeria. It originated from the subsidence of a platform in the Southern Benue Trough, concurrent with the lateral translocation of the depocenters during the Santonian thermo tectonic event that folded and elevated the Abakaliki region. The basin fill consists of over 4500 meters of sediments packaged as the Nkporo Group and the Coal Measures which respectively document a major transgression and a major regression of the Late Cretaceous (Okogbue, 2005). Figure 1is the regional stratigraphy of the formations of Anambra Basin and it represents the totality of the lithic fill of the basin. The basin is exposed over a roughly triangular territory estimated at over 95000km2 (Nwajide and Reijers, 1996, Nwajide, 2006). The iron stone deposits occur within two lithostratigraphic units of the Anambra Basin – the Ajali Sandstone which belongs to a regressive phase, and the Nsukka Formation which belongs to the transgressive phase heralding the inundation that deposited the Paleocene Imo Formation of the Niger Delta Basin (Short and Stauble, 1967).
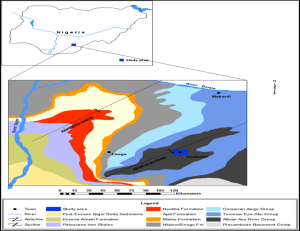
Fig. 1 Regional stratigraphy of the formations within the Anambra Basin. (Modified from Okogbue & Aghamelu, 2010).
MATERIALS AND METHODS
Materials
The basic geologic tools such as compass clinometers, base and topographic maps, measuring tapes, dilute hydrochloric acid, sample bags, geologic and sledge hammers, global positioning system (GPS), haversack, pix axe, shovel and hand lense were used during the field mapping. Pitting using shovels, pix axe and sledge hammer were employed to expose and collect fresh samples for laboratory determination of major and trace elements. Sections of the ironstone quarries at Ihe village, Owere Ezukala were studied (Fig.2).
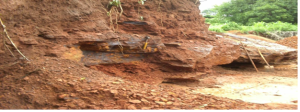
Fig. 2 Thick beds of Ironstone in Ihe village, Owere Ezukala
Method
The outcrops of the Ajali and Nsukka Formations were systematically mapped and logged and their lithologic units especially the ironstone occurrences identified. Thirteen fresh ironstone samples were collected from various locations within the study area for geochemical analysis. The locations of samples collected were noted using the global positioning system (GPS) and are recorded in fig.5. The samples were subjected to physical and chemical quality assessments. Analysis of ironstone samples for this study was conducted at the National Metallurgical Development Centre (NMDC), Jos. The analysis was done with the aid of X-ray Fluorescence Spectrometer-Energy Dispersive (XRF-ED) for instrumental analysis. The instrument model is P W 4025 with RH tube 2005.
Procedure
The samples were first crushed and pulverized in a cone crusher and sieved to 75micron particle size. Then 4g of the sieved samples were intimately mixed with 1g of lithium tetraborate binder (Li2B4O7) and pressed in a mould under a pressure of 10-15 metric tons/cm2 to pellets. The pellets were dried at 110oC in an oven for 30 minutes to get rid of the adsorbed moisture and were finally stored for analysis. The XRF-ED spectrometer was then switched on and allowed to warm up in order to stabilize the optics and the x-ray tube. It was then calibrated to determine the expected elements present in the samples. The samples were run using the prepared programs (calibrations) and the elements concentrations in the samples were calculated and displayed after applying automated statistics to the results by the spectrometer.
Thin sections of six representative samples of ironstones from the study area were made using the Logitech GTS1 cut off and trim Saw with CL 40 lapping machine. The thin sections were examined for petrographic characteristics of the ironstones
Preliminary Quantitative Estimation of the Ironstone Resource in the Study Area
Ironstone occurrence has been identified on the residual hills around Owere Ezukala, Ogbunka and Umueje. The occurrence also stretched to Ufuma/Inyi axis and around the drainage systems of the Mamu River and in Achi. Reserve estimate computations of ironstone deposit is made following the procedure in Popoff (1996) and Patterson (1959)
Calculation of Reserve of Ironstone Deposits:
Reserve = Vol. of deposit x Average ore grade x S.G of ore mineral—————————- (1)
Volume of deposit = Length of deposit x horizontal thickness (width) of deposit x vertical thickness (height) of deposit. —————- (2)
1. The length and horizontal thickness were obtained in the field using map scale 1:100,000
2. The vertical thickness was calculated from
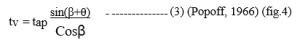
The relationships between the true, horizontal and vertical thickness are ttr = th sinβ = tv Cosβ——————— (4)
![]()
Where θ = angle intersecting the ore body in the plain of the true dip β = dip of bed tap = apparent thickness
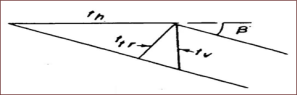
Fig.3 The relationship between the true, horizontal and vertical thick
The ironstone occurrences were represented with rectangular blocks (Popoff,1966) (Fig.5)
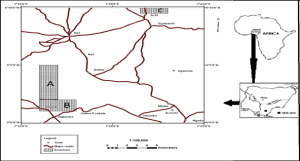
Fig. 4 Blocks indicating areas of ironstone mineralization evaluated.
Length of deposit =6500m Width of deposit =1600m
Vertical thickness = 178m
Average grade =0.4215 (iron content)
3. To calculate Average G
In Jolly’s Balance method, the specific gravity was calculated from equation below SG = Weight of sample/ loss of weight when immersed in water
SG = R2 – R1∕R2 –R3——————— (5) (Garg, 2012)
Where R2 = weight of sample +Spring R1 = weight of sample in air
R3 = weight of sample in water
4. The Reserve estimation was calculated from equation 1 for the study area as: Reserve = V x AV x S.G (6)
Where
V = Volume of the ore deposit AV = Average value of ore grade
S.G = Specific gravity or ore
RESULTS AND DISCUSSION
Results
Fig. 5 is the geologic map of the study area showing the distribution of ironstone deposits. The various localities within the study area from Ogbunka, Owere Ezukala, Ufuma, Inyi down to Achi are represented. The deposits of the study area occur in some locations as thick beds of ironstones as in Ihe village, Owere Ezukala (Fig.2). Tables 1, 2 and 3 are the results of geochemical analyses of ironstone samples collected from various localities in the study area. Table 1 is the results of major oxides of ironstone; table 2 is the iron contents of ironstone, while table 3 is the trace elements composition of iron stone from various localities in the study area. Figs 6 and 7 are charts of total iron contents in the ironstone and trace elements distribution in the ironstone respectively within the study area.
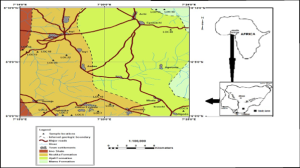
Fig. 5 Geologic map of the study area showing locations of Ironstones within the major Formation
Table 1: Results of major oxide analysis of ironstone samples from the study area.
| S/N | Location & samples | Al20
3 |
SiO2 | P2O
5 |
SO3 | K2 O | Ca O | Mn O | Fe2O3 | CuO | Zn O | Mg O | Na2 O | L.O. I |
| 1 | Ogbunka
(2) |
2.09 | 29.5
7 |
0.2
3 |
ND | 0.0
3 |
0.1
1 |
0.70 | 60.79 | 0.05 | ND | 0.21 | 0.31 | 5.44 |
| 2 | Owere- Ezukala
(3) |
1.35 | 39.2
0 |
ND | ND | ND | 0.1
1 |
ND | 56.55 | 0.06 | ND | 0.17 | 0.14 | 1.68 |
| 3 | Owere-
Ezukala (5) |
5.90 | 28.7
0 |
ND | ND | ND | 0.1
1 |
0.12 | 60.46 | 0.04 | 0.0
5 |
0.14 | 0.06 | 3.29 |
| 4 | Owere- Ezukala
(7) |
4.88 | 18.3
8 |
0.3
5 |
ND | 0.0
1 |
0.0
9 |
0.04 | 70.95 | 0.04 | 0.0
1 |
0.18 | 0.18 | 4.20 |
| 5 | Owere-
Ezukala (8) |
1.88 | 3.90 | 0.3
4 |
ND | 0.0
2 |
0.1
0 |
0.06 | 91.70 | 0.04 | ND | 0.74 | 0.29 | 0.32 |
| 6 | Isuochi
(10) |
2.68 | 36.1
0 |
2.2
0 |
0.0
6 |
ND | 0.1
1 |
ND | 54.75 | 0.08 | 0.0
2 |
0.16 | 0.15 | 3.16 |
| 7 | Ufuma
(16) |
1.80 | 40.0
0 |
1.4
0 |
0.2
1 |
0.4
0 |
0.1
8 |
0.06 | 52.09 | 0.07 | 0.0
4 |
0.14 | 0.06 | 3.15 |
| 8 | Ufuma (17) | 1.80 | 40.1
0 |
1.1
0 |
0.0
5 |
O.3 7 | 0.1
1 |
0.16 | 50.70 | 0.05 | 0.0
2 |
0.12 | 0.17 | 4.84 |
| 9 | Inyi (18) | 2.67 | 58.9
0 |
ND | ND | ND | 0.1
4 |
0.07 | 30.52 | 0.05 | 0.0
2 |
0.15 | 0.12 | 6.24 |
| 10 | Inyi (22) | 1.04 | 46.4
0 |
1.2
0 |
ND | ND | 0.1
6 |
0.03 | 44.15 | 0.06 | ND | 0.12 | 0.12 | 6.27 |
| 11 | Inyi (23) | 25.8
0 |
52.2
0 |
0.9
7 |
0.5
5 |
0.0
9 |
0.3
7 |
0.01 | 4.59 | 0.04 | ND | 0.15 | 0.06 | 3.31
6 |
| 12 | Achi (34) | 0.10 | 55.0
8 |
0.8
6 |
0.0
7 |
ND | 0.0
2 |
0.03 | 34.83 | 0.05 | ND | 0.15 | 0.10 | 8.42 |
| 13 | Achi (36) | 1.32 | 40.0
0 |
0.3
9 |
ND | ND | 0.1
8 |
ND | 49.29 | 0.05 | 0.0
3 |
0.12 | 0.15 | 7.84 |
Date: August 2009. Instrument model: (XRF-ED): P W 4025P with RH tube 2005, minimal for pan analytic. analysis at NMDC Jos, Nigeria Analyst: Omeokachie, A.I; L.O.I: Loss on ignition. ND = Not detected. Ogbunka (1); Owere Ezukala (2-5); Isuochi (6); Ufuma (7 & 8); Inyi (9 – 11); Achi (12 & 13
Table 2 Total iron content in the ironstone samples from the study area
| S/N | Sample location | Fe2O3 (t) % | Fe(t)% |
| 1 | Ogbunka (2) | 60.79 | 42.55 |
| 2 | Owere Ezukala (3) | 56.55 | 39.59 |
| 3 | Owere Ezukala (5) | 70.95 | 49.67 |
| 4 | Owere Ezukala (7) | 91.70 | 64.19 |
| 5 | Owere Ezukala (8) | 54.75 | 38.33 |
| 6 | Isuochi (10) | 60.46 | 42.32 |
| 7 | Ufuma (16) | 52.09 | 36.46 |
| 8 | Ufuma (17) | 50.70 | 35.49 |
| 9 | Inyi (18) | 30.52 | 21.36 |
| 10 | Inyi (22) | 44.15 | 30.91 |
| 11 | Achi (34) | 34.83 | 24.38 |
| 12 | Achi (36) | 49.29 | 34.50 |
Calculation of Fe(t) in Fe2O3(t)% Atomic wt of Fe = 56g
Atomic wt of O2 = 16g
Molecular wt of Fe2O3 = 2(56) + 3(16) = 160
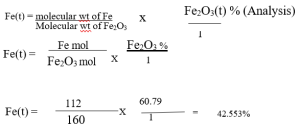
Table 3 Trace elements in ironstone deposits of the study area. ND= not detected
| S/N | Location | TiO2 | Cr2O3 | BrO2 | Rb2O | ZrO2 |
| 1 | Ogbunka (2) | 0.19 | 0.10 | 0.07 | 0.07 | ND |
| 2 | Owere-Ezukala (2) | 0.25 | 0.12 | 0.06 | 0.06 | 0.08 |
| 3 | Owere-Ezukala (5) | 0.29 | 0.11 | 0.06 | 0.07 | ND |
| 4 | Owere-Ezukala (7) | 0.28 | 0.12 | 0.08 | 0.08 | ND |
| 5 | Owere-Ezukala (8) | 0.32 | 0.11 | 0.16 | ND | ND |
| 6 | Isuochi (10) | 0.29 | 0.11 | ND | 0.07 | 0.04 |
| 7 | Ufuma (16) | 0.11 | 0.13 | 0.05 | 0.06 | ND |
| 8 | Ufuma (17) | 0.18 | 0.11 | ND | 0.07 | ND |
| 9 | Inyi (18) | 0.71 | 0.10 | ND | 0.03 | 0.18 |
| 10 | Inyi (22) | 0.13 | 0.12 | 0.04 | 0.04 | ND |
| 11 | Inyi (23) | 8.39 | 0.03 | ND | ND | 0.54 |
| 12 | Achi (34) | 0.08 | 0.10 | 0.03 | 0.04 | ND |
| 13 | Achi (36) | 0.13 | 0.12 | 0.05 | 0.05 | ND |
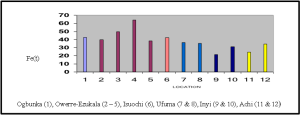
Fig. 6 Total Iron content in locations within the study area
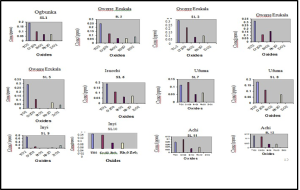
Fig. 7 Trace elements distribution in the ironstone samples
The result of petrographical analysis of ironstone examined as thin section under microscope is contained in fig.8 below.
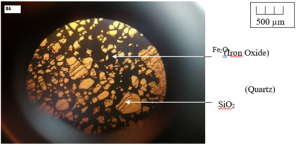
Fig .8 Photomicrograph of ironstone composed of quartz enclosed in opaque Fe2O3
Reserve Estimation of ironstone
The result of the ironstone reserve calculated from the three blocks are recorded in table below.
Table 4 Total Tonnage for the 3 Blocks.
| BLOCKS | Volume (V) (LxWxH) m3 | AVERAGE VALUE (AV) (Kg/m3) | Average S.G (S.G). | RESERVE 9Ton) (V x A.V x S.G |
| A | 6500 x 1600 x 178 | 0.4215 | 5.0 | 3,901,404,000 |
| B | 6500 x 1600 x 178 | 0.4215 | 5.0 | 990,356,400 |
| C | 240 x 75 x 5 | 0.294 | 5.0 | 132,300 |
| TOTAL | 4,891,892,700 |
Total estimate for the 3 blocks is 4,891,892.700 Tons
Discussion
Occurrence and Geological Distribution of Ironstone
The ironstone deposits occur within sandstone units of Ajali and Nsukka Formations; and their outcrops were studied mostly from quarry sites (fig. 2). Ajali Sandstone underlies Achi, Isuochi, Mbala, Agwunta and Egwuachi; while Nsukka Formation underlies Owere Ezukala, Ogbunka, Inyi, Ufuma, Umueje, Awlaw and Umuaka.
Geochemistry
The calculated iron contents (Table 2) indicate that total iron percentages in the ironstone ranges from 21.36% to 64.19%. Fig.6 indicates a chart of iron content as established within various locations. Silica is very prominent in all the samples. The oxides of potassium, calcium, sodium, manganese and magnesium are relatively significant. Also significant are the oxides of aluminum, phosphorous and copper. The result also show that sulphur was not detected for samples in Owere Ezukala (3-8), Inyi (18 and 22) and Achi (34) except for Isuochi (10), Ufuma (16) and (17) while the content for the rest of the elements were insignificant. The trace element concentration in the samples are shown in Table 5 while Fig.7 depicts a chart of trace element concentration in the ironstone samples
Petrographic Analysis:
Ironstones are distinctive among iron ores in being predominantly oolithic. Careful descriptions of the petrography of oolitic ironstone beds in Nkporo Formation have been presented by Okoro and Nwajide (2008). However, the ironstones of the study area differ in texture. The nature of the quartz grain suggests that the grains were pushed apart by force of cementation due to the introduction of the iron oxide. The unidirectional fractures observed in the quartz grains is indication of the post-depositional diagenetic compaction that affected the sediment and it is consistent with Folk (1968). Observation of the thin section also show that the usual contact between grains which ranges from point contact, concavo-convex to line contact were absent. This suggests that the iron oxide which was introduced post depositionally must have forced the grains apart. Thin section studies reveal cement consisting of hematite with goethite forming a meshwork enclosing angular to sub angular quartz crystals.
Economic Considerations
The result of geochemical analysis reveals that values for total iron content are over 42% in Owere Ezukala, Ogbunka and Isuochi areas. It decreases to the centre around Inyi and shows significant values in Ufuma to the east and Achi (Table 2). Percentage composition of the ironstone studied ranges from 21.36% to 64.19% (Tables 3 and 4). However, only the ironstone from Owere Ezukala with 91.70% Fe2O3 and 64.19% total iron (Fe t) meets the minimum iron content for direct reduction method of extraction. The rest requires beneficiation to attain the minimum iron content.
Industrial standards stipulate that, for an iron ore to be acceptable for use in the direct reduction reactor, it should contain 66% – 69% Fe and 1.5% – 2.5% silica. For the blast furnace operation, 62% – 67% Fe content and 5- 9% silica are the acceptable cut offs (Udomon, 1996). Impurities in iron ore deposits include silica, phosphorous, sulphur and titanium which occur as trace elements in the studied ironstones. Silica is objectionable because it displaces iron and so much lime is required to flux it. Titanium is undesirable because it drives much of the iron in a furnace to the slag. In general, sulphur and phosphorous are the most deleterious impurities in iron and steel industry (Onyemaobi, 1998). From the analysis, trace element concentration in Ogbunka indicates 0.19 ppm for TiO2 and 0.07 ppm for BrO2. In Owere Ezukala the concentration of TiO2 in all four samples vary from 0.25 to 0.32 ppm. This is followed by the concentration of Cr2O3 which range from 0.11 to 0.12 ppm. The concentrations of Rb2O and ZrO2 are minimal. The same trend obtains in Isuochi and Ufuma. However, there is a significant increase in the concentration of TiO2 (0.13 to 0.71 ppm) in Inyi, with diminished presence of other elements. The values become lower towards Achi in the northern part of the study area.
When compared with industrial standards, ironstones of the study area would require substantial beneficiation before use for the production of steel. The presence of deleterious components like P5+Cu2+ Cr2+, Ti2+BrO2 and sulphur in all the samples is a source of concern for use in steel industries. Fig.7 shows that the concentrations of the deleterious oxides in the ironstone are substantial. They are commonly above threshold for use in steel industry. There is therefore need to identify cheap methods to beneficiate the ironstone before use in direct reduction or blast furnace iron and steel making processes. However, the technique employed by Udomon (1996), which has been applied in the beneficiation of the low grade Agbaja – Lokoja ironstone and the Nsude ironstone, can be adopted for the beneficiation of the ironstones of the study area. Also, ironstone would be cheaply extractable by dispersion using newly developed local starch depressant capable of extracting between 84% and 93% of the total iron as in the Muro-BIF ores (Uwadiale and Nwoke,1985, Anike,1987).
Ironstones of the study area both high and low grade are presently quarried for use as civil construction material.
Reserve Estimation
The total reserve of ironstone that occurred in the study area, calculated from fig.4 and equation 6 is estimated at about 4,892,892,720 (four billion, eight hundred and ninety-one million, eight hundred and ninety-two thousand, seven hundred and twenty) tons. This quantity is encouraging for location of steel industry within the area.
CONCLUSION
The ironstones of the study area occur mostly as both thin and thick beds which were both diagenetic products and primary precipitates. The analyses of ironstones of Owere Ezukala, Inyi and Isuochi areas of Southeastern Nigeria show the total iron content ranges from 21.36% to 64.19%. The presence of deleterious components P5+Cu2+Cr2+, Ti2+BrO2 and sulphur is a source of concern for use in steel industry. Although with cleaning, the ironstone could be used but this would rather be expensive. Cheap methods have however been tested of late which could be applied to the ironstone deposit of the study area. Phosphorus removal f4om Nigeria’s Agbaja iron ore samples using a biological agent micrococcus species has revealed positive effects as up to 66.66% of phosphorus was solubilized by the microorganism (Obot and Anyakwo, 2012). The anionic method of Uwadiale and Nwoke, 1985 will also be applicable because of its lower cost. The beneficiation of the ironstones will upgrade them to a range of 62% to 69% iron content suitable for use in direct reduction operations. Petrographic studies show a matrix of hematite with goethite cement enmeshing angular to sub angular quartz grains.
The iron ores having the greatest commercial value at the present are usually those which are favorably located, of high quality and in considerable quantity. The ironstones of the study area are favorably located with the good network of roads. Preliminary evaluation of the ironstones in Owere Ezukala, Ogbunka, Inyi, Awlaw, Achi and Isuochi indicates a tonnage of 4,891,892.700Tons.The setting up of beneficiation plant in the area will however be considered when other factors like investment requirements, cost of mining and cost of ancillary services have been exhaustively evaluated. Mechanized open pit operations would be the recommended mining method since the stripping ratio of ironstone to the overburden will be minimal.
REFERENCES
- Adeleye, D.R. (1973). Origin of Ironstones, an example from the middle Niger valley, Nigeria. Jour. Sed. Pet. 43, 709-727.
- Adeleye, D.R. (1976). The Geology of the Middle Niger Basin. In Kogbe, C.A.(eds.), Geology of Nigeria, 2nd (ed).Rock View (Nigeria) Ltd, Jos, 335 – 339.
- Anike, O.L. (1987). The Geology and Economic Mineral Deposits of Areas round Muro Hill, Nigeria. Unpubl. M.Sc Thesis, University of Nigeria, Nsukka,
- Anike, O.L. Umeji, A. C., Onyeagocha, A. C. (1990). Geology and Geochemistry of Banded Iron Formation (B.I.F) from Muro Hill, S.W. Plateau State. Journal of Mining and Geology, 26(2), 21 – 26.
- Anike, O.L., Umeji, A.C. & Orajaka, I.P. (1993). Geology of Precambrian banded iron formation from Muro Hill, Nigeria. Economic Geology, 88, 1237 – 1241.
- Ezepue, M.C. & Mogbo, B.A. (1993). Geological and geochemical study of the Nsude ironstone near Enugu, Eastern Nigeria. Jour. Mining and Geology 29, 167 – 173.
- Folk, R.L.(1968).Petrology of Sedimentary Rocks. 1st ed. Hemphills Pub.Co.Austin, Texas, 182p. Franceschelli, M., Puxeddu, M. & Carta, M. (2000). Mineralogy and Petrology. Springer-Verlag Publication, Austria.
- Garg, S. K. (2012). Physical and Engineering Geology(7th ed) Khana Publishers Daryaganj,New Delhi- 110002. 800
- Hazel, J.R.T. (1955). The Enugu ironstone, Udi Division, Onitsha Province. Records of Geological Survey of Nigeria. 5, 44 – 58.
- Ibekwe, N.O. (1999). Beneficiation of Nigeria iron ore from Itakpe Mine. Journal of Science and Engineering Technology, 6(1), 1502 – 1510.
- Jones, H.A. (1958). The Oolitic Ironstones of Agbaja Plateau,Kabba Province. Rec. Geol. Surv. Nigeria(1955), 20 – 43.
- Kimberly, M.M. (1974). Origin of iron ore by diagenetic replacement of calcareous oolite. Nature, London, 250, 319 – 320.
- Kimberly, M.M. (1989). Exhalative origin of iron formations. Ore Geology Rev., 5, 13 – 145.
- Kimberly, M.M. (1994). Debate about ironstone: has solute supply been by surficial weathering, convection, or exhalation of deep fluids? Terra Nova, 6, 16 – 132.
- MacDiarmid, R.A. & Park, C.F. (Jr.). (1975). Ore Deposits.3rd (ed), W.H. Freeman and Co; San Francisco, U.S.A,
- Mutrux, J. G., Maher, M.D. (Jr.), Shuster, R.D. & Hays, T.D. (2003). Chamosite ooid horizons of the Arolinefjellet Formation, Spitsbergen, Norway.
- Nwajide, C. S. & Reijers, T.J.A. (1996). Geology of Southern Anambra Basin. In Reijers, T.J.A (Ed). Selected Chapters on Geology. SPDC Corp. Repro. Services, Warri, Nigeria.
- Nwajide, C.S. (2006). A guide for geological field trips to Anambra and related Sedimentary Basins in Southeastern Nigeria. Great AP Express Pub. Ltd., Nsukka.
- Obot,O.W & Anyakwo, C.N (2012). Removal of Phosphorus from Nigeria’s Agbaja iron ore through the degradation ability of Micrococcus species. Inter. Jour. of Water resources and Eviron. Engineering, 4(4). 114 -119.
- Ojo, O.M. (1995). Major iron ore reserves in Nigeria. The Crust, The Nigerian Mining and Geosciences Society Newsletter, 95(1), 36
- Okogbue, C.O. (2005). Hydrocarbon Potentials of the Anambra Basin: Geology, Geochemistry and Geohistory Perspectives. Great AP Express Pub. Ltd , Nsukka.
- Okogbue, C. O & Aghamelu, O.P. (2010). Comparison of the geotechnical properties of crushed shales from Southeastern Nigeria. Bulletin of Engineering Geology and the Environment. 69(4), 587 – 597
- Okoro, A.U. & Nwajide, C.S. (2008). Petrography and mode of formation of the oolithic ironstone beds in the Campo-Maastrichtian Nkporo Formation in Leru, southeastern Nigeria. Global Journal of Geological Sciences, 6(1), 57 – 62.
- Onyemaobi, O.O. (1998). Assessment of laboratory concentrator performance of Nigeria’s iron ore for steel production. Journal of Science and Engineering Technology. 5(1), 1026 – 1037.
- Patterson, J.A. (1959). Estimating Ore Reserves Follows Logical Steps. Engineering and Mining journal., 160(9),111-115.
- Popoff, C.C. (1966). Computing reserves of mineral deposits: Principles and conventional methods. U.S Department of of Interior, Bureau of Mines, Washington. 11
- Short, K.C. & Stauble, A.J. (1967). Outline of Geology of the Niger Delta. AAPG Bulletin, 51, p. 761 – 779. Udomon, U. (1996). Beneficiation and optimal utilization of Nigerian iron ores. Journal of Science and Engineering Technology. 3(1), 304 – 317.
- Uwadiale, G.O. & Nwoke, M.A.U (1985). Iron ore beneficiation. Journal of mineral and metallurgical processing, 2(3), 38-43.
FIGURE CAPTIONS
Fig.1 Regional stratigraphy of the formations within Anambra Basin which include Ajali and Nsukka Formations of the study area.
Fig. 2 Thick beds of ironstone in Ihe village, Owere Ezukala. A quarry site which is a typical outcrop or exposure of ironstone deposit ii the study area.
Fig. 3 The relationship between the true, horizontal and vertical thickness. This is used in the calculation of reserve of ironstone deposits.
Fig. 4 Blocks (A, B, C) indicating areas of ironstone mineralization evaluated.
Fig. 5 Geologic map of the study area showing locations of Ironstones within the major Formations. Fig. 6 Total Iron content in locations within the study area
Fig. 7 Trace elements distribution in the ironstone samples
Fig. 8 Photo micrograph of ironstone composed of quartz enclosed in opaque Fe2O3