
Impact of Demographic Dividend on Economic Growth: Bangladesh Perspective
- Sirajul Islam
- Prodip Chandra Roy
- 95-123
- Mar 1, 2024
- Education
Impact of Demographic Dividend on Economic Growth: Bangladesh Perspective
Sirajul Islam, Prodip Chandra Roy
Meiji University, Japan
DOI: https://doi.org/10.51244/IJRSI.2024.1102009
Received: 22 January 2024; Revised: 31 January 2024; Accepted: 03 February 2024; Published: 01 March 2024
ABSTRACT
In Bangladesh the window of opportunity has emerged since the 1979s will not last long and will not be repeated in the near future. It reaches its peak in the 2020s and will remain open until the 2035s. The demographic dividend is not given in automatic. This demographic dividend needs to be managed efficiently to capitalized better and sustained economic growth. This study attempts to estimate the contribution of the first demographic dividend on the growth rate of real GDP per capita in Bangladesh from 1991 to 2019 and provides empirical evidence concerning the net growth benefits derived from an increased share of the working-age population in Bangladesh. The analysis adopts decomposition analysis and econometric methods using time-series data. The results of regression exhibit that the relationship between demographic dividend and economic growth is positive (4.47%) which shows that demographic dividend has positive impacts on economic growth i.e., growth of the real GDP per capita.
Keywords: Window of Opportunity, Demographic Dividend, Working-age Population, Economic Growth, Real GDP per capita.
INTRODUCTION
Introduction
Recently the impact of demographic dividend has been focused particularly on the economic growth of developing countries. Demographic change in Bangladesh is opening a new economic opportunity. The objective of this study is to examine the impact of demographic dividend on the economy of the Bangladesh. In Bangladesh, a decline infant and child mortality helped to stimulate lower fertility, effectively resulting in a transitory baby boom. As this cohort enter working ages, Bangladesh has a higher potential to substantial share of workers as compared with dependents. If working-age cohort can be productively employed, to accelerate the economic growth of Bangladesh which is term as demographic dividend. To realize the dividends, Bangladesh will need educated, healthy and productive labor force. These partly depend on the policies of the government to build human capital, create a favorable environment for investment and encourage savings. This study aims to identify the challenges associated with the obstacles of inclusive economic growth and offer some policy recommendations to reap the more positive impact of demographic dividend in Bangladesh.
Recent studies (Bloom et al.,1999; Bloom et.al., 2001; Malmberg,1994; Lee,1980; Lindh,1999; Bloom,2011; Ahmad and Khan,2018; Ahmad and Alam, 2016) discuss a new dimension by empirically proving that population age structure has a more significant contribution to economic growth. The dynamics of age structure in this debate can attribute to Coale and Hoover (1958). They argued that sustained high fertility and declining mortality burden governments and households with high youth dependency ratio, reducing tax revenues and household savings. Economists and demographers have recently begun to focus on the impact of changing population age structure moving beyond the Malthusian emphasis on population growth (Mason, 2005; Bloom and Canning,1999; Bloom et. al., 2000; Bloom and Freeman, 1986; Bloom and Sachs, 1998; Bloom and Williamson, 1998, Bloom et.al., 2009). Interest in the relationship between population change and economic growth has reignited due to the demographic transition in developing countries, which are at varying stages of declining fertility and mortality rates. These studies have also enhanced understanding of education, health care, and employment condition in a country. The term demographic dividend is defined as a possible increase in economic growth due to an increasing share of working-age people in the total population. The demographic dividend is the result of an increase in the workforce which, if employed productively, can give rise to a demographic dividend. The concept of demographic dividend also reflects the significant contribution of female labor force participation in many studies. The demographic dividend is a time-based mechanism. It is not going to last forever.
The demographic dividend is the consequence of the demographic transition. This phenomenon occurs when the birth rate begins to decline and the age structure shifts to the working-age group (Islam, 2016). Since Bangladesh is experiencing a decline in fertility, it expects that the demographic dividend will lead Bangladesh to new economic heights. It is worth noting that the demographic dividend is a time-specific window of opportunity and will not last forever. Bloom, Canning, and Malaney (2000) suggest that demographic transition acts as an accelerator and catalyst for economic “miracle” in East Asia. Kelley and Schmidt (1996) stated that demography has a very favorable impact on economic growth, and declining mortality and fertility have notably increased economic growth. Bloom, Canning, and Sevilla (2002), through their research paper, discussed that the concept of the age structure of any country is crucial for economic growth because people in different age groups behave differently with different economic consequences. The young need investment in health and education, adults supply labor, income, and savings, and at old ages, there is a need for retirement income and, again, a requirement to invest in health. When the number of the working-age population is relatively larger than the dependent population, then there is an excellent potential for a significant economic outgrowth (Gribble and Bremner, 2012).
The demographic dividend can help to improve the living standards of the individuals through increasing capital, improving the quality of the labor force, increasing the female participation in labor force, slowing unsustainable fractionalizing of landholdings and increasing demand for goods and services (Matin, 2012).
Capital per worker is considered as a crucial factors of output per worker. Traditionally, two important factors have shaped output per worker which is capital per worker and level of technology. Economic growth occurs as a result of an increase in capital per worker if the level of technology remains constant. The rate of capital formation determined by savings and investment. A decrease in fertility and the youth dependency burden should lead to an increase in savings as required outlays for basic needs, health, and education decrease. This would give governments the option of investing in productive and growth-oriented activities, such as infrastructure development, that are important for job creation and poverty reduction. More people of working age and a lower dependency ratio contribute to savings, which can increase the investable surplus. As a result, increased savings are likely to contribute to higher investment rates and higher labor productivity.
The decline in fertility and population growth can contribute to human capital development by allowing governments to spend more money per child without increasing the overall budget, thereby improving educational quality. The decline in fertility leads to an increase in female labor force participation since women spend less time on bringing up children. The decline in fertility is also probably to promote education of girls, which can further increase female labor force participation by opening up new employment opportunities for women. The opportunity cost of women’s time spent on child-rearing rises as they enter the labor force. Women’s increased participation in productive employment opportunities will help to drive economic growth. Working women are also more likely to invest their earning in their children’s health and education, contributing even more to human resource development.
Savings and capital generated by the decline in fertility will have numerous multiplier effects. The establishment of new industries and the construction of factories will have a significant impact. Agricultural workers will most likely be the source of the increased demand for labor in the industrial sector, relieving pressure on the need to divide up agricultural landholdings. Furthermore, the decline in fertility will directly slow the fractionalization of land among family members. Through human capital accumulation, low fertility leads to higher per capita income and consumption of goods and services (Anderson, 2001; Bloom and Williamson, 1998; Birdsall et.al. (eds); 2003; Mason, 2001; Mason, 2007; Lee and Mason, 2009; Navaneetham, 2002; Nananeetham and Dhamalingam, 2009). In this study, we have selected Bangladesh perspectives to observe the relationship between the variables of economic growth and demographic dividend.
Window of Opportunity and Demographic dividend in Bangladesh
Most important, since demographic changes are dynamic, the period within which a country can reap a demographic dividend is finite and is called the “demographic window of opportunity.” With fewer births each year, the dependency ratio changes as a decline the dependent population (age 0-14 years and 65 years and above) of the country with the working-age population (age 15-64 years). When a country has fewer people to support, there is a window of opportunity for rapid economic growth if the demands of young people are prioritized. The window of opportunity occurs when the dependency ratio is about 60 dependents for every 100 working-age adults (Commission, 2017). For Bangladesh, the window of opportunity has no longer when compared with other countries. Figure 1.1 represent changes in three key population age groups that determine the demographic window of opportunity, presenting relative comparisons, growth rates, and projections to estimate the length of the demographic window of opportunity for Bangladesh.
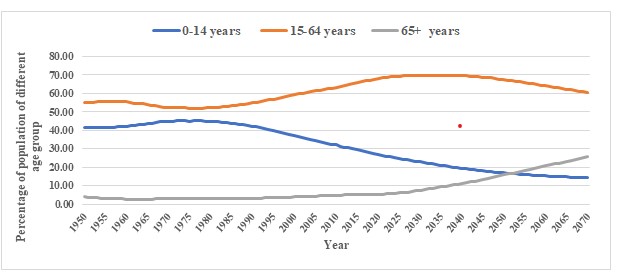
Figure 1.1 Percentage of population by broad age group from 1950-2070
Population growth rate by age group and working status, 1975 to 2075
We consider growth rates for the total population, working-age population, and dependent populations to determine Bangladesh’s demographic window of opportunity more precisely. The demographic window of opportunity occurs when the dependency burden is reduced due to the prominence of a large and growing working-age population compared to the dependent population. The window appears as the working-age population expands while child and old-age dependency ratios remain low. The window opens in a typical transition when the working-age population gains prominence. At the same time, birth rates fall, therefore, slowing the growth of the younger dependent population under 15. The window is open until the elderly population while growing, remains relatively small.
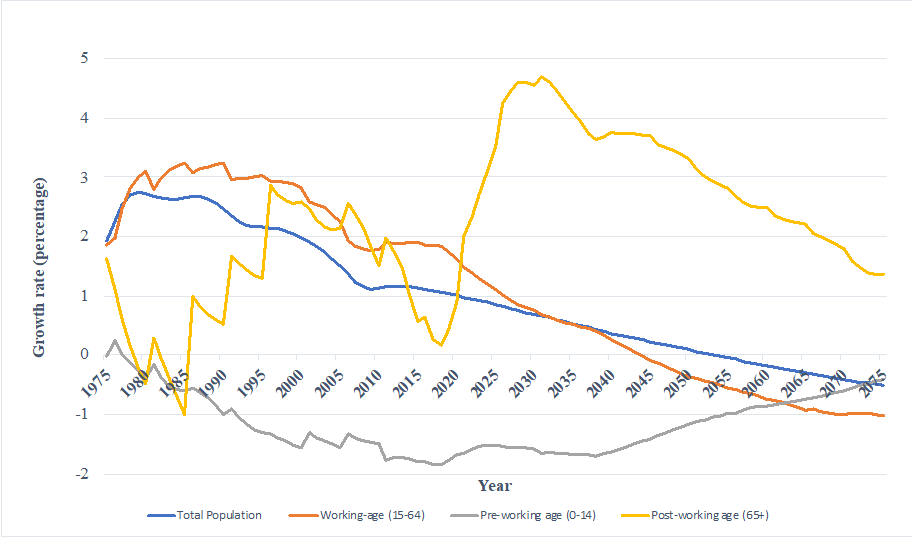
Figure 1. 2 Population growth rate by age group and working status in Bangladesh from 1975 to 207
To estimate the window of opportunity for Bangladesh, population growth by age group and status in 1975 to 2075 is shown in figure 1.2. The demographic window of opportunity for the demographic dividend occurs when the growth rate of the working-age population (ages 15–64) exceeds the total population growth rate, which considers the dynamics of the elderly and young population growth rates in relation to the population growth rate working-age population. The window closes when the total population growth rate begins to exceed the growth rate of the working-age population.
Figure 1.2 shows that Bangladesh currently within the demographic window of opportunity. The window started in Bangladesh in 1979 when the growth rate of the working-age (age 15-64) population first exceeded the overall total population growth rate. The window of opportunity is predicted to end in 2035 when the working-age population growth rate falls below the population growth rate for the first time since 1979. The demographic window of opportunity is estimated to 56 years which shows Bangladesh already has 40 years (about 71% of its window of opportunity) and has 16 years remaining to reap this dividend.
LITERATURE REVIEW
Prominent researchers have done several empirical examinations and investigations.
Table 2. 1 List of studies using econometric analysis for working-age population on economic growth
| S. l | Year | Topic Name | Authors | Method | Data | Results |
| 1 | 1998 | Demographic Transitions and Economic Miracles in Emerging Asia | David E. Bloom, Jeffrey G. Williamson | OLS, Two-stage LS | Using Panel Data: 78 countries from 1965-1990. | Positive impact |
| 2 | 1998 | Savings, Economic Growth, and Demographic Change | Andrew Mason | OLS Two-stage LS | Using Cross-sectional data and time series: 78 Asian and non-Asian countries. | Positive impact |
| 3 | 1999 | Age structure effects and growth in the OECD 1950-1990. | Thomas Lindh and Bo Malmberg | OLS | Using Pool and Panel Data: OECD Countries from 1950 -1990 | Positive impact |
| 4 | 2001 | Cumulative causality, Economic Growth, and the Demographic Transition | David E. Bloom, David Canning | Two-stage LS | Using Panel Data from 80 countries during 1965-1990 | Positive impact |
| 5 | 2001 | Scandinavian Evidence on Growth and Age Structure | Bjorn Anderson | OLS, Two Stage LS | Using Time Series Data | Positive Impact |
| 6 | 2004 | Global Demographic Change: Dimensions and Economic Significance | David E. Bloom, David Canning | OLS. Two stage LS | Using Panel Data: five-year intervals from 1965 to 1995. 507 observations. Countries not specified | Positive impacts |
| 7 | 2011 | The demographic dividend: Evidence from the Indian States | Shekhar Aiyar, Ashoka Mody | FE, Two-stage LS | Using Panel Data: 10-year intervals from 1961-2001 for the Indian states.
76 observations |
Positive impact |
| 8 | 2016 | Working Age Population & Economic Growth in Bangladesh: A time-series Approach | Sandip Sarker, Arifuzzaman Khan, Rezwan Mahmud | VAR,
VECM |
Using Time-series Data: from 1990 to 2014 | Positive impact |
| 9 | 2017 | Impact of Demographic Dividend on Economic Growth: A Study of BRICS and the EU | Roli Misra | FE
OLS |
Using Panel Data: BRICS and EU countries from 1990 to 2015 | Positive impact |
| 10 | 2018 | Swimming against the tide: economic growth and the demographic dividend in India | William Joe, Abhishek Kumar, Sunil Rajpal | OLS, TSLS | Using Panel data for 15 states of India and India as a whole from 1980 to 2010. | Positive impact |
| 11 | 2018 | Age-Structure, Human Capital and Economic Growth in Developing Economies: A disaggregated Analysis | Munir Ahmad, Rana Ejaz Ali Khan | Diff GMM | Using Panel Data: 67 developing countries from 1960 to 2014 | Positive impact |
| 12 | 2018 | Impact of the demographic dividend on economic growth | Zarina G. Kazbekova | FE, RE, and pooled OLS | Using Panel Data: 78 regions of Russia for 29 years: from 1997 to 2016 | Positive impact |
Source: Author compiled from different literature
METHODOLOGY
The study is based on secondary sources of time-series published data which is collected from the World Bank Indicator (WDI Databank), UN World Population Prospects (2019 Revision), Bangladesh Labor Force Survey (BLFS), Bangladesh Economic Survey (BES), Bangladesh Bureau of Statistic (BBS), Household Income and Expenditure Survey (HIES) and Bangladesh Bank Annual Report (BBAR). Using the country specific population projection data from the World Population Prospects (Revised 2019) published by the United Nation have been used to describe the different aspects and consequences of past and future demographic transition in Bangladesh. UN population prospects (Revised 2019) which has estimated and projected data, this section looks into what the future may hold for Bangladesh demographically. UN projections provide three variants- low, medium and high variants and this study uses mainly the medium variant to analyze the demographic in Bangladesh. In this study, dependent variable is growth rate of real GDP per capita and the independent variable is the factors of demographic dividend. Data frequency is time-series annual data and it is from 1991 to 2020.
Construction of an Econometric Model for statistical analysis and decomposition-based analysis for impact of demographic dividend on economic growth
For the construction of econometric models were collected time series data from Bangladesh during 1991 to 2019. The list of variables for regression analysis shown in table 3.1
Table 3.1 Definition of the Variables
| Variables | Definition | Relation to the dependent variable |
| ln GDPR | Logarithm of real GDP per capita (constant 2010 US$), %. Annual change in GDP per person during 1991 to 2019. | Constant |
| ln WA ratio | Logarithm of the working-age population (age 15-64), %. Annual changes working-age population in the total population during 1991 to 2019. | Positive (+) |
| G_WA ratio | The growth rate of working-age population (age 15-64), %. Annual changes working-age population in the total population during 1991 to 2019. | Positive (+) |
| Ln LFP | Logarithm of the level of labor force participation in the working-age population (economically active), %. Annual changes labor force participation in the working-age population during 1991 to 2019 | Positive (+) |
| G_LFP | The growth rate of the labor force participation in the working-age population (age 15-64), %. Annual changes labor force participation in the working-age population during 1991 to 2019 | Positive (+) |
| ln FLFP | Logarithm of the female labor force participation in the working-age population (age 15-64), %. Annual changes female labor force participation in the working-age population during 1991 to 2019. | Positive (+) |
| G_FLFP | The growth rate of the female labor force participation in the working-age population, %. Annual changes female labor force participation in the working-age population during 1991 to 2019. | Positive (+) |
| ln Sav | Logarithm of gross savings (% of GDP), %. Annual changes in gross savings (% of GDP) during 19991 to 2019. | Positive (+) |
| ln Edu Exp | Logarithm of education expenditure (% of GDP), %. Annual changes in education expenditure (% of GDP) during 19991 to 2019. | Positive (+) |
| ln EXP GS | Logarithm of exports of goods and services (% of GDP), %. Annual changes in exports in goods and services (% of GDP) during 19991 to 2019. | Positive (+)
|
| ln GCF | Logarithm of gross capital formation (% of GDP), %. Annual changes in gross capital formation (% of GDP) during 19991 to 2019. | Positive (+) |
| ln LE | Logarithm of life expectancy at birth, years, Annual changes in expected life time for newborn if mortality pattern remain constant at its birth year during 19991 to 2019. | Negative (-) |
Source: Author developed.
Theoretical model for econometric analysis and decomposition-based analysis
This article uses the theoretical model proposed by Bloom and Canning (Bloom and Canning, 2004) and later used in Mody and Aiyar (Mody and Aiyar, 2011). This model enables associating GDP per capita growth with the demographic factor. Let’s proceed to its description.
To examine the impact of demographic dividend on economic growth in Bangladesh the theory of economic growth under neoclassical framework (Solow,1956) is adopted. In general, the aggregated production function is as
Y=A*F(K,L)
Here, Y is the output, A is the technology, K is the capital stock and L is the labor force.
The above equation is modified by Cobble-Douglas and written as
Y = AKα L(1-α) …………………………. (1)
Here, Y is the output (income) level, A is technology which the total factors productivity (health, education and other factors affecting the productivity), is the physical capital, K is the labor force and L is the physical capital sensitivity of output (income) for the economy given time period. According to the endogenous economic growth model, it is assumed that the mechanisms which are endogenous in nature consisting the total factor productivity and changes in physical capital converge ultimately to a steady state level which as follows;
(Y⁄L)ss = Ass (Kss⁄L)α ………………….(2)
In equation (2), is the representation of steady-state level. There are endogenous factors that determine steady-state level of physical capital and TFP, hence determining the steady-state level of per worker output (income) as follows;
zss = Xβ ………………………………….. (3)
Here zss = ln(Y⁄L)ss is the steady-state level of per worker output (income) in natural logarithmic form for the country. While, X is the vector variables which can affect steady-state labor productivity and β is the vector co-efficient. From the endogenous growth theory, following can be written as follows;
gz = λ (zss-z0) ………………………….. (4)
In equation (4) gz is the growth rate of output (income) per worker, zss is the steady-state level of output (income) per worker, z0 is the initial level of output (income) per worker in natural logarithmic form, and λ is the speed of convergence (adjustment parameter).
The equation (4) expresses that the actual output (income) per worker will converge to steady state path slowly and hence involving time lag. So, the growth rate of output (income) per worker is proportional to the gap or distance between a country’s initial and steady-state level of output per worker. This feature of neoclassical economy is termed as conditional convergence assuming that poorer is the country, faster will be the growth rate of output per worker in it (Barro and Sala-I-Martin,1995).
Simply, manipulation of the equation (3) and (4) rewrite as follows;
![]()
The equation (5) is the output (income) per worker and owing to changing demographic variables, it cannot be assumed equivalent to the output per capita previously presumed by Solow (1956), Thus, we transform it into output (income) per capita using the framework developed by Bloom et al. (2000). So, we can rewrite as follows;
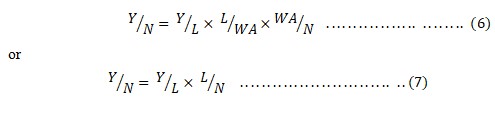
Here, Y is the gross domestic product or (output) income, N is the total population, L is the total labor force, WA is the working-age population. Here in equation (6), the income (output) per capita Y⁄N is decomposed into three components: i) Y⁄L indicates income (output) per worker or labor productivity; ii) L⁄WA captures the employment levels or the level of participation of labor force, and iii) WA⁄N reflects the changes in the proportion of working-age people in the total population. Again, in equation (7) the income (output) per capita Y⁄N is decomposed into two components: i) Y⁄L denotes income (output) per worker or labor productivity; ii) L⁄N shows per capita labor force.
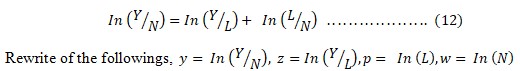
The equation (6) by taking the natural logarithms of both side of equation and a logarithmic transformation of identity followed by a total differentiation of the equation shows that growth rate of output (income) per capita can be written as the sum of growth of income (output) per worker, growth of labor participation and the growth of the ratio of the working age to the total population.
![]()
Rewrite of the followings,![]()
So, equation (8) rewrite as,
y=z+ρ+w ……………………….(9)
Next, moving to the growth rate, rewrite equation (8) in the following form
gy=gz+gρ+gw………………..…(10)
Here, gy is the per capita income (output) growth rate, is the income (output) per worker growth rate, is the growth rate gρ of labour force participation, gw is the growth rate of working-age population participation in total population.
Then, taking into account quations (5), (9) and (10), we get the expression of output per capita growth taking into account demographic variables as follows;
![]()
where gy is the growth rate of income (output) per capita, gρ is the growth rate of the level of participation in the labour force, g_w is the growth rate of the share of the working-age population in the total population, X is the vector of variables explaining the equilibrium output per employee (or productivity), β is the vector of coefficients, po is the level of participation in the labour force, wo is the initial value of the proportion of the working-age population in the total population, yo is the initial value of income (output) per capita, λ is the coefficient reflecting the speed of convergence.
Again, taking the consideration of the equation (7) rewrite as,
So, equation (11) rewrite as, y=z+ρ-w ………………… (13)
Then, moving to the growth rate, rewrite equation (11) in the following form
![]()
Here, gy is the per capita income (output) growth rate, gz is the income (output) per worker growth rate, gρ is the growth rate of labour force, gw is the growth rate of total population.
Now, taking into account quations (5), (13) and (14), we get the expression of output per capita growth taking into account demographic variables as follows;
![]()
Model Specification for Decomposition Analysis
The above equation (6) taking the consideration as a basis for further analysis and construction of econometric model specification. According to it
![]()
Here, Y is the gross domestic product or (output) income, N is the total population, L is the total labor force, WA is the working-age population. Here in equation (6), the income (output) per capita Y⁄N is decomposed into three components: i) Y⁄L indicates income (output) per worker or labor productivity; ii) L⁄WA captures the employment levels or the level of participation of labor force, and iii) WA⁄N reflects the changes in the proportion of working-age people in the total population. This identity indicates that, with an increased share of the working-age population and a high level of employment, there may be greater growth effects.
Model Specification for regression analysis
The above equation (11) taking the consideration as a basis for further analysis and construction of econometric model specification. According to it, the growth of per capita income (gy) should be positively correlated with the share of the working-age population at the initial point of time (wo)and the increase in the share of the working-age population (gw).
So the underlying regression model would look as follows;
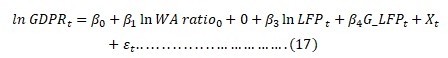
![]()
The logarithm of real GDP per capita for year t is the dependent variable (ln GDPRt). The natural logarithm of the percentage of the population of working age at the beginning of period t(lnWA ratiot), and the rate of growth of the proportion of working-age population for year t (G_WA ratiot) are interest variables. Regressors include the logarithm of the level of labour force participation at the beginning of period t (lnLFP_(t)), and the rate of growth in the level of participation in labour force for year t (G_LFPt), Xt is the vector of control variables that can affect the equilibrium level of labour productivity, ε_t are random model errors.
Calculation of the contribution of the demographic dividend to the growth of real GDP per capita
Using the equation (16), we assume that the proportion of working age population does not change over time. Then,
![]()
where In WA ratiot is the logarithm of the proportion of the population of working age at the beginning of period t, In WA ratioo is the logarithm of the proportion of the working age at the beginning of base year t = 0, G_WA ratiot is the growth rate of the share of the working age population in period t.
Now to calculate the difference between the equation (16) and (17), we get the first demographic dividend which reflects the contribution of the growing share of the working-age population to the growth rate of output (income) per capita.
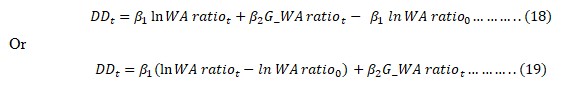
Where DDt is the value of the First Demographic Dividend in period t; nWA ratiot is the logarithm of the percentage of working age population at the beginning of period t; lnWA ratio0 is the logarithm of the percentage of working age population at the base year t=0, G_WA ratiot is the growth rate of the share of working age population in period t. Coefficient β1 and β2 were estimated by regression analysis and calculated the first demographic dividend.
RESULTS AND DISCUSSION
Table 4.1 shows the descriptive statistics of interest variables. The average growth rate of real GDP per capita is 4.03 from 1991 to 2019 in Bangladesh. The minimum and maximum values of the growth rate of real GDP per capita were calculated to 1.11 percent and 7.03 percent in 1991 and 2019, respectively. The average percentage of the working-age population (15-64 years) in the total population was 61.24 percent from 1991 to 2019. The minimum and maximum values were estimated to 55.09 percent and 67.60 percent in 1991 and 2019, respectively. The average growth rate of the working-age population (15-64 years) is 2.33 percent in the period from 1991 to 2019. The minimum and maximum values of the growth rate of the working-age population were estimated to 1.74 percent and 3.03 percent in 2019 and 1995, respectively. The average proportion of labor force participation in the working-age population (15-64 years) is 59.02 percent from 1991to 2019. The minimum and maximum values of the share of labor force participation in the working-age population were calculated to 58.71 percent and 61.41 percent in 2016 and 2019, respectively. The average growth rate of labor force participation is 2.50 percent from 1991 to 2019. The minimum and maximum values of the growth rate of labor force participation were estimated to 1.68 percent and 6.57 percent in 2009 and 2017, respectively. The average share of female labor force participation in the working-age population (15-64 years) is 30.04 percent from 1991to 2019. The minimum and maximum values of the share of female labor force participation in the working-age population were calculated to 25.51 percent and 38.39 percent in 2016 and 2019, respectively. The average growth rate of female labor force participation is 4.64 percent from 1991 to 2019. The minimum and maximum values of the growth rate of labor force participation were estimated to 2.99 percent and 12.65 percent in 2009 and 2017, respectively.
Table 4. 1 Descriptive statistic for interest variables
| Mean | Standard Deviation | Minimum | Maximum | |
| Growth rate of per capita real GDP (%) | 4.03 | 1.60 | 1.11 | 7.03 |
| Working-age population (15-64 years) (%) | 61.24 | 3.74 | 55.09 | 67.60 |
| Growth rate of working-age population (%) | 2.33 | 0.51 | 1.74 | 3.03 |
| Level of labor force participation (%) | 59.02 | 0.81 | 58.53 | 61.41 |
| Growth rate of labor force participation (%) | 2.50 | 0.94 | 1.68 | 6.57 |
| Level of female labor force participation (%) | 30.04 | 3.80 | 25.51 | 38.39 |
| Growth rate of female labor force participation (%) | 4.64 | 1.62 | 2.99 | 12.65 |
Source: Calculated by the author based on WPP, 2019 Revision
The Potential Impact of Demographic dividend: Decomposition-based Estimation
The growth of per capita was decomposed into three factors by using the decomposition approach: i) growth of output per worker; ii) growth linked to change in employment; and iii) growth of working-age to total population ratio (Joe et al., 2017; Chauhan and Arokiasamy, 2018).
Table 4.2 shows the decomposition of per capita real GDP (income) based on equation (6) which has described in chapter 4. Here annual growth rates of real GDP per capita (income) has been decomposed into three components by using the decomposition process: (i) the growth of real GDP (income/Output) per worker; (ii) growth of labor participation rate, and (iii) growth of the ratio of working-age to the total population. The average growth rate of real GDP (income) per capita for Bangladesh is 4.03 percent from 1991 to 2019. The decomposition represents that the growth of real GDP (income) per worker, growth in labor participation, and growth in the share of the
working-age population have contributions of 3.11 percent, 0.17 percent, and 0.73 percent, respectively, in the overall per real GDP (income) growth. To sum up, a higher share of the working-age population and increased labor force participation rates explain about 23 percent of the observed economic growth of Bangladesh.
Table 4. 2 Decomposition of growth of real GDP per capita by labor productivity, labor participation rate, and demographic factor (potentially productive population)
| Year | g(Y/P)
(%) |
g(Y/L)
(%) |
g(L/WA)
(%) |
g(WA/P)
(%) |
Relative Distribution | Total growth in per capita real GDP
(Value added) |
Impact of demographic dividend (%) | ||
| g(Y/L) | g(L/WA) | g(WA/P) | |||||||
| 1991 | 1.11 | 0.51 | 0.00 | 0.60 | 45.69 | 0.00 | 54.04 | 100 | 54.31 |
| 1992 | 3.11 | 2.36 | 0.03 | 0.70 | 75.71 | 1.09 | 22.63 | 100 | 24.29 |
| 1993 | 2.47 | 1.58 | 0.09 | 0.79 | 64.09 | 3.45 | 31.86 | 100 | 35.91 |
| 1994 | 1.69 | 0.76 | 0.09 | 0.83 | 45.24 | 5.03 | 49.27 | 100 | 54.76 |
| 1995 | 2.90 | 1.89 | 0.14 | 0.86 | 65.02 | 4.69 | 29.61 | 100 | 34.98 |
| 1996 | 2.32 | 1.62 | -0.07 | 0.76 | 69.79 | -2.93 | 32.68 | 100 | 30.21 |
| 1997 | 2.31 | 1.52 | -0.02 | 0.79 | 66.09 | -0.74 | 34.15 | 100 | 33.91 |
| 1998 | 3.01 | 2.19 | 0.00 | 0.81 | 72.58 | 0.00 | 26.84 | 100 | 27.42 |
| 1999 | 2.57 | 1.72 | 0.02 | 0.83 | 66.63 | 0.66 | 32.14 | 100 | 33.37 |
| 2000 | 3.26 | 2.38 | 0.02 | 0.84 | 73.07 | 0.52 | 25.78 | 100 | 26.93 |
| 2001 | 3.11 | 2.47 | -0.03 | 0.66 | 79.38 | -1.09 | 21.22 | 100 | 20.62 |
| 2002 | 1.96 | 1.27 | -0.02 | 0.70 | 64.68 | -0.87 | 35.75 | 100 | 35.32 |
| 2003 | 2.94 | 2.18 | 0.02 | 0.73 | 74.20 | 0.58 | 24.67 | 100 | 25.80 |
| 2004 | 3.55 | 2.80 | 0.00 | 0.74 | 78.69 | 0.00 | 20.73 | 100 | 21.31 |
| 2005 | 4.97 | 4.21 | -0.02 | 0.74 | 84.73 | -0.34 | 15.00 | 100 | 15.27 |
| 2006 | 5.24 | 4.82 | -0.15 | 0.56 | 91.84 | -2.92 | 10.72 | 100 | 8.16 |
| 2007 | 5.75 | 5.22 | -0.09 | 0.59 | 90.72 | -1.48 | 10.31 | 100 | 9.28 |
| 2008 | 4.81 | 4.23 | -0.07 | 0.62 | 88.03 | -1.42 | 12.92 | 100 | 11.97 |
| 2009 | 3.88 | 3.30 | -0.09 | 0.64 | 85.21 | -2.20 | 16.53 | 100 | 14.79 |
| 2010 | 4.39 | 3.78 | -0.07 | 0.66 | 86.06 | -1.55 | 15.00 | 100 | 13.94 |
| 2011 | 5.25 | 4.49 | -0.02 | 0.75 | 85.46 | -0.33 | 14.24 | 100 | 14.54 |
| 2012 | 5.30 | 4.54 | 0.00 | 0.72 | 85.77 | 0.00 | 13.61 | 100 | 14.23 |
| 2013 | 4.79 | 4.03 | 0.02 | 0.72 | 84.09 | 0.36 | 14.94 | 100 | 15.91 |
| 2014 | 4.86 | 4.08 | 0.00 | 0.74 | 84.09 | 0.00 | 15.29 | 100 | 15.91 |
| 2015 | 5.37 | 4.58 | -0.02 | 0.78 | 85.22 | -0.32 | 14.46 | 100 | 14.78 |
| 2016 | 5.95 | 5.18 | -0.02 | 0.75 | 87.03 | -0.29 | 12.62 | 100 | 12.97 |
| 2017 | 6.14 | 0.68 | 4.61 | 0.78 | 11.04 | 75.11 | 12.67 | 100 | 88.96 |
| 2018 | 6.74 | 5.63 | 0.28 | 0.76 | 83.62 | 4.12 | 11.35 | 100 | 16.38 |
| 2019 | 7.03 | 6.05 | 0.23 | 0.70 | 85.99 | 3.24 | 9.95 | 100 | 14.01 |
| Mean | 4.03 | 3.11 | 0.17 | 0.73 | 77.11 | 4.16 | 18.10 | 100 | 22.89 |
Source: Source: Calculated by author based on World Bank Data from 1991 to 2019.
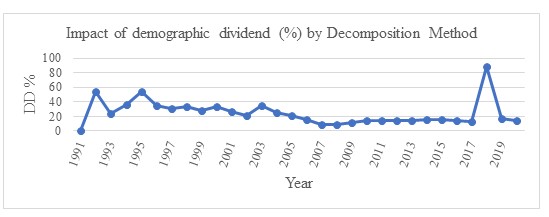
Figure 4.1 Demographic Dividend (%) by decomposition method from 1991 to 2019.
Regression Results by an econometric model
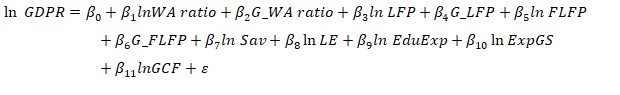
The following growth model was applied in the regression analysis and shows relationship between the natural logarithm of real GDP per capita (ln GDPR) as dependent variable and the logarithm of percentage of working-age (age 15-64) population in the total population (ln WA ratio), the growth rate of working-age population(G_WA ratio), the logarithm of level of labor force participation(ln LFP), the growth rate of level of labor force participation (G_LFP), the logarithm of the level of female labor force participation (ln FLFP), the growth rate of female labor force participation (G_FLFP), logarithm of life expectancy at birth in years (ln LE), logarithm of gross capital formation (ln GCF), logarithm of exports of goods and services (ln Exp GS), Logarithm of Gross saving (ln Sav) and logarithm of education expenditure (ln Edu Exp) as independent variables.
The growth rate of working-age population, the level of labor force participation, the female labor force participation, saving, education expenditure, exports of goods and services and gross capital formation are expected to have a positive correlation with the growth rate of real GDP per capita in the regression analysis. In contrast, the average level of life expectancy is expected to have a negative relationship with the growth rate of real GDP per capita.
Table 4.3 represents the results of estimating variable growth rate regression of GDP per capita on all regressors using the ordinary least square (OLS) method. The number of observations is 29. The square of the coefficient of determination R2 or the measure of goodness of fit is used to judge the explanatory power of the explanatory variables on the dependent variables. The R2 value is 99.97 percent which denotes the 99.97 percentage points of variations in the dependent variables accounted for by the variations in the independent variables. This indicates a perfect fit of the regression line.
Table 4.3 Results of regression analysis using ordinary least square (OLS).
| Dependent variable: Logarithm of real GDP per capita (ln GDPR) | |||||
| Variables | Co-efficient | Standard Error | t-Statistic | p-value | Significance level |
| Constant | -30.703879 | 2.47789983 | -12.39109 | 6.15103E-10 | *** |
| ln WA Ratio | -3.1481617 | 2.88449975 | -1.0914065 | 0.290321477 | Insignificant |
| G_WA Ratio | 0.06566837 | 0.01642216 | 3.99876602 | 0.000929688 | *** |
| ln LFP | 1.74505413 | 0.27407785 | 6.36700178 | 7.02067E-06 | *** |
| G_LFP | -0.051269 | 0.01311562 | -3.9090009 | 0.001129425 | *** |
| ln FLFP | 19.6368149 | 3.96615624 | 4.95109463 | 0.0001214 | *** |
| G_FLF | 0.02473128 | 0.00617682 | 4.00388495 | 0.000919434 | *** |
| ln LE | -5.5011385 | 0.50721896 | -10.845688 | 4.65087E-09 | *** |
| Ln Exp GS | 0.06446141 | 0.01912346 | 3.37080226 | 0.003629993 | *** |
| Ln GCF | 0.348954 | 0.12510664 | 2.78925246 | 0.012586772 | ** |
| ln Sav | -0.0206778 | 0.04623873 | -0.4471962 | 0.660378757 | Insignificant |
| ln _Edu Exp | -0.0493612 | 0.02398011 | -2.0584226 | 0.055214647 | * |
| R2 | 0.99973287 | ||||
| Adjusted R2 | 0.99956003 | ||||
| Number of observations | 29 | ||||
| ***denotes p-value < 0.01 (1%); **denotes p-value < 0.05 (5%); and *denotes p-value < 0.10 (10%) | |||||
Source: Calculated by author based on World Bank Data from 1991 to 2019.
The Potential impact of Demographic Dividend on Economy: Estimation by Regression Results
To examine the potential impact of demographic dividend on the economy of Bangladesh, we apply the following equation (19) for estimating the values of first demographic dividend from 1991 to 2019 which described in previous chapter.
![]()
Where, DDt is the value of the First Demographic Dividend in period t; n WA ratiot is the logarithm of the percentage of working age population at the beginning of period t; lnWA ratio0 is the logarithm of the percentage of working-age population at the base year t=0, G_WA ratiot is the growth rate of the share of working-age population in period t. Coefficient β1 and β2 were estimated by regression analysis (Table 4.3) are -3.15 and 0.07 respectively
.Table 4.4 represents the calculated values of the first demographic dividend from 1991 to 2019. According to the calculated results with interest variables, the average contribution of the first demographic dividend on economic growth in Bangladesh from 1991 to 2019 estimated approximately to 0.140 percent points. The average growth rate of real GDP per capita over a given period is approximately to 4.03 percent points. Therefore, we can conclude that the first demographic dividend (FDD) provided about 4.47 percent growth of the real GDP per capita in Bangladesh during 1991 to 2019.
Table 4. 4 First demographic dividend, growth rate of real GDP per capita and estimation of the growth rate of real GDP per capita if the proportion of working-age population (15-64 years) remained constant Bangladesh in 1991-2019.
| Year | FDD
(%) |
Growth rate of real GDP per capita (%) | Growth rate of real GDP per capita (without changes in the percentages of the population of working-age, i.e., excluding the FDD) (%) |
| 1991 | 0.179 | 1.11 | 0.93¥¥ |
| 1992 | 0.186 | 3.11 | 2.93 |
| 1993 | 0.185 | 2.47 | 2.28 |
| 1994 | 0.185 | 1.69 | 1.51 |
| 1995 | 0.186 | 2.90 | 2.72 |
| 1996 | 0.181 | 2.32 | 2.14 |
| 1997 | 0.181 | 2.31 | 2.13 |
| 1998 | 0.179 | 3.01 | 2.84 |
| 1999 | 0.176 | 2.57 | 2.40 |
| 2000 | 0.172 | 3.26 | 3.09 |
| 2001 | 0.160 | 3.11 | 2.95 |
| 2002 | 0.157 | 1.96 | 1.80 |
| 2003 | 0.151 | 2.94 | 2.79 |
| 2004 | 0.143 | 3.55 | 3.41 |
| 2005 | 0.134 | 4.97 | 4.83 |
| 2006 | 0.117 | 5.24 | 5.13 |
| 2007 | 0.110 | 5.75 | 5.64 |
| 2008 | 0.105 | 4.81 | 4.70 |
| 2009 | 0.104 | 3.88 | 3.77 |
| 2010 | 0.105 | 4.39 | 4.29 |
| 2011 | 0.110 | 5.25 | 5.14 |
| 2012 | 0.110 | 5.30 | 5.19 |
| 2013 | 0.110 | 4.79 | 4.68 |
| 2014 | 0.110 | 4.86 | 4.75 |
| 2015 | 0.109 | 5.37 | 5.26 |
| 2016 | 0.107 | 5.95 | 5.84 |
| 2017 | 0.106 | 6.14 | 6.04 |
| 2018 | 0.104 | 6.74 | 6.63 |
| 2019 | 0.100 | 7.03 | 6.93 |
| Mean | 0.140 | 4.03 | 3.89 |
Source: Calculated by author based on World Bank Data from 1991 to 2019.
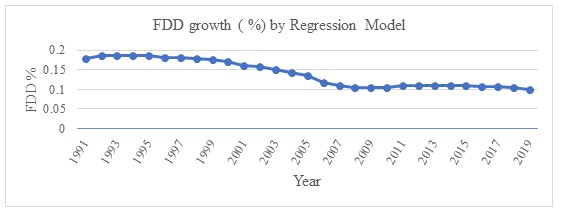
Figure 4.2 FDD growth (%) by Regression Model from 1991 to 2019
DISCUSSION OF FINDINGS
Growth of output per worker (Y/L) is known as the growth of labor productivity. The quantity of output obtained from each employee is defined as the growth of labor productivity, or the growth rate of output per worker. The growth rate of output per worker equals the growth rate of output minus the growth rate of the workforce. This equation demonstrates that the key to economic growth is the development of knowledge and skills rather than simply increasing the workforce overall. Economic growth is driven by invention, innovation, education, training, and improvements in social infrastructure in the long run. Labor productivity growth is primarily determined by three factors: savings and investment in physical capital, new technology, and human capital. The table clearly shows that the GDP per capita growth rate is primarily linked to faster worker productivity growth or labor productivity growth from 1991 to 2019. The average growth of output per worker is 77.11 percent from 1991 to 2019.
Growth due to labor productivity has increased from 1991 to 2019 except 1994 and 2017, which has declined labor productivity growth. Although various technological advances, labor productivity growth has stagnated or reduced in the world. Still, labor productivity growth has continued to increase in Bangladesh from 1991 to 2019 rather than in 1994 and 2017. Labor productivity has declined because of the introduction of a large number of workforces in the job market. But world productivity growth has declined from 3.9 percent in 2006 to 1.8 percent in 2016. Bangladesh must find out the reason behind the decline of labor productivity growth before addressing this issue.
Growth due to changes in the labor force participation or employment rate (L/WA) is the proportion of the potentially productive population of the working-age population (age between 15-64 years). Simply, the employment rate is the extent to which the available workforce (15–64 years of age) is utilized. Growth due to the labor force participation or employment rate changes has decreased between 1996 to 2016. But from 1991 to 1995, 1999, 2000, 2003, 2013, and 2017 to 2019, labor force participation or employment rate is increased significantly. The average growth of labor force participation or employment rate is 4.16 percent from 1991 to 2019.
Growth due to the share of the working-age population (WA/P) is the ratio of productive population to the total population in a country. The demographic component, i.e., the average growth of the share in the worker in population, contributed about 18.10 percent to the growth of per capita real GDP in Bangladesh from 1991 to 2019. It is shown that some years are experiencing a negative effect in work participation rate but are showing a positive impact on the contribution of age structure on the economic growth between 1991 to 2019 because it seems that work participation rate depends on the level of employment. In contrast, the age structure effect is due to an increase in the working-age population. So, the lack of employment rate and increase in the working-age population may negatively impact the work participation rate but can positively affect one contribution of age structure on economic growth.
Table 4.2 shows the average share of demographic dividends in the economy is approximately 23 (22.89%) percent from 1991 to 2019. The country’s per capita income increased due to three components: (i) an increase in income per employed (labor productivity); (ii) an increase in the proportion of the labor force which is employed; and, finally, (iii) an increase in the share of the productive or working-age cohort (labor force) in the total population. Consequently, positive growth in one or more of the three components is frequently obtained by negative growth of at least one component. For instant, if the extending of the window of demographic opportunity (an increase in WA/P) is associated with an increase in Y/L (labor productivity), the per capita income growth of the working-age population may not affect as employment for increasing population in the working-age cohort in the scarce jobs market (the decline employment rate). As a result, after the widow of demographic opportunity opens, the growth rate of per capita income may increase or decrease, depending on the simultaneous changes in productivity (positive change over time) and the employment rate (availability of jobs in the jobs market).
Table 4.3 shows the result of the regression analysis has affirmed that the current demographic change increases economic growth. As expected, the share of working-age population has a significant relationship with per capita real GDP which means the larger the working-age population, the higher the growth rate. The logarithm variable of the percentage of the working-age population in the total population shows the negative relationship between the percentage of working-age population and economic growth and statistically insignificant result, the finding may be unexpected, whereas the growth rate of the working-age population in the total population shows the positive relationship and statistically significant result. In Bangladesh, there are more people in productive age group than in the younger and older dependent age groups. The number of people in productive age group has had a strong positive effect on the economic growth while the number of people in the younger and older dependent age groups has had a negative effect on the economy. The size of young population is expected to a negative relationship with per capita real GDP growth due to more expends on education, health and feeding expenditure. Another would expect to find a negative relationship between the size of older population and per capita real GDP growth rates due to both incur health expenditure because of chronic degenerative diseases and loss of income resulting from morbidity and limited opportunity to be productively engaged. A similar finding that shows economic growth follows a life-cycle path is also used by other studies in Asia (Navaneetham, 2002), and in Scandinavian countries (Lindh and Malmberg,1999; Anderson, 2001).
The logarithm value of the level of labor force participation shows the positive relationship and the growth rate of labor force participation shows the negative relationship but both are statistically significant. As expected, the labor force participation increases, the growth rate of per capita real GDP increases. In Bangladesh, the growth rate of labor force participation is slightly increased in every year, but about 2.0 millions of young adults enter in the job market in every year, they are not properly absorbed by the job market, either they are unemployed or they absorb in informal job sectors, engaged to low paid job in the labor market or they are not so skilled to compete the technological advanced job market.
The logarithm value of female labor force participation and the growth rate of female labor force both shows the expected positive relationship and statistically significant result between female labor force participation and economic growth. The female labor force increased due to decline fertility and to spend less time for child-rearing and get more time to spend for education, skill development. The increase in female labor force participation in both rural and urban regions. The distribution of female employment across occupational status over time also shows increased participation of women in non-agricultural sectors, particularly in sales and service-related occupations, administrative and managerial (professional) occupations and service work. Their earning is expended not only for household and children expenditure, the expend more for skill development and productivity growth. Although decent environment, jobs creation and job security for women is still not satisfied. The positive relationship between the female labor force participation and economic growth was proved in regression analysis.
The change in life expectancy at birth in years shows the negative relationship and statistically significant result between the life expectancy and economic growth. As fertility decline, the young dependency ratio has decreased but elder dependency ratio has increased. The aging population has increased and the life expectancy has extended due to improve technological progress in medical services. The increased aging in the population has created increased costs in health care, retirement pensions, incomes and social security programs which explain the pitfall of economic growth. The negative relationship between higher life expectancy and economic growth was proved in the regression analysis. Some studies suggested that a one-year improvement in the population’s life expectancy contributes to an increase of 4% in output. This is relatively significant because the increased in health expenditure on improving health quality and improving life expectancy, physical and human capital might directly impact labor productivity (Bloom, Canning, and Sevilla, 2004). In other words, life expectancy may influence life cycle savings (Lee, Mason, & Miller, 2000) and capital formation and the expected returns to and investment in education (Islam, 2016). Thus, health improvement may increase output not only through labor productivity but also through capital accumulation.
The exports of goods and services shows the expected positive relationship between the exports of goods and services and statistically significant result. The exports of goods and services is increased, the economic growth is increased. After the garment sector, IT sectors is emerging sectors in Bangladesh. The young adults are become more skills and produces IT based products such software development, freelancing, graphics design, e-commerce and Facebook business and exports their products in international markets. The market demand education and openness of trade policy encourage the young adult more to exports their goods and services. In Bangladesh, the ICT exports earnings is about US$ 800 million in 2017 (Building Bangladesh’s Digital Future, CRI, 2018, p.19). The positive relationship between exports of goods and services and economic growth was proved in the regression analysis.
The logarithm value of the gross capital formation shows the expected positive relationship between the gross capital formation and economic growth and statistically significant result. The gross capital formation is increased and to invest in infrastructure development, technological advancement, industries and service sector development, openness of trade and update migration policy for remittance seeking and welfare of remittance earners. In Bangladesh, foreign remittance reserved about US$ 45 billion in May, 2021. The positive relationship between the gross capital formation and economic growth was proved in the regression analysis.
The gross savings shows the negative relationship between the gross saving and economic growth and statistically insignificant result. It is unexpected result because saving rate is increased, the investment also increased and the economic growth is increased. The need to spend less on basic needs due to lowering fertility and decline in youth dependency burden is perhaps to increases savings. Unfortunately, we found unexpected and insignificant result. It may be that more investment in productive and growth-oriented activities such job creation, infrastructure development, to purchase new technology and machinery, poverty reduction, elimination of child labor, education and health improvement and formation of human capital and labor productivity. Although national and domestic savings as percentage of GDP is increased in Bangladesh, unexpectedly, the regression shows negative relationship and statistically insignificant result.
The logarithm value of education expenditure shows the unexpected negative relationship between education expenditure and economic growth but statistically significant at below 6 percent level of significance. This implies that more expenditure on education resulted in more technological progress, probably with positive externality, thus in higher the economic growth. The more expenditure on human capital formation like increasing literacy rate and educational attainment, improving the human resource base not only in terms of numbers of the educated labor force but also the quality of education.
According to the result obtained in the Table 4.4, the contribution of the first demographic dividend (FDD) on economic growth in Bangladesh from 1991 to 2019 was much lower than in India, where the FDD provided about 39 percent of the growth of real GDP per capita in 1991-2001 (Mody and Aiyar, 2011). Mason (2005) has been estimated the FDD for different regions of the world and demonstrated that in the transition economies, the FDD accounted for about 39 percent of economic growth in 1970-2000. In industrialized countries, the FDD accounted for about 15 percent, and in East and South Asia, the FDD accounted for about 14 percent. Due to the use of different time intervals, the comparison with the results obtained in this work is not quite accurate. It can be noted that the estimation of the FDD in Bangladesh differs from that of Mason for a group of countries with transition economies. In Mason’s work, the size of the FDD is estimated using the growth accounting method (Sokolova, 2010).
The potential impact of the demographic dividend, and the existence of it does not improve economic growth automatically. As several papers suggest, the positive impact of the demographic dividend would exist only when the best economic policies were implemented in the best environment. The estimation of the potential impact of demographic dividend on economy of Bangladesh in this study suggests that although the demographic dividend indeed existed and to get benefits, it was not fully utilized in Bangladesh, probably the best policies were not implemented in order to obtain its more positive impact on the economic growth. The government should spend more money to utilize the positive impact of the demographic dividend while it exits.
Before the potential advantage of demographic dividend disappear, it is strongly suggested that several policies should be implemented in Bangladesh. Since the literature suggests that there is no automatic mechanism for the demographic dividend stimulates economies. Only when proper policies are implemented, then the more positive impact of demographic dividend appears, so that appropriate policies should be implemented in Bangladesh to utilize the fruit of demographic dividend while it exits.
Challenges for Bangladesh
To reap the demographic dividend through timely proper, and effective management of the demographic window of opportunity, Bangladesh needs to focus on quality education and to generate high-quality human capital through vocational and skill development training, job creation, and employment productively of the increased working-age population, the mobilizing the accumulated wealth and savings into productive investments in health care development, infrastructure development, industries, manufacturing and service sectors and IT sectors and policies for the socio-economic development. It has already been proved that in Asia, East Asian countries such as Japan, Korea, and China, and some OECD countries, the timely proper and effective management of the window of opportunity can successfully convert a population onus to a population bonus and can thus contribute to rapid economic growth and development. The working-age population in these countries has accounted for as much as one-third of the economic growth (Bloom and Williamson, 1998). The young generations have been successful because they are well educated and have benefited from policies that have helped create and sustain jobs. Countries in other Asian regions, such as Thailand, Malaysia, and Sri Lanka, are also preparing to reap the benefits of the demographic dividend as a high proportion of their educated and skilled population reaches the working ages. Therefore, there are several challenges the Government should need to address simultaneously for the country to capitalize on the demographic dividend.
Education: Human capital improvement
The country faces the challenge of improving the skill levels of those already in the labor force and those who enter the labor force with limited education. Poor quality primary education is attributed to a shortage of qualified teachers and inadequate school facilities in terms of the number of schools, classrooms, libraries, and playgrounds (Haider, 2014). Furthermore, secondary education in Bangladesh does not reflect market demands. As a result, traditional primary, secondary, and higher secondary education do not produce a sufficient skilled workforce. Given the needs of a changing global economy, it will be critical to establishing a link between Bangladesh’s education sector and the labor market (Haider, 2014). More efforts should be made to develop technically skilled human resources.
The education sector in Bangladesh faces challenges due to high attrition from schools and a low rate of adult literacy because of poverty, management problems, and inadequate budget allocation for the education section. Currently, Bangladesh spends about 1.33 percent of its GDP on education (world Bank, 2020), which is insufficient and lower than many other comparable countries in South Asia and falls much short of the UNESCO global standard allocation of education. The World Declaration on Education for all demands for allocation of at least 6 percent of GDP on education in 2015. In order to improve the quality of education, more investment is needed to upgrade school infrastructure facilities, improve teacher training, provide better compensation package to attract qualified candidates for teaching jobs, and improve the skill development of the young generation.
Despite positive employment growth and higher university participation, there is a paradox of high graduate unemployment, often substantially higher than total unemployment. According to the Economic Intelligence Unit (2014), published a report on graduate unemployment in South Asia, about 47% of graduates are unemployed, although the overall unemployment rate is around 5 percent in Bangladesh. The report also attributes the graduate unemployment problem are rapidly expanding due to the poor-quality private education sector and using of outdated curricula in public universities. Despite a large number of graduates in various subjects from public and private universities, there is a shortage of skilled labor in particular fields. Due to the high demand for skilled labor, graduate unemployment remains high in Bangladesh. There is a challenge for policymakers to solve the gap between employment and skilled labor in the labor market.
Creation of jobs
Bangladesh faces a herculean task in accommodating its expanding labor force. Between 1981 and 1991, the working-age population increased by 2.39 percent per annum, and decline to 2.25 percent per annum in 2002-03 and again increased to 3.45 percent per annum from 2005-06 to 2010. But there was a sharp decline to 2.3 percent per annum in 2010-2013 and further decline to 1.30 percent during 2014 to 2016-17 and again increase 1.81 percent per annum during 2017-1019. Therefore, the working-age population increased by about 2.26 million per annum from 1991- 2011, and by another 1.83 million per annum from 2011 to 2020 over and above and enter the labor market. In Bangladesh, the total absorption of surplus labor will need to create 1.83 million jobs every year.
Emphasis should be given on skill development in order to meet the potential demand for jobs requiring a relatively higher skill level, particularly in key industrial sectors, including export sectors, such as agro-food, tourism and hospitality, pharmaceuticals, and ceramics, furniture making, and for migration in abroad (World Bank, 2019). Furthermore, the supply-side shortage of skilled labor, there is a demand-side shortage related to the structure of the economy, which simply is not generating enough demand to absorb skilled labor.
To sustain higher economic growth, both public and private investment is required to ensure greater absorption of the rising labor force in productive jobs. Investment is critical for job creation, savings, and economic growth. The investment to GDP ratio is very low in Bangladesh. Investment accounted for 31.6 percent of GDP in the fiscal year 2018-19. The share of public and private investment was 23.5 percent and 8.1 percent of GDP, respectively (Bangladesh Economic Review, 2019). To obtain double-digit GDP growth, more investment is needed in the public and private sectors and attract FDI to boost and maintain growth in income.
Public investment is required to increase agricultural productivity and to promote growth in the manufacturing and service sectors. The most important investments in this regard are in transportation, power, and gas. Perhaps the most significant impediments to sustained higher growth are power and transportation networks. Public-private partnership (PPP) is also playing a vital role in investment for the economic growth and development of the country.
Need to develop infrastructures such as transportation sectors (road and highway, port development, bridge), Energy sectors (electricity, gas, and biofuel), industries, and service sectors (one-stop service) which attract the foreign investor to invest in Bangladesh. Structured financing will require three key stakeholders: the private sector, the public sector, and international development partners. The emphasis should be on encouraging both public-private partnerships, both national and international, and ensuring that the appropriate economic and monetary incentives are created for all parties to remain committed and engaged.
Poverty reduction and formation of pro-poor policies
The government must make significant efforts to develop and implement growth strategies. The strategies should identically cover
- Assisting non-government organizations (NGOs), microfinance institutions, and non-profit organizations (NPO) to alleviate poverty.
- Export and import strategy for agricultural and agro-based industrial products so that farmers could earn more.
- To make attention to labor mobility from unemployed, underemployed, and informal sector workers move to a more productive sector and formal sector.
- To make urbanization. Every village makes an urban because urbanization is the key driving force in the future. If Bangladesh is to raise the overall level of productivity and incomes, productivity in the agriculture sector will need to be increased, and there will require to move the labor force from the agriculture sector to the service and industrial sectors and also establish the technology advance agriculture and agro-based industries.
- To give attention to the competitive international labor market for remittance earnings, to generate skilled, technology-based (graphics design, ICT, software development, machine learning) and market-oriented labor force and migrate overseas to harness remittance. The embassy of Bangladesh abroad should take the strategic initiative to negotiate and create a favorable labor market for reaping remittance for long-term benefit.
Providing need base ICT platform
The information & communication technology (ICT) sector is relatively a young and emerging sector in Bangladesh. The challenge for the policymakers is to bridge the gap between the education system and the job market. The government should prioritize upgrading the education system at each level immediately, attract national and international investors efficiently and establish good governance in all sectors.
Skill development and vocational training for migrant workforce
Future migrants will benefit from skill development and vocational training in order to obtain better and higher-paying jobs abroad, resulting in higher volumes of remittances. Remittances have increased dramatically in recent years. Remittance has played a vital role in boosting foreign exchange reserves. According to the Bangladesh Bank monthly report, Bangladesh received a record $ 43.16 billion in remittances in December 2020. It reaches $ 45.10 billion on 4 May 2021, and its remittances are expected to reach $ 50.0 billion by the end of 2021. Every year, approximately 2.0 million labor forces enter the labor market. A significant portion of these workers migrates to other countries around the world. According to a World Bank report, Bangladeshi migrant workers who speak little English, have poor primary formal education, and few vocational industries–specific skills often face severe job insecurity. The lack of knowledge and inability to communicate in a foreign language other than English is a barrier. As a result, Bangladeshi workforces are at a disadvantage for new job opportunities, particularly in our tech-driven world. Bangladeshi migrant workers earn two times less than Indian workers and three times less than Sri Lankan workers for the same work simply because of their skill level. Bangladeshis working abroad were hardly educated and skilled. As a result, their wages are very low, and they are exploited.
Integration between Government, Academia, and industry
In Bangladesh, there is a lack of integration between the Government, academia, and industry. The three Es are education, employability, and employment, which must be addressed.
Flexibility in labor Market and product Market labor
Bangladesh has cheap labor and a flexible labor market. The labor market in Bangladesh is indeed more flexible than the labor market in India. Relaxation of labor regulations may result in increased employment. More firms can enter the organized sector because of increased output and profitability, increased competition, and lower prices of formal goods. This facilitates improving the competitiveness of the economy, which leads to an increase in exports. A softening of product market regulations will boost investment and output, but it will take a lot of softening for Bangladesh to surpass its stagnant GDP.
Providing rural affluence in Agriculture and agro-based industries
Bangladesh has faced some challenges every year, including loss of cultivable land, loss of crop productivity, inadequate management practices of fertilizer, water, and pest management climate changes, access to advanced technology, waste management, quality seed production, lack of markets, mismanagement of agriculture credit, low purchasing power and insufficient investment in agriculture research which is required to addressed immediately for attaining Demographic Dividend.
Participation of women in economic, social, and political activities
According to a recent World Bank report, Bangladesh is expected to contribute 1.8 percentage points to GDP growth each year as the number of women entering the labor force continues to rise. This will facilitate the country in achieving the middle-income level by 2021. According to the World Bank Group’s women, Business and the law report in 2016, the female labor force participation rate would be increased from 34 percent to 82 percent over the next decade. However, women faced gender-based service restrictions in Bangladesh.
Promotion of Good Governance
The successful and effective implementation of good governance fosters a “development dividend.” Administrative changes and decentralization, root out the red tape of Bureaucracy, transparency in each department, anti-corruption strategies, strategic assistance with multilateral national and international organizations, and the EU are some of the matters that the government must consider carefully in order to achieve demographic dividend.
Implementation of the Rule of Law
In a democratic society, the rule of law is closely associated with poverty reduction, human capital development, women’s empowerment in rendering gender inequality, decentralization, and economic development that are the essential components of good governance and long-term peacebuilding.
POLICY RECOMMENDATIONS
To realize demographic dividends in Bangladesh, favorable policies are required. The demographic dividends are not automatic. Bangladesh will require an educated, healthy, and productive workforce in order to reap the benefits. These are partly dependent on the government’s policies to build human capital, foster investment, and encourage savings. The necessary policy recommendations can be summarized as follows:
- Our neighboring country, like India, established a separate Ministry of Human Resources Management (MHRM) and was able to assess the human resources requirement for existing and potential industrial sectors. The Ministry of Human Resources also informed the Ministry of Education about the requirement. To established Ministry of Human Resources Management (MHRM) and inter-linkage among the Ministries such as Ministry of Public Administration (MOPA), Ministry of Labor and expatriate (MoLE), Ministry of Foreign Affairs (MOFA), Ministry of Finance (MoF), Ministry of Education (MoE), Ministry of Youth and Sports (MYS), and Ministry of Home Affairs (MoHA) will be made in one cluster.
- It demonstrates that the current system’s educational quality does not meet the needs of the current job market. The government should take the lead in ensuring quality education by upgrading the curriculum at all levels and the Ministry of Human Resources Management (HHRM) to create a database for assessing industry needs and the number of students graduating each year. This ministry would also assist in bridging the gap between educational institutions and the industry/job market. The government should also prioritize the immediate improvement of the education system at all levels, the efficient attraction of local/foreign investors, and good governance in all sectors. And, of course, the country’s economy will continue to grow, and our youths will become more educated.
- The Ministry of Human Resources Management will set an export target for skilled human resources for the fiscal year. Under the supervision of MHRM, the respective embassy/high commission will assess the need for skilled labor in their respective jurisdictions. They will meet with their foreign counterparts (on a G 2 G basis) to determine the demand for skilled and unskilled labor forces in agriculture, medicine, technology, nursing, and other sectors. They will expect them to be familiar with the profession’s sector-specific qualifications, skills, and professional knowledge. If their demand does not match the existing standard of our national educational curricular, they will seek their required curricular for the specific profession and will present it to the Ministry of Education for redesigning the curriculum and educating or training them within a specified time frame with a tailor-made program to best suit their demand.
- The Ministry of Home Affairs will arrange for quick passport delivery for young people (aged 18-30 years) from the outlet of the provost office of University Hall, Principal of a College, Head Master of a High School, or even Manager of a local bank, or a local nearby Post office to receive passport application, process, and deliver to the student within 15 days from the application. Otherwise, if the passport office decides to handle this massive arrangement independently, it may take much longer to obtain a passport. By this point, the train of opportunity to find foreign employment may have passed. The validity period for this type of passport would be ten years.
- Any other passport-related work, such as an extension of time, a valid application for information or data changes in the passport that may be required with the passage of time, or any corrections, should be allowed to apply from abroad online and must be completed and made available to the applicant within three working days.
- The Ministry of Education will need to sign a Memorandum of Understanding (MoU) with the British Council, or IELTS, TOEFL, GRE, or Pearson’s English testing centers or conducting authority in Bangladesh to arrange so that any Bangladeshi student who wishes to appear at their test examination centers, should be allowed to sit for the exam without paying any fees or charges. The MoE will reimburse costs or fees after receiving a quarterly bill from those institutions conducting exams for student enrollment in universities outside of Bangladesh. To enable Bangladesh to contest in the international labor market, the government should prioritize global standard education.
- Each year, the Ministry of Human Resources Management, Ministry of Labor, and Ministry of Expatriate Welfare should be given a target for exporting Human Resources such as agricultural labor, construction labor, cleaning, gardening, and homework on a G2G basis. Again, they can look into agricultural work on a cost-sharing basis or through PPPs with various foreign countries.
- The Ministry of Public Administration and the Ministry in charge of managing private sector employments must issue a circular stating that any Bangladeshi employee working in public or private sectors in Bangladesh is entitled to and allowed to obtain a two-year experience certificate from their supervisors or employers after submitting their application. Because it is an important document for a skill migration application, because Bangladesh does not issue any instructions to their employers or supervisors, they seem reluctant to issue experience certificates in their names.
- Financial inclusion of young people must be ensured; even if there is no balance in their account, every student deserves the opportunity to open an account with their preferred bank branch. This account number is necessary for them to obtain employment in other countries on occasion. When they return to the foreign labor market, they can quickly remit their earnings through this bank account.
- For labor to be exported, the Bangladesh government should be expanded to create more flexibility and adapt to market demands of vocational education and training (VET) activities and the pre-departure orientation (PDO) program on technology and foreign language.
- The government should implement an export strategy for agricultural products, capital goods, and raw materials to receive incentives to create additional jobs in the country.
- To reap the demographic dividend, policies should go beyond anti-poverty initiatives and focus on childcare, transportation, and removing legal barriers to women’s employment. The government’s awareness campaign should increase women’s autonomy and decision-making power.
- The government must develop a proper strategy for agro-industrial linkages, increasing crop productivity, increasing access to agro-industries, providing agricultural credit, having entrance to advanced technology, developing wastelands, and developing biomass power and biofuels, which can lead to abundant opportunities and long-term job creation both at home and abroad.
- Administrative changes and decentralization, transparency in each department, anti-corruption strategies, and strategic assistance to multilateral organizations are some of the issues the Government must carefully consider to achieve the demographic dividend. We didn’t do anything like that. Our mindset would have changed if we had consistently reshaped traditional bureaucracy, valued meritocracy in jobs, and technologically developed an educational system based on the demand of industries.
- We need to immediately bridge the gap between the education system and the job market. At present, the unemployment rate of Bangladesh 4.5 percent, and the youth unemployment rate is about 11 percent. The graduate unemployment rate is 47 percent. Ours have millions of graduates enter in job market every year. Each year about more than two million young enter the job market. The education system must be reorganized and improved to meet the demands of high-quality/highly skilled employment, industry, investment, and trade, ensuring that the future working-age population is prepared for innovations and development. Educational institutions should take initiatives such as structured teaching and training workshops through a memorandum of understanding with companies and businesses so that students can improve their practical knowledge and be prepared for the job market after graduation. Indeed, the government’s lack of a placement policy and poor skill development initiatives result in joblessness, pushing the youth into a state of desperation. In addition, a lack of skill-based education and the availability of irrelevant degrees that do not match the needs of the job market contribute to their anxiety. More attention needs to be paid at all education levels to improve critical reasoning thinking and problem-solving skills or approaches.
- In order to capitalize the demographic dividend, proactive dynamic comparative advantage, systematic human resource management practices in the public and private sectors should be developed. Decent work is at the heart of a dynamic and sustainable development system. As a result, encouraging decent jobs will boost the employability of the working-age population. Furthermore, a decent work culture for the working-age population should be implemented, which will strengthen rural communities. Last but not least, the government, employers, educational institutions, and training associations can implement the proposed comprehensive and integrated framework in this paper, which involves using the demographic dividend to reduce unemployment and create job opportunities, thereby facilitating sustainable development.
- The government can intervene to realize the country’s ongoing demographic dividend by increasing the rate of productivity growth. The rate of productivity growth will be achieved by investing in human capital. A human capital formation can be encouraged by the government through educational policies, worker training, and health programs. Another type of human capital is an entrepreneurial skill, which the government could help improve by removing barriers such as red tape. Encouraging research and development will also result in a higher rate of productivity growth.
- To need a plan critically manage the upcoming aging population. The health pension system needs to be introduced immediately in Bangladesh like Japan and other developed countries. Social protection for the old or retired personnel is practically inoperative in most cases except those of the government, public sector bodies, or a few private corporate houses. There is a strong need for funding pension and other retirement funds, involving insurance companies in Bangladesh for government, public, and private sector agencies.
- Advocating policies that may favor women’s entry into the labor force will result in significant strides toward achieving demographic dividend; thus, the government is expected to increase spending on education, including technical and vocational training, so that females can sustain in the long run of a skill-driven economy.
- To encourage savings, the government can raise the real interest rate, though savings to changes in the real interest rate appear to be small. To encourage savings, the government can offer tax incentives, but as previously stated, savings to changes in tax incentives is also very low. One of the most crucial aspects of saving is that it should not come solely from individuals. To raise long-term living standards that will boost the demographic dividend, government savings should also be increased.
- To ensure the maximum utilization of the youth, capital investment in infrastructure, improved technology, manufacturing plant, market liberalization, etc., are essential.
- The creation of young entrepreneurs can be an important route to the youth employment generation. Emerging young entrepreneurs can act as a stimulus for economic growth, and this strategy is receiving attention worldwide.
- ICT sectors such as software development, freelancing, web development, AI and Machine learning, garments sector, trust sectors, and other informal sectors need to be addressed to emphasize job creation. The harnessing of remittance should be given the top priority and arranging the migration policy with respective countries in favor of Bangladesh to send more labor force than other counterpart counties.
- Law and order, good governance, rule of law, accountability commitment to dedicate for country welfare and fairness in the effective implementation should be given the top priority of the government of Bangladesh.
The government should immediately consider the above recommendations on a short-term and long-term basis, ensuring sustainable development and fulfilling the visions and missions to reach a developed country within 2041—the existing demographic window of opportunity.
The study conducted here certainly does not sufficiently address all the demographical and economic indicators of Bangladesh related to the demographic dividend, the demographic transition, population momentum, life cycle consumption theory, labor force participation, and unemployment conditions. Secondly, the data of Bangladesh is not available for demographic and economic behavior studies according to the division or district wise. For panel data analysis and cross-sectional analysis, data availability was not sufficient in Bangladesh’s perspective. Bangladesh’s year-wise demographic and economic data for long-term basis were insufficient for statistical analysis, especially education, health, savings, and investment-related data. However, the study has conducted time-series data analysis of a small number of observations and to get the best result about the impact of demographic dividend on economic growth in Bangladesh.
Suggestions for further research
Further study should be needed using panel data analysis and cross-section data analysis. The demographers, economists, academicians, social scientists, and other researchers interested in giving attention to the demographic relationship with economic growth are necessary to focus on estimating the impact of demographic dividend on economic growth in the broad future sense. Besides, the study has constructed specific decomposition analysis model and regression analysis model for calculating demographic dividend which can be used for further research in the field of demographic dividend to estimate more accurately and efficiently by the researchers, academicians, or students.
CONCLUSION
Bangladesh has already reaped the demographic dividends on economic growth which is 4.47 percent in regression analysis and approximately 23 percent in decomposition-based analysis. It is significantly positive correlation with demographic variables. There have some challenges for Bangladesh which is immediately mitigated by Government and other stakeholders. Bangladesh can realize the full potential of its demographic window of opportunity by enacting short-term and long-term basis decisive policies to expand labor markets by ensuring the participation of the young working-age cohort in the labor force, investing in youth and skill development, improving health services, and creating mass employment, particularly in the rural and formal sectors. Furthermore, if we cannot reduce the gender gap in education, employment, skills, and labor markets, we will miss out on reaping the benefits of our demographic. Economists optimistically demand this potential for accelerated economic growth as the ‘demographic dividend’. Bangladesh is expected to increase an average 1 percent additional yearly GDP just because of this growing working-age population—yet realizing that potential has been one of the country’s significant challenges until the early 2040s. The demographic dividend is not automatic. It can only be attained if the appropriate human resource policies are pursued. The dividend appears as an additional growth that could be expected from capital investment in infrastructure, improved technology, manufacturing plants, or by trade policy, market liberalization, and so on. If the benefits of the first demographic Dividend are realized, per capita income will rise. As more people become economically active, the savings rate will increase, and the country’s GDP will reach double digits in the shortest time possible.
REFERENCES
- Ahmad, M., & Khan, R. E. A. (2018). Age-structure, human capital and economic growth in developing countries: a disaggregated analysis. Pakistan Journal of Commerce and Social Sciences (PJCSS), 12(1), 229-252.
- Ahmad, M., & Khan, R. E. A. (2019). Does demographic transition with human capital dynamics matter for economic growth? A dynamic panel data approach to GMM. Social Indicators Research, 142(2), 753-772.
- Ahmed, S. A. & Alam, O. (2016). Demographic Dividend in Bangladesh: Opportunities and Challenges. Asian Journal of Multidisciplinary studies, 4(4),108-113.
- Aiyar, S., & Mody, A. (2011). The Demographic Dividend: Evidence from the Indian state. IMF Working Paper, no.11/38. New York: International Monetary Fund. www.imf.org/ecternal/pubs/ft/wp/2011/wp1138.pdf
- Andersson, B. (2001). Scandinavian Evidence on Growth and Age Structure. Regional Studies, 35 (5), 377-390. https://doi.org/10.1080/713693829
- Bangladesh Bureau of Statistics (BBS). (2019). Statistical year book of Bangladesh 2019. Dhaka: Bangladesh Bureau of Statistics.
- Barro, R., & Sala-I-Martin, X. (1995). Economic growth. New York, NY: McGraw-Hill.
- Bloom, D. E. (2011). Population dynamics in India and Implications for economic growth. PGDA Working Paper 65, Harvard School of Public Health, Harvard University, Boston, MA.
- Bloom, D.E., & Freeman, R.B. (1986). The effects of rapid population growth on Labor Supply and Employment in developing Countries. Population and Development Review, 12(3), 81-414.
- Bloom, D.E., & Saches, J. (1998). Geography, Demography and Economic Growth in Africa. Economic Acitivity,2, 207-273. https://dx.doi.org/10.2307/2534695.
- Bloom, D. E., & Williamson, J. G. (1998). Demographic Transitions and Economic Miracles in Emerging Asia. The World Bank Economic Review, 12(3), 419-455 https://doi.org/10.1093/wber/12.3.419
- Bloom, D. E., Canning, D., & Malaney, P. (1999). Demographic change and economic growth in Asia. CID Working Paper No.15, Harvard University.
- Bloom, D. E., & Canning, D. (2001). Cumulative Causality, Economic Growth, and the Demographic Transition. In Birdsall, N., Kelley, C.A., and Sinding, S. (eds. 2003). Population Matters: Demographic Change, Economic Growth, and poverty in the Developing World. Oxford University Press.
- https://oxford.universitypressscholarship.com/view/10.1093/0199244073.001.0001/acprof-9780199244072
- Bloom, D. E., & Canning, D. (2004). Global demographic change: Dimensions and economic significance. National Bureau of Economic Research (NBER), Cambridge. Working Paper No. 10817.
- Bloom, D. E., Canning, D., & Malaney, P. (2000). Demographic change and economic growth in Asia. Population and Development Review, 26, 257-290
- Bloom, D.E., Canning, D., & Sevilla, J. (2001). Economic growth and Demographic Transitions. NBER working paper No.8685. https://doi.org/10.3386/w8685
- Bloom, D.E., Canning, D., & Sevilla, J. (2003). The Demographic Dividend: A New Perspective on the Economic Consequences of Population Change. Population Matters Monograph MR-1274. Santa Monica, RAND.
- Bloom, D.E., Canning, D., Fink, G., & Finlay, J. E. (2009). Fertility, Female labor force participation and demographic dividend. Journal of Economic growth, 14(2), 79-101.
- Chauhan, S., & Arokiasamy, P. (2018, August 24). India’s demographic dividend: state-wise perspective. Journal of Social and Economic Development,20,1-23, https://doi.org/10.1007/s40847-018-0061-7
- Coale, A. J., & Hoover, E. (1958). Population and economic development in low-income countries. Princeton: Princeton University Press.
- Commission, N. P. (2017). Demographic changes of Nepal. Trends and Policy Implications.
- Economist Intelligence Unit. (2013). Skills development in South Asia: Trends in Afghanistan, Bangladesh, India, Nepal, Pakistan and Sri Lanka. A custom research report for British Council by The Economist Intelligence Unit, London, UK. www.eiu.com
- Gribble, J. N., & Bremner, J. (2012). Achieving a demographic dividend. Population Bulletin,67(2),1-14.https://www.pbr.org/pdf12/achievingdemographicdividend.pdf
- Islam, M. M. (2016, May 28). Demographic transition and the emerging windows of opportunities and challenges in Bangladesh. Journal of Population Research, 33, 283–305.
- Joe, W., Kumar, A., & Rajpal, S. (2018, April 3). Swimming against the tide: economic growth and demographic dividend in India. Asian Population Studies, 14(2), 211-227. https://doi.org/10.1080/17441730.2018.1446379
- Kazbekova, Z. G. (2018, December 28). Impact of demographic dividend on economic growth. Populations and Economics, 2(4),85-135. https://doi.org/10.3897/popecon. 2.e36061
- Kelley, A., Schmidt, R. (1996). Saving, dependency, and development. Journal of Population Economics, 9(4), 365-386.
- Lee, R. (1980). Age Structure Intergenerational Transfer and Economic Growth. An Overview. Sciences Po University Press, Vol.31, No. 6, pp.1129-1156. https://dx.doi.org/10.2307/3501185.
- Lee, R., Mason, A., & Miller, T. (2000). Life Cycle saving and the Demographic Transition in East Asia. Population and Development Review 26 (Suppliments).
- Lindh, T., & Malmberg, B. (1999). Age Structure Effects and Growth in the OECD, 1950-1990. Journal of Population Economics, 12(3), 431-449. https://doi.org/ 10.1007/s001480050107
- Malthus, T. (1798). An essay on the principal of population. London: J. Johnson.
- Manson, A. (1998). Savings, Economic Growth, and Demographic Change. Population and Development Review, 14(1), 113-144. https://doi.org/10.1080/713693829
- Mason, A. (2001). Population change and economic development in East Asia: Challenges met, opportunities seized. California: Stanford University.
- Mason, A. (2003). Population change and economic development: what have we learned from the East Asia experience? Applied Population and Policy, 1(1), 3-14.
- Mason, A. (2005). Demographic transition and demographic dividends in developed and developing countries. United Nations expert group meeting on social and economic implications of changing population age structures. Mexico City, 81-101.
- Mason, A. (2007). Demographic dividends: The past, the present, and the future. Population change, labor markets and sustainable growth: Towards a new economic paradigm. Emerald Group
- Matin, K. A. (2012). The Demographic Dividend in Bangladesh: An Illustrative Study. 18th Biennial Conference of the Bangladesh Economic Association, Dhaka, Bangladesh.
- Misra, R. (2017). Impact of Demographic Dividend on Economic Growth: A Study of BRICS and the EU. International Studies, 52(1–4), 99–117. https://doi.org/10.1177/0020881717714685
- Navaneetham, K. (2002). Age Structural Transitions and Economic Growth. Evidence from South and Southeast Asia. Working Paper No.337, Centre for Development Studies. https://dx.doi.org/10.2139/ssrn.1629784.
- Navaneetham, K. & Dharmalingam, A. (2009). Age Structural Transitions, Demographic Dividend and Millennium Development Goals in South Asia: Opportunities and Challenges. Morocco: International Population Conference. Session,128. https://doi.org/10.13140/2.1.3112.0640
- Sarker, S., Khan, A., & Mahmood R. (2016). Working Age Paper & Economic Growth in Bangladesh: A Time-Series Approach. 1st AISD International Multidisciplinary Conference,120-135. https://doi.org/10.13140/RG.2.1.5098.9682
- Sokolova, T. V. (2010). Application of the growth accounting method in the estimation of economic growth factors: advantages and drawbacks. Siberian financial School, 2, 27-31. (In Russian)
- Solow, R. M. (1956). A Contribution to the Theory of Economic Growth. Quarterly Journal of Economics, Vol. 70, No.1, pp.65-94.
- United Nations. (2019). World population prospects: The 2019 revision. Department of Economic and Social Affairs, Population Division. New York: United Nations.
- World Bank. (2020). World Development Indicators 2020. Country: Bangladesh [bgd_Country_en_excel_v2]. https://data.worldbank.org /country/bangladesh
- World Bank. (2011). Becoming old in an older Brazil: Implications of population aging on growth, poverty, public finance and service delivery. Conference Edition., Washington, DC: Author.
- ———. (2015). Africa’s demographic transition: Dividend or disaster. https://elibrary.worldbank.org/doi/abs/10.1596/978-1-4648-0489-2_ov
- ———. (2017). China’s overview. https://www.worldbank.org/en/country/ china/overview