
Impact of Perceived Usefulness on ICT Adoption by SMEs Bread Baking Industry in Zamfara State
- HASSAN, Abdul Sabur
- Ikebuaso Benson
- 149-159
- May 30, 2024
- Business Management
Impact of Perceived Usefulness on ICT Adoption by SMEs Bread Baking Industry in Zamfara State
1HASSAN, Abdul Sabur & 2Ikebuaso Benson
1Department of Business Administration, Federal polytechnic, Kaura Namoda, Zamfara state.
2Department of marketing, Federal polytechnic, Kaura Namoda, Zamfara state.
DOI: https://doi.org/10.51244/IJRSI.2024.1105008
Received: 11 April 2024; Revised: 25 April 2024; Accepted: 29 April 2024; Published: 30 May 2024
ABSTRACT
The study explore the relationship between perceived usefulness on ICT adoption of SMEs bakery firms in Zamfara State. The objective is to assess the impact of perceived usefulness on ICT adoption by SMEs bread baking industry. The study was anchored on Technology Acceptance Model (TAM) theory. The study used a quantitative and survey research design. The dependent variable is SMEs ICT adoption while the independent variable is Perceived Usefulness (improved job performance, Enhanced job effectiveness and Enhanced productivity). This study used a saturated sample, from 95 questionnaires collected, the data obtained were then analyzed using SEM (Structural Equation Modeling) PLS-4. The results showed that there is a significant positive relationship between SMEs ICT adoption and enhancement of job effectiveness in bread baking industry in Zamfara state. Equally there is a significant positive relationship between SMEs ICT adoption and enhanced firm Productivity of bread baking industry in Zamfara state. Further more the findings shows that there is a significant positive relationship between SMEs ICT adoption and Improved Performance of bread baking industry in Zamfara state. Therefore the study concludes that technology utilization promotes job effectiveness, firm Productivity and Improved Performance in the business and these can enhanced competitive advantage in the market. The study recommends that bread baking industry should key into the ICT adoption behavior, firms that are yet to adopt modern technology in their production processes should do so. And bread baking firms that have adopted this modern technology should ensure periodic up-grade and review their level of utilization in meeting market demand.
Keywords: ICT adoption, job effectiveness, Enhanced productivity, Improved Performance, and SMEs.
BACKGROUND
Information and Communication Technology (ICT) plays a crucial role in enhancing the efficiency and competitiveness of Small and Medium-sized Enterprises (SMEs) across various industries. In the context of the baking industry, adopting ICT can lead to improved operational processes, better decision-making, and increased overall productivity.
Technology and innovation have drastically changed the bread baking industry. New production techniques, e-commerce, and product development have shaped the current operations of firms in the industry. Small-scale production units have been created to perform the same function as large-scale units. This makes bread baking industry more attractive and competitive with many players using automated system. Although this reduces labor costs for small firms, it also has led to decreased employment. In addition, e-commerce and manufacturing technology is a major development in the bread baking industry.
Computerization of process increases efficiency and accuracy. For example, with the introduction of conveyors, collators, and automated packers, the packaging process has greatly improved. Also, new systems are used to track inventory, production, and shipments. These implementations strengthen customer’s confidence in the relationship between customer and supplier. They also help producers accurately gauge the demand of consumers in the market. Product innovation has become increasingly important in the industry. Producers must create new products that appeal to the changing consumer preferences. These new technologies, systems, and innovations have contributed to the baking industry immensely. The success of ICT adoption in SMEs bread baking industry is often influenced by the perceived usefulness of these technologies by the individuals and decision makers within the industry in Zamfara state.
Problem Statement
Widayanto and Nugraha, (2023). argues that the pursuit of efficiency has spurred the integration of technology into business operations, prompting considerations on various factors such as cost-benefit analysis, technological complexity, required operational skills, sustainability, and organizational size. These factors have led organizations to implicitly decide on enhancing productivity through technology adoption. In Zamfara state, bakery firms are facing challenges with employees’ resistance to using modern technologies effectively, particularly in flour mixing and blending where manual methods are preferred over machines. This underutilization of modern technology undermines bread processing efficiency, potentially leading to decreased production time. Researchers like Albert (2014), Hiti (2015) and (Agbon, 2015) suggested that the reluctance to adopt modern technologies can result in negative outcomes such as reduced productivity, work quality, performance, and commitment. Achieving organizational objectives in Zamfara’s bakery industry seems unlikely without embracing modern technologies. The perceived decline in bread quality in Zamfara may be driving customers to seek alternatives from other regions like Kaduna, Sokoto, katsina etc. Based on the affirmation, it is imperative to analyze the impact of perceived usefulness of ICT adoption behaviors of SMEs in the bread baking industry. The researcher proxy perceived usefulness with improved job performance, enhanced job effectiveness and enhanced productivity.
Specific Objectives
The general objective is to assess the impact of perceived usefulness on ICT adoption by SMEs bread baking industry
- To assess improved job performance on SMEs ICT adoption in bread bakingindustry.
- To analyze enhanced job effectiveness on SMEs ICT adoption in bread baking industry.
- To assess enhanced productivity on SMEs ICT adoption in bread baking industry.
Hypotheses
H1: There is an improved job performance on SMEs ICT adoption in bread baking industry
H2: There is enhanced job effectiveness on SMEs ICT adoption in bread baking industry
H3: There is enhanced productivity on SMEs ICT adoption in bread baking industry.
Theoretical frame work
The Technology Acceptance Model (TAM) is a theory used to explain the fundamental aspect of this research work, TAM was developed to explain user acceptance and adoption of new technologies. The Technology Acceptance Model (TAM) is indeed adapted from the Theory of Reasoned Action (TRA). Both models were developed by psychologists to understand and predict human behavior, especially in the context of technology adoption. TRA was developed by Martin Fishbein and Icek Ajzen in the late 1960s, and it posits that an individual’s behavior is determined by their intention to perform that behavior, and this intention is influenced by two main factors: their attitude toward the behavior and subjective norms. TAM simplifies TRA by focusing on two key factors that influence user acceptance of technology: perceived usefulness (PU) and perceived ease of use (PEOU).TAM, originally proposed by Fred Davis in the late 1980s, has been widely used to study and explain user acceptance of various technologies.
Going by the competitive challenges in the bread baking industry in the state, managers are curious about any innovative strategy that is out to add value to their system. The term Perceived Usefulness as defined by Kashada& Koshadah (2018) as: “The degree to which a person believes that using a particular system would enhance his or her jobperformance”. This can be interpreted as a person’s level of trust that using a particular system can improve the performance of his work. From this definition, it is deducted that the use of perception is a belief about the decision making process. In the TAM model, Perceived Usefulness is used to measure how much decision makers feels that technology can be useful for their organization.
Perceived usefulness
Perceived usefulness is defined as the extent to which a person believes that using a system will improve their performance. Durodolu, (2016) defined Perceived usefulness as the perception of an individual that his performance will be improved with the use of new technology. In Raed and Kuldeep (2017) Perceived usefulness is the degree by which job performance is assumed by an individual to get enhanced with the use of a specific system. Lee & Lim (2019)asserted that the Perceived usefulness plays the role of a key factor in determining adaptation of new technology. Thus, previous studies highlighted that a technology is perceived useful by user if he or she believes that use of technology will lead to upgrade the performance. This is a development of the definition of “useful” itself, which is “the ability to be used for profitably”. There are four indicators that can be used to measure perceived usefulness: Improves job performance, Increases productivity, Enhance job effectiveness and Useful (Widayanto and Nugraha, 2023).
Improved job performance
Improved job performance and the adoption of Information and Communication Technology (ICT) are closely interconnected in today’s rapidly evolving work environment. The integration of technology into various aspects of business operations has the potential to enhance job performance in several ways. Improved job performance through technology adoption is a multifaceted process that involves leveraging technology to enhance efficiency, communication, access to information, skill development, performance monitoring, and overall workplace dynamics. Organizations that effectively integrate ICT into their operations are likely to experience increased productivity, employee satisfaction, and competitiveness in the evolving business landscape (Onobrakpeya, Nana & Odu, 2018).
Enhanced job effectiveness and ICT adoption
The adoption of ICT in the workplace can have a transformative impact on job effectiveness by improving efficiency, communication, collaboration, decision-making, and overall work processes. As organizations leverage technology to its full potential, employees can perform their tasks more effectively, contributing to the success and competitiveness of the business (Yuliana & Syarwani, 2022). The relationship between enhanced job effectiveness and Information and Communication Technology (ICT) adoption is symbiotic, as the integration of technology into the workplace can significantly contribute to improving overall job performance and efficiency (Andy, Dewi & As’adi, 2021). The trip of this study is the believe that ICT plays indispensable roles in enhancing effectiveness of staff ability in producing the desired result in the discharge of their duties when carefully and effectively harnessed in the bread baking industry.
Enhanced productivity and ICT adoption
The impact of ICT on the development of productivity has been the subject of much debate in the literature. The adoption of Information and Communication Technology (ICT) can significantly contribute to enhanced productivity in various ways (Sindarta, Santoso & Pengaruh, 2022). The adoption of ICT especially in the bread baking industry results in enhanced productivity by automating tasks, streamlining workflows, enabling real-time collaboration, supporting remote work, providing quick access to information, and promoting data-driven decision-making. Organizations thatleverage ICT effectively can create a more efficient and dynamic work environment, ultimately contributing to increased productivity and competitiveness.
Bread baking industry
Bread is an important ready-to-eat staple food in many countries. According to Singh et al. (2014), ready-to-eat food (RTE) refers to what could be eaten as purchased, without further processing. Bread is produced in various forms, and sizes and eaten almost everywhere as reported by Emeje et al. (2010). Bread is usually baked in an electric or firewood oven and characterized by its distinct taste, aroma, quality, appearance and texture which account for its appetizing appeal to consumers. (Emeje et al. 2010) reported that bread is made from wheat or cassava flour added with table salt, sugar, flavour, and fruits among other ingredients. Bread is currently an important staple food both in the developed and developing world (Abdel ghafor et al. 2011). In Nigeria, bread is consumed in all geopolitical zones irrespective of socioeconomic and cultural backgrounds and religious affiliations in Nigeria (NAFDAC, 2010).
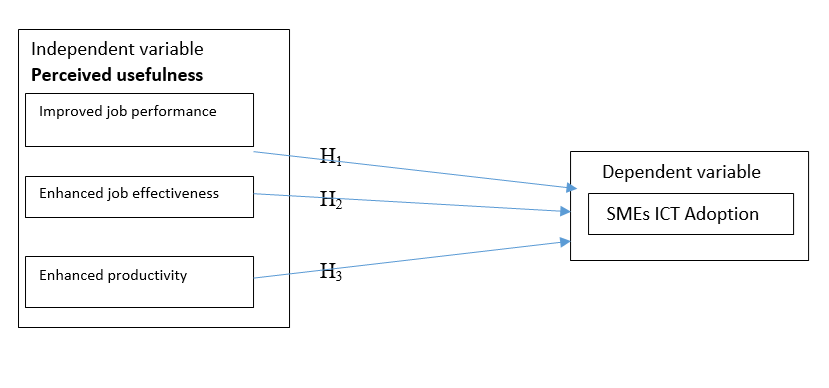
Fig; 1 Source; Author, 2024 Conceptual framework
METHODOLOGY
This research uses quantitative research type by distributing questionnaires with 5 Likert scale to 98 respondents from bread baking industry in Zamfara state. The sampling technique used is non-probability sampling with the sampling method used is purposive sampling. The criteria for respondents are managers and decision making officer, owing bread baking industry that are residing in Zamfara state. Data analysis was carried out using SmartPLS 3. software which includes outer model analysis and inner model analysis. Outer model analysis includes convergent validity, discriminant validity, and reliability tests. Inner model analysis includes r-square, f-square effect size, and hypothesis testing.
Model specification
IA = ICT Adoption
IP= Improved job performance
EE= Enhanced job effectiveness
EP= Enhanced productivity
IA =β0+β1IP+β2EE+β3EP+µ …………………………………………………………………………………………………. ⴖth
RESULTS AND DISCUSSIONS
| Construct Reliability and Validity | ||||
| variables | Cronbach’s Alpha | rho_A | Composite Reliability | Average Variance Extracted (AVE) |
| Enhance Effectiveness | 0.911 | 0.928 | 0.938 | 0.791 |
| Enhance Productivity | 0.847 | 0.857 | 0.898 | 0.691 |
| ICT Adoption | 0.912 | 0.921 | 0.938 | 0.793 |
| Improved Performance | 0.932 | 0.934 | 0.949 | 0.787 |
Construct Reliability and Validity:
Cronbach’s Alpha is a measure of internal consistency. An alpha value above 0.7 is generally considered acceptable, and in this case, the value of 0.911, 0.847, 0.912 and 0.932 respectively indicates high internal consistency for the items measuring Enhance Effectiveness, Enhance Productivity, ICT Adoption and Improved performance
Rho A is another measure of internal consistency. Similar to Cronbach’s Alpha, a value above 0.7 is considered good. Here, 0.928, 0.857, 0.912 and 0.934 respectively indicates a high level of internal consistency for the latent factors.
Composite Reliability is another measure of reliability. A value above 0.7 is acceptable, and the value of 0.938, 0.898, 0.938 and 0.949 respectively, suggests high reliability for the latent factors and imposed more confidence in the instruments.
Average Variance Extracted (AVE) represents the amount of variance captured by the latent factor relative to the measurement error. A value above 0.5 is generally considered acceptable, a value of 0.791, 0.691, 0.793 and 0.787 respectively are above the threshold, indicating that latent factors are adequately measured by their indicators.
The high values for Cronbach’s Alpha, rho A, Composite Reliability, and AVE across all latent factors (Enhance Effectiveness, Enhance Productivity, ICT Adoption, and Improved Performance) suggest that these constructs are reliably and validly measured by their respective indicators. The high internal consistency and reliability, coupled with adequate convergent validity (as indicated by AVE), provide confidence in the quality of research measurement model. And the model appears to have strong construct reliability and validity, indicating that the latent factors are well-measured by their observed indicators.
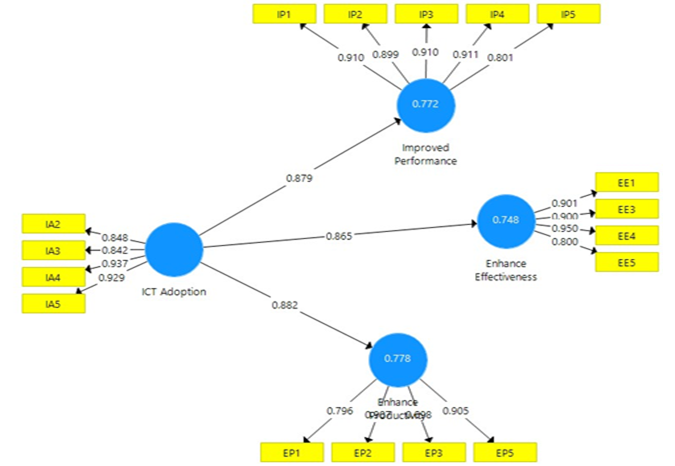
| Enhance Effectiveness | Enhance Productivity | ICT Adoption | Improved Performance | |
| EE1 | 0.901 | |||
| EE3 | 0.900 | |||
| EE4 | 0.950 | |||
| EE5 | 0.800 | |||
| EP1 | 0.796 | |||
| EP2 | 0.907 | |||
| EP3 | 0.698 | |||
| EP5 | 0.905 | |||
| IA2 | 0.848 | |||
| IA3 | 0.842 | |||
| IA4 | 0.937 | |||
| IA5 | 0.929 | |||
| IP1 | 0.910 | |||
| IP2 | 0.899 | |||
| IP3 | 0.910 | |||
| IP4 | 0.911 | |||
| IP5 | 0.801 |
Here, outer loadings represent the strength of the relationship between each observed variable (indicator) and its corresponding latent factor.
Enhance Effectiveness: Outer loading is 0.901. This indicates a strong positive relationship between the latent factor “Enhance Effectiveness” and the observed variable EE1. The indicator contributes significantly to measuring the latent factor. EE3 Outer loading is 0.900 which has a strong positive relationship with the latent factor. EE4: Outer loading is 0.950 and has a very high loading, suggesting it is an excellent indicator for measuring the latent factor. EE5: Outer loading is 0.800. While still relatively high, EE5 has a slightly lower loading compared to the other indicators in Enhance Effectiveness.
Enhance Productivity: Outer loading is 0.796. EP1 has a good positive relationship with the latent factor “Enhance Productivity. EP2 Outer loading is 0.907 and has a very strong positive relationship with the latent factor. EP3 Outer loading is 0.698 with a moderate positive relationship with the latent factor. EP5: Outer loading is 0.905 with a very strong positive relationship with the latent factor
ICT Adoption: IA2 Outer loading is 0.848, this is a strong positive relationship with the latent factor “ICT Adoption. IA3 Outer loading is 0.842, it’s also a strong positive relationship with the latent factor. IA4 Outer loading is 0.937, it has a very high loading, indicating it is an excellent indicator for measuring the latent factor. IA5 Outer loading is 0.929, is a very high loading, suggesting it is an excellent indicator for measuring the latent factor.
Improved Performance: IP1 Outer loading is 0.910, and has a very strong positive relationship with the latent factor “Improved Performance. IP2 Outer loading is 0.899, with a very strong positive relationship with the latent factor. IP3 Outer loading is 0.910, has a very strong positive relationship with the latent factor. IP4 Outer loading is 0.911, has a very high loading, indicating it is an excellent indicator for measuring the latent factor and IP5 with Outer loading is 0.801. with a good positive relationship with the latent factor “Improved Performance.”
The outer loadings suggest that the observed variables are effective indicators for their respective latent factors. High outer loadings indicate strong relationships, implying that the selected indicators are suitable for measuring the underlying constructs of Enhance Effectiveness, Enhance Productivity, ICT Adoption, and Improved Performance in your model.
R Square
| R Square | R Square Adjusted | |
| Enhance Effectiveness | 0.748 | 0.745 |
| Enhance Productivity | 0.778 | 0.776 |
| Improved Performance | 0.772 | 0.770 |
The R Square values provide insights into the amount of variance in the dependent variables (latent factors) explained by the independent variables (indicators or predictors).
Enhance Effectiveness: The R Square value for Enhance Effectiveness is 0.748, indicating that approximately 74.8% of the variance in the latent factor is explained by the observed variables or indicators included in the model. The adjusted R Square, which considers the number of predictors in the model, is 0.745. This adjusted value is slightly lower but is a more conservative estimate of the explained variance.
Enhance Productivity: the R Square is 0.778, suggesting that about 77.8% of the variance in the latent factor is explained by the indicators. The adjusted R Square of 0.776, providing a slightly lower but more conservative estimate.
Improved Performance: The R Square value for Improved Performance is 0.772, meaning that around 77.2% of the variance in the latent factor is explained by the indicators in your model. The adjusted R Square is 0.770, providing a similar but adjusted estimate.
The R Square values for all three latent factors (Enhance Effectiveness, Enhance Productivity, Improved Performance) are relatively high, suggesting that a substantial portion of the variability in these constructs is accounted for by the observed variables in the model. While the adjusted R Square values are close to the R Square values, indicating that the model’s explanatory power is robust even when considering the number of predictors.
R Square values suggest that the specified indicators contribute significantly to explaining the variability in Enhance Effectiveness, Enhance Productivity, and Improved Performance in your structural equation model.
F-squared values
| Enhance Effectiveness | Enhance Productivity | Improved Performance | |
| ICT Adoption | 2.960 | 3.512 | 3.392 |
The f2 (f-squared) values measure the effective size of each predictor variable (indicator) on the latent factors in the model. They represent the proportion of variance in the latent factor that is explained by a specific predictor, accounting for the effect of other predictors.
The f2=2.960, 3.512 and 3.392 values indicated a large effect size. The predictor variable ICT Adoption explains a significant amount of variance in the latent factors, i.e Enhance Effectiveness, Enhance Productivity and Enhance Effectiveness, even after considering the effects of other predictors.
Thef2 values for ICT Adoption on Enhance Effectiveness and Enhance Productivity, as well as Improved Performance, are all large. This indicates that these predictors contribute significantly to the explanation of variance in the corresponding latent factors. A large f2 value generally suggests that the predictor variable is meaningful in explaining the variance in the latent factor, and it is considered a substantial effect size. These findings contribute to understanding the impact of specific variables on the latent factors in your structural equation model.
The provided information pertains to the path coefficients, means, standard deviations, t-values, and p-values for the paths from ICT Adoption to Enhance Effectiveness, Enhance Productivity, and Improved Performance in your structural equation model.
Path Coefficients
| Original Sample (O) | Sample Mean (M) | Standard Deviation (STDEV) | T Statistics (|O/STDEV|) | P Values | |
| ICT Adoption -> Enhance Effectiveness | 0.865 | 0.866 | 0.029 | 29.904 | 0.010 |
| ICT Adoption -> Enhance Productivity | 00.882 | 0.883 | 0.023 | 38.583 | 0.030 |
| ICT Adoption -> Improved Performance | 0.879 | 0.879 | 0.030 | 28.995 | 0.011 |
Path coefficients represent the strength and direction of the relationships between the predictor variable (ICT Adoption) and the outcome variables (Enhance Effectiveness, Enhance Productivity, Improved Performance). They indicate the extent to which changes in ICT Adoption are associated with changes in the respective outcomes.
ICT Adoption -> Enhance Effectiveness shows the high value of Original Sample (O) as 0.865, indicating a stronger relationship between the variables. Sample Mean (M) of 0.866 is higher than original sample value, this suggests that the sample mean is a representative measure of the observed data. Standard Deviation (STDEV) measure the spread or dispersion of the observed path coefficients around the mean. In this case, STDEV is 0.029 and a lower standard deviations suggest less variability of the data. T Statistics (|O/STDEV|) showing a high value of 29.904, indicating that the difference between the sample mean and the population mean is significant.
However, the high T statistics and low p-value suggest that there is a significant relationship between improved job performance and SMEs ICT adoption in bread baking industry
ICT Adoption -> Enhance Productivity shows the high value of Original Sample (O) as 0.882, indicating a stronger relationship between the variables, Sample Mean (M) of 0.883, is higher than original sample value, this suggests that the sample mean is a representative measure of the observed data. Standard Deviation (STDEV) measure the spread or dispersion of the observed path coefficients around the mean, the STDEV value is 0.023, suggesting a lower variability of the data. T Statistics (|O/STDEV|) showing a high value of 38.583, indicating that the difference between the sample mean and the population mean is significant.
However, the high T statistics and low p-value suggest that there is a significant relationship between enhanced job effectiveness and SMEs ICT adoption in bread baking industry.
ICT Adoption -> Improved Performance shows the high value of Original Sample (O) as 0.879, indicating a stronger relationship between the variables, Sample Mean (M) of 0.879, is similar to the original sample value, this suggests that the sample mean is a representative measure of the observed data. Standard Deviation (STDEV) measure the spread or dispersion of the observed path coefficients around the mean, the STDEV value is 0.030, suggesting a lower variability of the data. T Statistics (|O/STDEV|) showing a high value of 28.995, indicating that the difference between the sample mean and the population mean is significant.
However, the high T statistics and low p-value suggest that there is a significant relationship between enhanced productivity and SMEs ICT adoption in bread baking industry.Top of Form
The path coefficients from ICT Adoption to Enhance Effectiveness, Enhance Productivity, and Improved Performance are all statistically significant, with high T-values and very low p-values. This suggests that changes in SMEs ICT Adoption significantly influence and predict changes in Enhance Effectiveness, Enhance Productivity, and Improved Performance in your model. The evidence supports the existence of these relationships, providing confidence in the importance of ICT Adoption in predicting the outcomes.
DISCUSSION OF FINDINGS
From the findings, it shows that there is a significant positive relationship between SMEs ICT adoption and enhancement of job effectiveness (T- Value= 29.904, p˂0.010) This suggests that the more an SME increases their level of ICT Adoption, there would be an enhancement in job effectiveness in processing bread within the bakery firms. This result agrees with the findings of Berry (2003) who attested that technology utilization bring about job effectiveness. Therefore, the study concludes that SMEs ICT adoption enhances job effectiveness among bakery firms.
More so, the result from the study concluded that there is a significant positive relationship between SMEs ICT adoption and enhance firm Productivity, (T- Value = 38.583; p˂0.030). This implies that the more an SME increases their level of ICT Adoption., there would be anenhan cement of firm Productivity. This finding is also consistent with the findings of Klein (2013). Which attested that adopting technology by SMEs is replicated with a multiplier effect on firm’s productivity. Hence, the study concludes that SMEs ICT adoption enhances firm Productivity among bakery firms.
Finally, there is a significant positive relationship between SMEs ICT adoption and Improved Performance, with a given value (T- Value= 28.995; p˂0.011). This implies that the more an SME increases their level of ICT Adoption, there would be an Improved Performance on the quality of output of these firms. This affirms with the findings of Ray (2011). Therefore, the study concludes that SMEs ICT adoption Improved Performance With respect to the quality of output of these firms.
CONCLUSION
The study concludes that ICT adoption in bakery firms significantly enhances job effectiveness, productivity, and performance. High T statistics and low p-values indicated a significant relationship between SMEs’ ICT adoption and improved outcomes in the bread baking industry. Therefore, embracing ICT enhances job effectiveness, firm productivity, and overall performance, leading to improved quality of output in bakery firms and Consumer’s satisfaction.
RECOMMENDATIONS
Bread baking industry should focusing on these actionable recommendations.
- Implementing regular training programs to enhance employees’ skills and knowledge related to ICT tools and bakery operations. Provide hands-on training sessions to ensure staff can effectively utilize technology in their roles.
- Invest in ICT solutions such as automated baking equipment and inventory management systems to streamline production processes and minimize manual tasks. Automating repetitive tasks can significantly increase productivity and efficiency.
- Implement quality control measures and utilize ICT tools for real-time monitoring of product quality throughout the production process. Regularly assess product performance against established standards and make necessary adjustments to improve quality.
LIMITATION OF THE STUDY
The study’s findings may be specific to the bread baking industry and may not be applicable to SMEs operating in other industries. Different industries may have varying levels of technological infrastructure, regulatory environments, market dynamics, and consumer behavior, all of which can influence perceptions of usefulness and adoption of ICT.
REFERENCES
- Abdelghafor, R.F., Mustafa, A.I., Ibrahim, A.M. and Krishman, P.G. (2011) Quality of Bread from Composite Flour of Sorghum and Hard Winter Wheat. Advance Journal of Food Science and Technology, 3, 9-15.
- Agboh, D. K. (2015) Drivers and challenges of ICT adoption by SMES in Accra metropolis, Ghana. Journal of Technology Research, Volume 6 – January
- Andy R, Dewi AC, As’adi M. (2021) An Empirical Study to Validate The Technology Acceptance Model (TAM) In Evaluating “Desa Digital” Applications. IOP Conf Ser Mater Sci Eng.;1125(1):012055.
- Durodolu, O. (2016). Technology Acceptance Model as a Predictor of Using Information System to Acquire Information Literacy Skills. Library Philosophy and Practice, 1450.http://digitalcommons.unl.edu/libphilprac/1450
- Emeje M. O., Ofoefule S. I., Nnaji A. C., Ofoefule A. U. and Brown S. A. (2010) Assessment of bread safety in Nigeria: Quantitative determination of potassium bromate and lead
- Kashada, A., Li, H. & Koshadah, O. (2018). Analysis approach to identify factors influence digital learning technology adoption and utilization in developing countries. International Journal of Emerging Technologies in Learning, 13 (2), 48-59. https://doi.org/10.39 91/ijet.v13i02.7399
- Kumar, R. (2014). Studies on microbiological quality of ready
- Lee C. C, Lim HS. (2019) Factors Affecting Over-The-Top Services: An Expanded Technology Acceptance Model. Int J Interdiciplinary Res.;8(1).
- Long, L. (2010). A critical review of technology acceptance literature. Available at http://www.swdsi.org/swdsi2010/SW2010_Preceedings/papers/PA104.pdf
- Onobrakpeya, PE Nana, A. S., & Odu O. G. (2018) Improving service delivery through information and communication technology in the Nigerian manufacturing industry. Apeejay-Journal of Management Sciences and Technology 5 (2), 61-84 18
- Sindarta F, Santoso T. Pengaruh (2022) Perceived Ease of Use terhadap Intention to Use Melalui Perceived Usefulness Aplikasi Pemutar Musik Spotify di Kalangan Pengguna Smartphone Berbasis Android. AGORA.;10(1).
- Singh, S., Rana T., Kaur, N., Parihar, R., Kumar R., Kumar, S., & Kumar, R. (2014). Studies on microbiological quality of ready to eat food from solan city of himachal Pradesh. Int. J. Univ. Pharm. BioSci 3(3):181-189.
- Yuliana K, Syarwani A, Helda. (2022) Acceptance Analysis of School DAPODIK Information System Using the Technology Acceptance Model (TAM). In: International Seminar on Education, Technology, and Art. p. 114–23.
- Widayanto, A.P and Nugrah, N.S (2023) The impact of perceived ease of use and perceived usefulness on actual system use through intention to use as an intervening variable in subscription video on demand services (Study on Netflix users in Semarang City)