
Investigating Commuter Satisfaction in OLA: Analyzing the Effect of Real- time Pricing on Ride Expenses and Customer Loyalty
- Dr. Lakshmi S
- Gopika R
- 345-391
- May 9, 2024
- Environmental Assessment
Investigating Commuter Satisfaction in OLA: Analyzing the Effect of Real-time Pricing on Ride Expenses and Customer Loyalty
Dr. Lakshmi S1, Gopika R2
1Associate Professor, Faculty of Management Studies, CMS Business School, Bangalore
22 nd year MBA Business Analytics Student at CMS Business School, Bangalore.
DOI: https://doi.org/10.51244/IJRSI.2024.1104028
Received: 28 March 2024; Accepted: 05 April 2024; Published: 09 May 2024
ABSTRACT
Innovative ride-hailing services have caused a transformation in the transportation industry. Ola, the pioneer of taxi aggregation services in India, has played a significant role in driving this change. In 2010, students from the esteemed Indian Institute of Technology (IIT) Bombay founded Ola. From that time on, its global presence has expanded, now operating in more than 250 cities. Ola is recognized for its user-friendly travel choices, distinguishing itself through innovative business strategies that surpass regular taxi services. Ola’s strategy for operations is founded on the dynamic pricing model, a concept that the company created and brought into the transportation industry. This model demonstrates Ola’s ability to promptly modify pricing by market supply and demand fluctuations. Ola has established itself as a major player in the highly competitive ride-hailing industry, boasting more than 125 million users. This study analyzes the complex connection between Ola’s dynamic pricing strategy and commuter satisfaction. It also aims to analyze the impact of real-time pricing on ride costs and customer retention. This study seeks to uncover the various factors impacting commuter decisions within the growing taxi-hailing industry by analyzing customer satisfaction, decision-making processes, communication openness, app usage trends, and brand reputation. This research provides Ola with important information to enhance customer satisfaction and perfect pricing strategies. To accomplish this, it evaluates how clear the communication is perceived to be, examines the factors that greatly affect commuter satisfaction with Ola’s dynamic pricing, evaluates the impact of pricing on consumer decision-making, and understands the relationship between pricing changes and user interaction. It is essential to grasp the impact of real-time pricing on commuter satisfaction and loyalty to maintain market leadership amidst ongoing transportation sector changes, highlighting Ola’s significant role.
INTRODUCTION AND REVIEW OF LITERATURE
Rationale and Motivation for the Study
The emergence of ride-hailing companies, led by industry giants such as OLA, has sparked a transformation in city transportation. These technologies have revolutionized urban transportation by offering unparalleled accessibility, convenience, and flexibility for people. Dynamic pricing, which adjusts prices based on changes in supply and demand, is crucial for the operation of these services. Dynamic pricing, also called “surge pricing,” has been commended for its ability to optimize service provision at busy times, but has also faced backlash for potential issues of unevenness in fairness and transparency, particularly when there is high demand. The ride-hailing industry has been engaged in a heated debate following the Karnataka government’s latest measures, including the imposition of standard fares and the prohibition of fluctuating prices. This underscores the pressing importance of conducting empirical studies to investigate thoroughly how dynamic pricing impacts commuter satisfaction on OLA’s ride-hailing platform. This study was inspired by the need to understand how dynamic pricing impacts passenger experiences within OLA’s ecosystem amidst evolving regulatory frameworks and pricing strategies. The main purpose of the platform is to use dynamic pricing to enhance service delivery and find an equilibrium between supply and demand. Conversely, concerns have been raised regarding its impact on commuter loyalty and satisfaction. This research aims to delve deeply into the intricate dynamics at play through a comprehensive empirical investigation, examining the nuanced connections between pricing structures, customer attitudes, and quality of service. This study also seeks to explain the broader impacts of regulatory measures on consumer well-being and city transportation. The Karnataka government’s recent legislative revisions have raised doubts about the efficacy and fairness of dynamic pricing strategies in the ride-hailing industry. Policy makers, business proprietors, and other invested parties need to understand the impact of these changes on commuter loyalty and satisfaction. This study aims to provide practical understanding to help inform policy decisions based on evidence, enhance service delivery, and enhance consumer well-being by evaluating the alignment of OLA’s pricing strategies with customer expectations. This research aims to offer up-to-date perspectives on the evolving trends of the ride-hailing industry while also tackling current concerns regarding fluctuating prices. Understanding the impact of dynamic pricing on commuter satisfaction is becoming increasingly crucial due to rapid technological advancements and evolving regulatory conditions. This study seeks to
provide fresh insights on how price dynamics impact passenger behavior and decision-making through a careful analysis of factors such as affordability, transparency, and perceived value.
Statement of Research Problem
The emergence of online ride-hailing services like Ola has transformed how individuals move through Indian cities within the ever-changing transportation industry. Ola has become a significant player in the mobility ecosystem of the country by providing a mix of convenience, affordability, and technological innovation. Ola has changed the way millions of Indians commute by introducing safety features, cashless payment options, and real-time pricing mechanisms. Nevertheless, within the plethora of advantages offered by Ola’s services, there exist inherent obstacles and intricacies that impact commuter contentment and allegiance. The pricing strategy utilized by Ola is crucial to the overall commuter experience, with a specific focus on the concept of real-time pricing. Real-time pricing, which is also referred to as surge pricing or dynamic pricing, involves changing fares depending on the demand and supply conditions of trips at a particular time and place. Although this pricing strategy aims to maximize market efficiency and profits, it can also lead to worries and dissatisfaction among commuters. Even though dynamic pricing increases effectiveness, it has the potential to result in commuter discontent. Passengers are surprised by sudden fare hikes, especially during emergencies or urgent travel requirements. Critics claim that dynamic pricing takes advantage of consumers in emergency situations like heavy rainfall or transportation disruptions. Achieving a balance between making profits and keeping customers happy continues to be a tricky task for Ola. The aim of this research is to explore the various factors that enhance or diminish commuter contentment with Ola’s services, particularly examining how real-time pricing influences customer satisfaction and loyalty within the Indian market. Essentially, the study seeks to understand the complexities of commuter experiences on Ola’s ride-hailing platform and examine the effects of real-time pricing dynamics. The study primarily focuses on how commuter behavior and perception are affected by real-time pricing. This involves analyzing how Ola users make decisions, such as how they react to changes in prices and what ride options they prefer when demand is high. Furthermore, the study aims to reveal how the level of transparency in real-time pricing mechanisms impacts commuter trust and satisfaction.
Review of Literature
Bimpikis, K., Candogan, O., & Sabán, D. (2019) In their paper “Spatial Pricing in Ride- Sharing Networks,” Bimpikis, Candogan, and Saban examined how ride demand patterns affect the best rates and benefits packages offered by ride-sharing services. The study found that drivers’ ideal service locations were influenced by different rider destinations and their willingness to pay. Peak profitability and consumer surplus resulted from a balanced demand pattern among network sites, whereas imbalances spurred efficient differential pricing tactics. By analyzing different pricing strategies in dynamic network contexts, the study made a contribution and provided insights into how the platform functions in the face of fluctuating rider preferences and demand. Daozhi Zhao, Ziwei Yuan, Mingyang Chen & Shuang Yang- (2022) Users’ complaints over price fairness were raised when Didi Chuxing and Uber used differential pricing to increase platform participation. Four ride-sharing pricing models were examined by researchers: bilateral, differential driver, differential consumer, and uniform. When there are enough drivers, platforms frequently choose differential consumer pricing; when there aren’t enough drivers, they flip to differential driver pricing to control competition. According to the study, platforms have to walk a tightrope between market forces, legal requirements, and regulations in order to satisfy concerns about consumer and driver fairness. Kunal, A., Kaur, S., & Sharma, V. (2021) The study concentrated on ride-on-demand services that use dynamic pricing to balance supply and demand, such as Uber and OLA. The research suggested anticipating dynamic prices using the Rapido dataset in order to alleviate passengers’ difficulties in making quick decisions as a result of fluctuating rates. With a linear regression model, Rapido was able to estimate dynamic trip expenses with an astounding 93.40% accuracy rate, which was intended to improve passenger happiness by giving them accurate information. The report suggested more research into machine learning methods to raise the efficiency of dynamic price prediction frameworks and hence raise consumer satisfaction levels for ride-on-demand services. Lei, C., Jiang, Z., & Ouyang, Y. (2019) The study developed a multi-period Mathematical Programming with Equilibrium Constraints (MPEC) model to handle the dynamic pricing and vehicle dispatching difficulty in ridesharing. Through the use of an approximate dynamic programming (ADP) technique, the model showed promise for enhancing the performance of ridesharing systems in unpredictable and dynamic contexts. Future extensions, according to the research, should consider variable pricing options for trips, analyze the effect on traffic congestion on the roads, and broaden the modeling framework to include more stakeholders for deeper insights. Huarng, K., & Yu, T. H. (2020)
The study investigated the impact of surge pricing on consumer satisfaction and subsequent effects on customer retention. Utilizing fuzzy set/qualitative comparative analysis and qualitative analysis, the research revealed that loyal riders demonstrated higher tolerance for surge pricing. Contrary to early predictions, the findings indicated that customer happiness did not consistently lead to improved customer retention. The study emphasized the complexity of surge pricing variables, identifying time and store choice flexibility as crucial factors, and highlighted intricate interactions among surge pricing, customer satisfaction, loyalty, and retention. Lee, C. K. H., & Wong, A. (2021) The research examined consumer behavior and attitudes toward on-demand ride-hailing services, as represented by companies like as Uber and Grab, within the sharing economy. Using structural equation modeling to analyze survey data, the study determined the main variables affecting word-of-mouth (WOM) and attitude loyalty. Notably, cost consciousness, perceived usefulness, ease of use, safety risk, and customer value were important factors; environmental consciousness affected word-of-mouth but had a negative effect. The research emphasized the significance of word-of-mouth (WOM) in shaping purchase intentions and offered strategies for augmenting client allegiance inside the ride-hailing network. Rohani, A., & Nazari, M. (2012) Understanding how dynamic pricing and uniform pricing affect consumer behavior—especially for low- and high- involvement consumers—was the goal of the study. Dynamic pricing was more well-received by high-involvement consumers than uniform pricing, with younger and female customers being more likely to take advantage of reductions. Customers with high levels of involvement demonstrated happier, more likely to share their experiences, and more likely to repurchase based on discounts, offering insights into the complex relationships between pricing strategies and consumer behavior. Zhongmiao Sun Qi Xu and Baoli Shi (2020) The purpose of this work was to improve the profit optimization of ride-hailing platforms in the face of changes in market demand by applying optimal control theory to improve dynamic pricing algorithms. The study determined the most important variables affecting pricing choices, such as opportunity cost, upper price caps, and dynamic changes over time. The results emphasized the significance of ideal prices in maintaining a balance between supply and demand. They also emphasized the influence of fixed commission rates, enhancements in service quality, and variations in market demand on the total volume of transactions and platform profit. Anirvinna, C., & Deshmukh, A. K. (2019) The importance of surge pricing in revenue management was highlighted in this article’s critical evaluation of Ola and Uber’s pricing practices in India. It looked at the difficulties, different strategies including “concealed” surge pricing, and how they affected the supply of taxis, genuine demand, and driver incentives. Little government action or setting maximum prices during peak hours were suggested as alternatives, but the development of new competitors like OTS Cabs introduced competitive dynamics by emphasizing standard pricing and lower commissions to draw in drivers and customers. The paper emphasized that strong relationships between businesses, customers, and the government are necessary for the best possible results from ride-hailing services. Farshad Kooti, Mihajlo Grbovic, Luca Maria Aiello and et.al. (2017) With an emphasis on Uber, the study filled in knowledge gaps about user involvement in the sharing economy. It investigated how rider and driver behavior was affected by surge pricing, income, and demographic characteristics. The results showed that surge pricing was biased in favor of higher-income riders and that homophilous matching dynamics indicated that drivers with similar demographics received higher ratings. These findings offer important new information about how to improve the user experience and allow Uber to anticipate user preferences for retention campaigns. Sun, L., Teunter, R. H., Babaï, M. Z., & Hua, G. (2019) In order to determine the best price strategy taking into account ride information and driver location, the study examined the pricing power of online car-hailing services. The best pricing structure for the platform, according to the findings, includes a competitive ride-length-based charge and a congestion fee for rush hour. The analysis took into account variables like platform commission, driver profit expectations, traffic circumstances, and waiting expenses. This helped to clarify the best ways to price products in the rapidly changing online car-hailing market. Qi Luo & Romesh Saigal (2017) The study investigated dynamic pricing in on- demand ride-sharing using a continuous-time continuous-space framework. By controlling supply and demand and dynamically modifying rates and commissions, the model maximized revenue. The methodology tackled the intricacies of spatiotemporal pricing, providing valuable perspectives on efficacious approaches for adjusting to the ever-changing dynamic interplay between clients and accessible automobiles in the ride-sharing industry. Banerjee, S., Riquelme, C., & Johari, R. (2015) The goal of the study was to determine the best pricing strategies that take into account the needs of both drivers and customers for ride-sharing services like Sidecar, Lyft, and Uber. Utilizing an economic model grounded in queueing theory, the study highlighted the advantages of dynamic pricing as a means of resolving supply and demand mismatches. The study found that no dynamic pricing strategy consistently outperformed the best static pricing policy in terms of throughput and revenue, highlighting trade-offs between dynamic and static pricing strategies in ride-sharing systems, even though dynamic pricing demonstrated resilience to changes in system characteristics. M. F., Bakar,
R. A., & Hashim, F. (2022) In order to determine the variables affecting passenger pleasure and loyalty, the study concentrated on ridesharing services in developing nations. The findings of a survey conducted among 200 ridesharing customers revealed that loyalty was statistically significantly impacted by brand image alone, while pricing and brand image also had a major impact on consumer happiness. The results offer significant perspectives for stakeholders in the industry to navigate the competitive environment of on-demand transportation services in developing nations. Dr. Sharon Jude Samuel (2023) The study assessed Ola Cabs’ customer satisfaction, revealing reasons for choosing Ola, including cost-effectiveness, app usability, and technological expertise. While most clients reported satisfaction, challenges such as surge pricing, long wait times, cancellations, unprofessional behavior, and hygiene issues were identified. With a 60% market share and a 30.72 billion valuation in 2020, Ola faced growth opportunities driven by rising disposable income, urbanization, and increased smartphone usage. To maintain leadership, addressing customer concerns and enhancing service quality was recommended. Panigrahi, A. (2018) The article analyzed Ola Cabs’ performance in the cutthroat radio cab business, emphasizing the company’s commanding market share, superior customer happiness, and high caliber of service. Ola’s phenomenal development, with revenue increasing nearly tenfold in four years, was attributed to its strategic focus on target markets, personalization for different income categories, and a blend of classic and digital marketing methods. The report highlighted Ola’s dedication to efficiency, cutting-edge technology, and social responsibility while projecting the company’s strong development trajectory and future entry into the grocery delivery business. Dr. Jacob P M, Jithin Benedict (2017) The study focused on the Indian taxi industry, assessing customer satisfaction with major players like Uber and Ola Cabs. Seven variables, including price, service, safety, comfort, responsiveness, and driver behavior, were significant predictors of customer satisfaction. Language challenges affecting communication, surge pricing concerns, and additional variables like prompt arrival and vehicle cleanliness were identified as influencing factors. The study emphasized the critical role of online taxis in consumer perceptions and suggested addressing issues like surge pricing and language instruction for improved customer experience. Si, H., Duan, X., Cheng, L., & Zhang, Z. Y. (2022) The study used an expectation confirmation theory approach to investigate factors impacting consumers’ continuing use of dynamic ride-sharing services. Satisfaction, perceived utility, financial advantages, environmental conscience, and platform incentives were important factors influencing ongoing usage. Remarkably, pleasure among female users was more important than that of male users, and perceived utility was barely noticeable. The study highlighted the intricate dynamics influencing continuous use and offered stakeholders in environmental sustainability and transportation useful information. Vayouphack, S. (2020) With an emphasis on Thailand and India, the study investigated how ridesharing has evolved in developing nations. Key findings showed that whereas Thai visitors welcomed ridesharing because they were dissatisfied with local taxis, Indian travelers showed less faith in ridesharing, perhaps due to safety concerns. Indian taxi firms changed their business plans, and drivers objected to their salary cuts. Legalization differed; ridesharing is allowed in various parts of India, but Thai taxi drivers are against it. The study focused on different reactions to the rise of ridesharing in developing countries, underscoring the necessity of different strategies for addressing issues and governmental actions. Venkatesh, G. (2015) The report highlighted the use of technology by ride-sourcing services like Ola and Uber to overcome obstacles in the taxi business, with a focus on their success in India. It emphasized how software algorithms can effectively balance supply and demand, shorten wait times for customers, and improve price by utilizing dynamic pricing schemes. The research suggested that in order to guarantee the viability and expansion of cab aggregator services, performance metrics and innovation should be continuously prioritized. Thapa, G. (2020) The study examined customer behavior in relation to e-cab hailing services, taking into account variables such as cost, rewards, added brand features, preferences for ride-sharing, and environmental awareness. It emphasized the allure of e-cab services for younger people, stressing advantages including ease of use, reduced wait periods, and point-to-point transportation. In order to improve the whole e-cab experience, the research identified obstacles like as safety concerns, navigation issues, and the need for greater internet accessibility. It then suggested solutions like driver training, regulatory frameworks, and insurance alternatives. Dr. Rupali Rajesh (2021) The study focused on Uber users in Mumbai, highlighting factors influencing usage, such as speed, convenience, fair pricing, and driver behavior. Female users reported a positive experience, particularly with courteous drivers during peak hours, and felt more secure traveling at night. The study recommended targeted marketing strategies, including discounts, coupons, and personalized offers, based on user behavior and frequency of trips, to enhance the success of app-based online cab services. Srihari Hulikal Muralidhar (2016) The report analyzes Ola’s growth in India’s taxi service sector, emphasizing competition with Uber. It discusses Ola’s business plan, challenges, and the need for timely improvements to maintain its leadership. The study suggests Ola faces the risk of being surpassed by Uber and advocates for government intervention, drawing parallels with challenges faced by other Indian companies like Flipkart against global competitors. Agarwal, S., Mani, D., & Telang, R. (2023) The study looked at the effects of ride-hailing service unavailability on traffic levels in three major Indian cities. In densely populated areas, journey times dropped by 10.1% to 14.8% during driver strikes, with peak hours seeing the biggest reductions. The results indicated that ride-hailing automobiles displaced more environmentally friendly forms of transportation, even if their modal share was tiny. Additionally, they dramatically increased traffic in the cities under study. J. Senthil Velmurugan, R. Shruthi, S. V. Rajkamal (2019) The study assesses how technological advancements in ride-hailing services have affected the world, highlighting Ola’s explosive growth. It highlights Ola’s dedication to enhancing consumer experiences with new technology advancements. The study underlines how app-based taxi services are becoming more and more popular in urban areas and stresses how crucial it is to continue providing consistent service quality in order to succeed in the future.
Identification of Research Gaps
Several recurring gaps in previous research are highlighted. First of all, by ignoring potential insights into how regional variations in demand and destination preferences affect pricing policies and profitability, it is difficult to understand commuter behavior and satisfaction, particularly in diverse urban environments. Furthermore, the disregard for other approaches to problem solving, including various forms of Value Function Approximation (VFA), results in missed chances to improve the breadth and significance of analysis in dynamic operating environments. Furthermore, insufficient investigation into commuter attitudes regarding safety issues creates a vacuum in knowledge regarding the variables that contribute to the discrepancy between the acknowledged importance of safety and its lower-than-expected customer satisfaction rating, especially in the context of the COVID-19 pandemic. Additionally, ignoring operational and legal obstacles when ridesharing is introduced in underdeveloped nations misses opportunities to learn about distinctive dynamics and tactics, which restricts its application in a variety of international situations. Last but not least, a comprehensive analysis of the effects of dynamic pricing on commuter satisfaction is lacking, which makes it difficult to comprehend how changes in ride costs affect consumer attitudes and behavior and how to effectively customize pricing tactics to increase customer satisfaction and loyalty. In order to close these gaps, research is required to determine the critical factors affecting commuter satisfaction with OLA’s real-time pricing, investigate and evaluate commuter satisfaction with OLA’s pricing, measure the transparency of pricing communication, and investigate the effects of pricing variations on commuters’ frequency of app usage. All of these studies will ultimately contribute to an analysis of customer satisfaction and brand perception.
Theoretical underpinnings
Theoretical underpinnings in research typically refer to the foundational theories, concepts, or frameworks that guide the study’s design, methodology, and interpretation of results. These underpinnings provide a theoretical basis for understanding the phenomenon under investigation and help researchers formulate hypotheses, develop research questions, and interpret findings. Components that fall under theoretical underpinnings in this study includes:
Service Quality Theory:
- The theory of service quality, based on the Parasuraman et al. (1985) literature, points out that customer satisfaction and loyalty towards suppliers are strongly influenced by their perception of superior services. The theory suggests that the overall assessment of customer service quality is influenced by aspects like reliability, responsiveness, assurance, empathy and tangibles.
- In the context of ride-hailing services like OLA, service quality encompasses various aspects of the customer experience, including the reliability of pickups, the professionalism of drivers, the cleanliness and comfort of vehicles, and the overall ease of booking and payment Realtime pricing mechanisms, which are influenced by factors such as driver availability, wait times and predictability of fares, can have an impact on these dimensions in the form of passenger satisfaction and loyalty.
Expectancy-Disconfirmation Theory:
- Expectancy-disconfirmation theory, developed by Oliver (1980), posits that customer satisfaction is determined by the extent to which a product or service meets or exceeds the customer’s expectations. According to this theory, customer expectations are formed based on previous experience, word of mouth, and marketing communications which result in satisfaction when these expectations are fulfilled or
- OLA’s real-time pricing can affect commuters’ expectations in terms of fairness, affordability, and transparency of fares. For example, based on prior experiences or marketing materials from OLA, commuters could anticipate fair and predictable Positive disconfirmation and improved satisfaction levels may be experienced by commuters if real-time pricing meets these expectations or provides better-than- expected fares during off-peak hours. On the other hand, unexpected price increases during busy times might cause disconfirmation and decreased satisfaction.
Behavioral Economics:
- To understand how individuals make their decisions in actual-world situations, behavioral economics has integrated insights from psychology and economics. The psychological biases that influence decision-making processes have been illuminated by concepts such as prospect theory, loss aversion, and mental
- According to Kahneman and Tversky’s (1979) prospect theory, people assess possible profits and losses about a reference point, displaying risk aversion in the case of gains but risk-seeking behavior in the case of losses. When it comes to real-time pricing, commuters might use OLA or choose other forms of transportation because they would view price rises during peak hours as losses and become more sensitive to fare Furthermore, according to the loss aversion principle, ride-hailing’s convenience may not be worth as much as it would seem due to the negative utility of higher fees during peak pricing periods, which could result in less usage or worse satisfaction.
Pricing Strategies:
- How consumers perceive and behave with products has a major impact on pricing In some sectors, like hospitality and transport, dynamic pricing has been gaining popularity as a way of changing prices according to supply and demand dynamics. surge pricing, which ride-hailing companies are using in times of high demand, is a type of dynamic pricing. In regions where there is a shortage of available space, it seeks to balance supply and demand by rewarding the drivers that serve its customers.
Technology Adoption Models:
- Technology adoption models, such as the Technology Acceptance Model (TAM) and the Unified Theory of Acceptance and Use of Technology (UTAUT), provide frameworks for understanding how users perceive and adopt new technologies and These models emphasize factors such as user perception of usefulness, ease of use, social influence and behavioral intentions to shape their acceptance and adoption behavior.
- It applies to technology adoption models to assess commuter perceptions of real-time pricing features such as fare estimates, surge notifications, and price transparency, in the context of real-time pricing in ride-hailing apps such as OLA. The study will provide strategies to increase user acceptance and ultimately drive long-term loyalty towards the platform through identification of drivers and barriers to adoption of actual time pricing features.
Customer Loyalty Models:
- Models of customer loyalty provide a framework for understanding the factors influencing customer retention, repeat purchase behavior, and The dimensions of service quality, perceived value, satisfaction, and recommendation likelihood are addressed in models like SERVQUAL Service Quality Score and NPSNet Promoter Score to predict customer loyalty.
- We can apply customer loyalty models to assess the impact of price changes on commuting satisfaction and loyalty under OLA’s real-time pricing. The commuter’s perception of OLA’s value proposition and the likelihood that users will continue to use or recommend it can be influenced by factors, e.g. fare affordability, transparency, reliability, and general quality of customer service. The study could inform strategies to improve the satisfaction and retention of passengers by increasing OLA’s long-term profitability and market shares, through identifying customer loyalty drivers.
Consumer Decision-Making:
- Frameworks for understanding how individuals evaluate and choose between alternative products and services are provided by consumer decision-making theories. Models focusing on factors such as the perception of risks, attitudes, subjective norms and perceptions of behavioral control in influencing consumer choice include Consumer Decision Processes, Model for Planned Behavior, and Behavioral Decision- making
- We can use consumer choice theory to analyze how real-time pricing information is evaluated by drivers and passengers and how they make decisions on ride times, timing, and frequency, in the context of ride-hailing services such as OLA. The choice of commuting mode and subsequent satisfaction levels can be influenced by factors like perceived affordability, comfort, trust in the platform as well as other options for
RESEARCH METHODOLOGY
Scope of the Study
The study aims to provide a thorough analysis of how Ola’s real-time pricing affects ride costs and customer loyalty in the context of India’s developing taxi business. The research is driven by the necessity to comprehend the complex association that exists between Ola’s dynamic pricing approach and commuter contentment, especially in light of Ola’s noteworthy function as an early adopter of cab aggregators in India. The purpose of the study is to shed light on several commuter satisfaction issues, with a focus on Ola’s real-time pricing’s perceived value, predictability, and fairness. To accomplish this goal, the study will investigate and assess commuter contentment with Ola’s pricing, with an emphasis on accessibility, openness, and the total perceived value of rides to ascertain how these factors affect patron loyalty. Additionally, by analyzing the relationship between pricing fluctuations and commuter preferences, the research aims to evaluate how Ola’s real-time pricing influences customers’ decision-making about ride selection and scheduling. This part of the research attempts to identify the fundamental forces that influence commuter behavior in the context of Ola’s dynamic pricing. Additionally, the study aims to gauge how transparently Ola’s real-time pricing is viewed, and it will look into how this affects commuter satisfaction and how it influences consumer loyalty. Through an examination of pricing communication transparency, the study seeks to clarify how it affects consumer perceptions and, in turn, their loyalty to the Ola brand. To better understand the connection between price dynamics and user engagement, the study also aims to investigate if variations in Ola’s real-time pricing have an impact on commuters’ frequency of app usage. This part of the study seeks to shed light on how price changes affect passenger behavior and how they engage with the Ola platform, which will ultimately help with an examination of consumer happiness and brand perception.
Research Objectives
- To identify the key factors influencing commuter satisfaction with Ride-Hailing App’s real-time
- To assess whether the real-time pricing of Ride-Hailing App affects customer decision-
- To measure the perceived level of transparency in communication with the Ride- Hailing App on ride
- To understand the relationship between pricing dynamics and user engagement, ultimately contributing to an analysis of customer satisfaction and brand in the Ride Hailing App.
Framing of Research Hypotheses
A testable prediction or explanation developed to direct study and inquiry is called a hypothesis. It functions as a hypothesis that is based on theories or current information. Hypotheses give the research process direction and organization by defining expected results or relationships between variables. In the end, hypotheses are essential to the growth of scientific knowledge and understanding.
Two main categories of hypotheses are used for hypothesis testing, as follows
Null hypothesis or H0: It is the default assumption that there’s no significant relationship, effect, or difference in variables. This implies that any differences or effects observed are caused by variability in the samples or an irregularity of chance.
Alternative hypothesis Ha or H1: A different hypothesis proposes a specific link, effect, and difference between variables than that of the false hypothesis. This implies that there is a real effect or relationship and that the observed results are not the result of chance.
The following hypotheses have been proposed:
Hypothesis 1
H0: No significant correlation exists between commuter satisfaction and fairness in pricing.
H1: There is a significant positive correlation between commuter satisfaction and fairness in pricing.
Hypothesis 2
H0: No significant correlation exists between commuter satisfaction and predictability in pricing.
H1: There is a significant positive correlation between commuter satisfaction and predictability in pricing.
Hypothesis 3
H0: No significant correlation exists between commuter satisfaction and perceived value in pricing.
H1: There is a significant positive correlation between commuter satisfaction and perceived value in pricing.
Hypothesis 4
H0: No significant correlation exists between commuter satisfaction and transparency in pricing.
H1: There is a significant positive correlation between commuter satisfaction and transparency in pricing.
Hypothesis 5
H0: Affordability has no significant influence on commuter satisfaction or customer loyalty.
H1: Affordability positively influences commuter satisfaction or customer loyalty.
Hypothesis 6
H0: Transparency has no significant influence on commuter satisfaction or customer loyalty. H1: Transparency positively influences commuter satisfaction or customer loyalty.
Hypothesis 7
H0: Perceived value has no significant influence on commuter satisfaction or customer loyalty.
H1: Perceived value positively influences commuter satisfaction and customer loyalty.
Hypothesis 8
H0: Pricing fluctuations are not associated with commuter decision-making regarding ride choices or timing.
H1: Pricing fluctuations are significantly associated with commuter decision-making in ride choices and timing.
Hypothesis 9
H0: There is no positive relationship between perceived transparency and commuter satisfaction or customer loyalty.
H1: Perceived transparency is positively related to commuter satisfaction and customer loyalty.
Hypothesis 10
H0: There are no significant differences in app usage frequency based on variations in OLA’s real-time pricing.
H1: Significant differences exist in app usage frequency based on variations in OLA’s real- time pricing.
Hypothesis 11
H0: There is no significant association between income levels and the decision to use OLA during surge pricing periods.
H1: There is a significant association between income levels and the decision to use OLA during surge pricing periods.
Research Design
This research uses a quantitative approach, with surveys serving as the main means of gathering data. Its main objective is to assess commuter satisfaction in the context of OLA, one of the top ride-hailing services. In particular, the study looks into how ride costs and consumer loyalty are affected by real-time pricing. The project attempts to collect primary data on these dynamics by giving structured surveys to OLA commuters. Using a thorough statistical analysis of survey data, the study looks for trends and connections that shed light on how commuter behavior and perceptions are affected by price changes.
Quantitative Research: The relationship between real-time pricing fluctuations in OLA rides and their effects on ride expenses and customer loyalty has been investigated in this study using a quantitative correlational research design, which enables a thorough analysis of any potential associations between these variables. The purpose of this design was to offer statistical insights into the degree of correlation between price dynamics and commuter behaviors. This design will help to improve OLA’s overall quality of service by providing useful empirical information to guide strategic decisions.
Correlational Research Design: Searching for the degree of a relationship is the goal of correlational research, using statistical data between two or more variables. This design approach looks for and interprets relationships between variables. Though it does not go as far in its analysis to determine causation for these observed patterns, this form of research will identify trends and patterns in the data. For this kind of observational research, cause and effect are not the foundation. The variables’ distributions, correlations, and data are the only things examined. The variables are identified and analyzed in their natural environment; they are not altered in any way.
Methods for Data Collection & Variables of the Study
The data collection for this research primarily relies on structured surveys administered to OLA users. The surveys are designed to gather comprehensive information regarding commuter experiences, perceptions, and behaviors related to real-time pricing, ride expenses, and customer loyalty within the OLA service framework. Various aspects, such as the frequency of OLA use, satisfaction with price mechanisms, perceptions of value for money, factors affecting customers’ loyalty, and demographic information are covered in the survey questionnaire. In addition, efforts are being undertaken to retain the anonymity and confidentiality of respondents’ data to facilitate their candid answers. During the data collection process, due regard shall be given to ethical considerations including informed consent and data protection measures. This research aims to gather reliable and relevant information on the dynamics of satisfaction in OLA’s service ecosystem through structured surveys as a primary method for collecting data, which will contribute to an understanding of the impact of real-time pricing on transport costs and customer loyalty.
Area of the Study: The research primarily draws respondents from Bangalore, a bustling metropolitan hub, encompassing individuals residing in the southern regions of Tamil Nadu, Andhra Pradesh, and Kerala, who are frequent users of OLA services. Additionally, a subset of respondents from North India, currently residing in Bangalore, are also included in the study. By incorporating perspectives from both North and South India, the research seeks to capture a diverse range of experiences and perceptions among OLA users.
Sample size: The estimated sample size for this research was initially planned to be 160 individuals. However, due to practical constraints and potential limitations in recruitment, the final targeted sample size was 131 individuals. This sample includes OLA users primarily residing in Bangalore, constituting approximately 70% of the total sample. Additionally, respondents from the southern states of Tamil Nadu, Andhra Pradesh, and Kerala contribute to the sample, each accounting for approximately 20% of the total sample size. Furthermore, a subset of respondents from North India, currently residing in Bangalore, makes up the remaining 10% of the sample. This diverse population of OLA users from both North and South India ensures a representative mix of demographics, socio-economic backgrounds, and travel patterns, facilitating a comprehensive exploration of commuter satisfaction dynamics within OLA’s service ecosystem across different regions of the country.
Sampling Technique: The sampling technique employed for this research is a combination of Stratified and Convenience sampling methods. Initially, a stratified sampling approach is used to ensure representation from different geographical regions and demographics. Specifically, the population of OLA users is divided into strata based on geographic location, including Bangalore as the primary focus area, and the southern states of Tamil Nadu, Andhra Pradesh, and Kerala. Additionally, a subset of respondents from North India, currently residing in Bangalore, is included to capture a broader spectrum of experiences.
Within each stratum, convenience sampling is employed to select participants based on accessibility and availability. OLA users are approached through various channels such as online platforms, social media groups, and community networks.
While convenience sampling facilitates practicality in participant recruitment, efforts are made to ensure diversity within the sample by targeting individuals from different socio-economic backgrounds, age groups, and levels of OLA usage. Moreover, the sample size is determined based on considerations of statistical power and practical constraints, aiming to achieve a balance between representativeness and feasibility.
By employing a combination of stratified and convenience sampling techniques, this research endeavors to gather a diverse yet manageable sample of OLA users, providing valuable insights into commuter satisfaction dynamics across various regions and demographics.
Variables of the Study
Pricing Factors:
- Real-time pricing fluctuations: Refers to the changes in OLA ride fares based on demand and other factors, impacting commuter
- Affordability of rides: Focuses on whether OLA fares are within the budget of commuters across different income brackets.
- Perceived value for money: Investigates commuters’ opinions on whether OLA rides offer value commensurate with the fare
- Price fairness: Evaluates whether OLA’s pricing practices are perceived as equitable and reasonable by commuters.
Commuter Behavior and Preferences:
- Ride choices and timing: Explores factors influencing commuters’ decisions on when and which OLA rides to take, considering factors like convenience, availability, and
- Frequency of app usage: Examines how often commuters utilize the OLA app for ride-hailing purposes and the reasons behind their usage
Customer Loyalty:
- Satisfaction with pricing: Assesses commuters’ overall satisfaction levels with OLA ride pricing and its impact on their loyalty to the
- Perceived value of rides: Explores commuters’ perceptions of the value they receive from OLA rides relative to their cost, and how this affects their loyalty.
- Communication transparency: Examines how transparent and clear OLA is in its communication with users, particularly regarding pricing and service
- Brand image and loyalty: Investigates the role of OLA’s brand image and reputation in fostering customer loyalty and repeat usage of the
Socio-economic and Demographic Factors:
- Gender differences in commuter behavior: Explores potential variations in commuting habits, ride preferences, and usage patterns between male and female OLA
- Age-related preferences and habits: Examines how age influences commuting behaviors, preferences for ride-hailing services, and frequency of app
- Income levels and affordability: Investigates the impact of income on commuters’ perceptions of affordability, ride choices, and overall satisfaction with OLA’s
DATA ANALYSIS AND INTERPRETATION
- Techniques for Data Analysis
Quantitative Analysis
Typically, this study is evaluated using numerical data. The data shown here can be further statistically modified because they are presented as measurement scales. Descriptive, factor analysis, and statistical analysis are mostly used in this study to establish the study’s goal. The first step is called descriptive analysis, which uses statistical measures like means, medians, and graphical representations to provide important summaries of the dataset’s key aspects. Factor analysis goes beyond simple interpretation by revealing latent variables that clarify relationships between observed variables, improving our understanding of the dataset’s underlying structure. Our extensive use of statistical analysis, which encompasses a wide range of techniques—from regression and correlation analysis to hypothesis testing—complements these methodologies. These tools enable us to test hypotheses, derive meaningful insights, and direct our research toward its intended goals.
Qualitative Analysis
In this study, qualitative analysis is employed, specifically focusing on sentiment analysis to discern the emotional undertones and attitudes conveyed within the consumer responses. It is intended that by categorizing sentences based on the emotions they convey—positive, negative, or neutral—a deeper comprehension of the emotional landscape captured in the speech will be attained. Using this qualitative lens, the goal is to highlight the richness of emotion found in the text while offering perceptive insights into the attitudes, opinions, and experiences that are reflected in the language towards the real-time pricing of the ride-hailing app OLA.
Descriptive Analysis
The foundation for comprehending and summarizing datasets is descriptive analysis, which provides researchers with important insights into the traits and patterns present in the data. This method’s fundamental step is to calculate important statistical measures, which give an overview of the average values and variability of the data. Examples of these measures are measures of central tendency (mean, median, mode) and measures of dispersion (range, variance, standard deviation). Additionally, descriptive analysis looks at frequency distributions for categorical variables and uses tables, histograms, or bar charts to explain how data is distributed among various categories. Visualizations are essential because they facilitate the natural interpretation and transmission of results using a variety of graphical formats.
Factor Analysis
A statistical method for determining the latent elements or underlying structure influencing observed data is called factor analysis. Factor analysis looks for patterns of correlations between variables to find latent factors—which are inferred from the data rather than being explicitly visible. Its main purpose is to make big datasets less dimensional, making analysis and interpretation easier. By arranging the variables into logical clusters according to their correlations, factor analysis facilitates comprehension of the relationships between the variables. The results of the factor analysis are often accompanied by loadings, which show the direction and level of correlation between variables and their underlying factors. Exploratory factor analysis (EFA) is a statistical technique used in this study to examine the dataset’s underlying structure without making any assumptions beforehand. To seek latent factors that might explain the variability observed, EFA takes a close look at the correlation pattern of variables.
Sentiment Analysis
Sentiment analysis is a vital technique for determining participants’ opinions determining whether they have any favorable or negative attitudes. Text replies from participants are methodically examined using sentiment analysis techniques to classify them into several sentiment categories, such as positive, negative, or neutral. Through the use of this technique, important information about participants’ opinions and experiences with Ola’s real-time pricing mechanism can be extracted. It is possible to determine whether participants have positive or negative opinions on Ola’s pricing approach by analyzing the attitude indicated in the responses. In addition to offering a thorough grasp of participants’ sentiments, our analysis highlights possible areas where Ola’s pricing strategy could be optimized or improved. In the end, sentiment research is crucial for revealing important information and guiding strategic decision-making procedures concerning Ola’s real-time pricing strategy.
Hypothesis Testing and Methods
A specific, verifiable prediction of the outcome of the research team’s work is known as a hypothesis. Typically, this entails putting forth a plausible correlation between the independent variable (what the researcher modifies) and the dependent variable (what the research measures). Usually, the null hypothesis and the alternative hypothesis are expressed as the hypothesis in research (called the experimental hypothesis when the method of investigation is an experiment).
Methods
The analytical foundation of this study is provided by Python, which makes it easier to thoroughly review the information obtained from participant responses. By utilizing its strong libraries and flexible features, statistical methods such as regression analysis, correlation analysis, and chi-square tests are utilized to get significant insights. With the help of Python’s broad range of functions, helps us to carefully examine the correlations between variables, revealing patterns and trends that are essential to the goals of the study. The chi-square test clarifies relationships between categorical variables and highlights complex relationships. By identifying predictors and their effects, regression analysis provides a greater understanding of the complex dynamics between dependent and independent variables. Moreover, correlation analysis reveals underlying patterns by exploring the direction and strength of relationships between continuous variables.
Regression
Regression analysis is used to estimate relationships between dependent and independent variables. It is applied to determine how strongly two variables are connected and to predict how they will interact in the future. A data analysis technique called linear regression examines the linear relationship between one or more independent variables and a dependent variable. In order to describe the behavior of the dependent variable, it is frequently used to visually illustrate the strength of the connection or correlation between various parts as well as the dispersion of data. The goal of a linear regression model is to evaluate the strength and statistical importance of a relationship between variables. The stronger the association and tighter the fit to the regression line are determined by the data variability, since a regression is a graphical depiction of this relationship. A regression output will not only produce beta coefficients but will also indicate statistical significance tests based on the standard error of each coefficient (such as the p-value and confidence intervals). Analysts frequently use a p- value of 0.05 or less to suggest significance; if the p-value is bigger, the resultant beta coefficient cannot be ruled out as chance or randomness. However, the interactions between variables are frequently more intricate and multidimensional in real-world situations. Regression analysis using multiples is used to handle this complexity. By using two or more independent variables to predict the value of a dependent variable, multiple regression builds on linear regression. Several regression allows for the simultaneous consideration of several predictors, which facilitates a more thorough understanding of the factors impacting the behavior of the dependent variable. Using a variety of indicators, analysts evaluate the statistical significance and strength of correlations between variables in a multiple regression model. To measure the strength and direction of the correlations, statistical significance tests like p-values and confidence intervals are performed in addition to beta coefficients. Statistical significance is usually indicated by a p-value of 0.05 or below, which implies that the observed link is unlikely to have happened by accident. Multiple regression improves the regression model’s predictive power and offers important insights into the intricate interactions between variables through these analyses.
Chi-square Test
A measure that assesses how well a model corresponds to actual observed data is the chi-square statistic. Data that is random, unedited, mutually exclusive, derived from independent variables, and taken from a sizable sample are all requirements for the chi-square statistic. Chi- square tests for hypothesis testing are commonly employed. The chi-square statistic assesses the extent of any discrepancies between the anticipated and actual results based on the sample size and the number of variables in the relationship. These tests employ degrees of freedom to determine if a certain null hypothesis can be ruled out based on the total number of variables and samples used in the experiment. As with any statistic, the results are more reliable the larger the sample size. The difference between the observed and predicted frequencies of a group of events or variables is determined using a chi-square statistic test.
Correlation Test
A statistical method called the correlation test helps to clarify how closely two variables are related to one another and how much of an association there is. By evaluating the direction and intensity of the relationship between the variables, this method sheds light on how interdependent they are. The computation of the correlation coefficient, which expresses the direction and intensity of the relationship between variables, is essential to correlation analysis. Finding the correlation coefficient in a regression study is simple because it ranges from -1 to
Additionally, Spearman correlation is used in some situations where there is a nonlinear relationship between the variables or when the data has non-normal distributions or outliers. A more thorough evaluation of association in these circumstances is made possible by the nonparametric Spearman correlation, which assesses the monotonic relationship between variables. Spearman correlation is very helpful in evaluating ordinal or non-normally distributed data since, in contrast to Pearson correlation, it does not require linearity or normality in the data. It helps us to assess the relationship between variables regardless of the distributional properties of the data or the existence of outliers by combining Spearman correlation with conventional correlation techniques. This improves the validity and reliability of the analysis.
Data Interpretation
Descriptive Analysis
Descriptive statistics give valuable insight into the distribution and characteristics of categorical variables, e.g. gender, employment, or income month by month.
Descriptive statistics may reveal the frequency and proportion of respondents who identify as male, female, or other when it comes to the question “Gender”. This analysis provides information on the gender composition of the sample, as well as any possible imbalances in men’s and women’s data.
Similarly, descriptive statistics on the “Occupation” variable show that respondents are distributed across different occupational categories such as students, employed people, self- employed individuals, unemployed persons, retired persons, and those falling into another category of ‘Other’. The findings from this analysis show that the sample has a different range of occupations.
In addition, the frequency of respondents in different income categories from below 50,000 to over 250,000 is set out in a summary statistical data on ‘Monthly Income’. The researchers can identify patterns of income levels between the sample population through an analysis of the proportion of respondents in each income group.
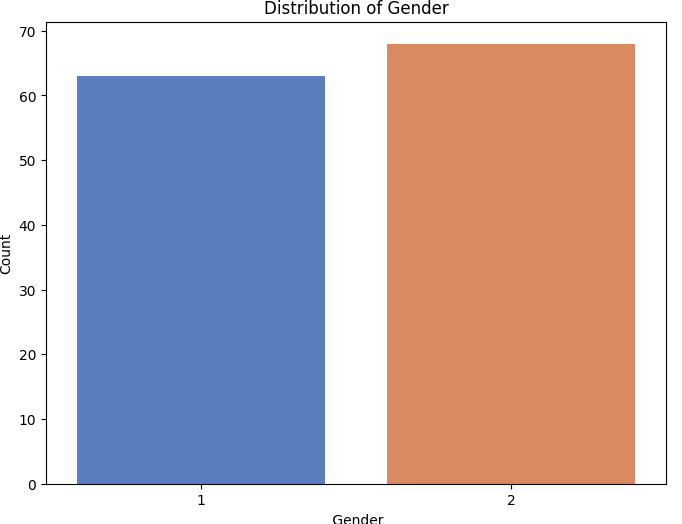
Fig: 3.3.1
Among the 131 respondents, the chart illustrates the distribution of gender across the provided categories: Male, Female, and Other. Notably, the data reveals a higher representation of female respondents, with 68 individuals identifying as female. This indicates that females constitute a significant portion of the sample population, as depicted by the chart.
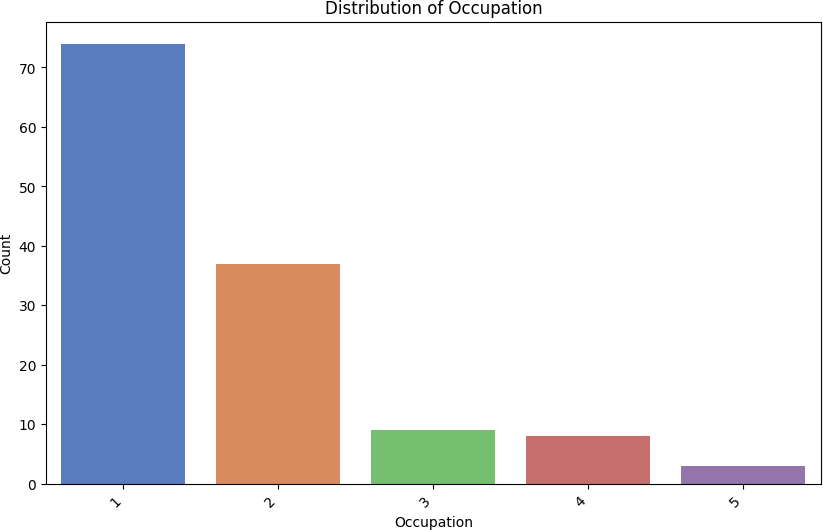
Fig 3.3.2
The chart presents the distribution of occupations among the 131 respondents. Across the x-axis, various occupation categories are depicted, while the y-axis represents the count or frequency of respondents falling into each occupation. Observations reveal that the highest count of respondents corresponds to students, totaling 74 individuals. Other occupation categories include employed (38 respondents), self-employed (9 respondents), unemployed (8 respondents), and retired (2 respondents). The majority of respondents in this study are students. This observation indicates active participation among students in research concerning commuter satisfaction and the impact of pricing on customer loyalty. Additionally, the distribution of other occupations provides valuable context for understanding the sample composition of the study.
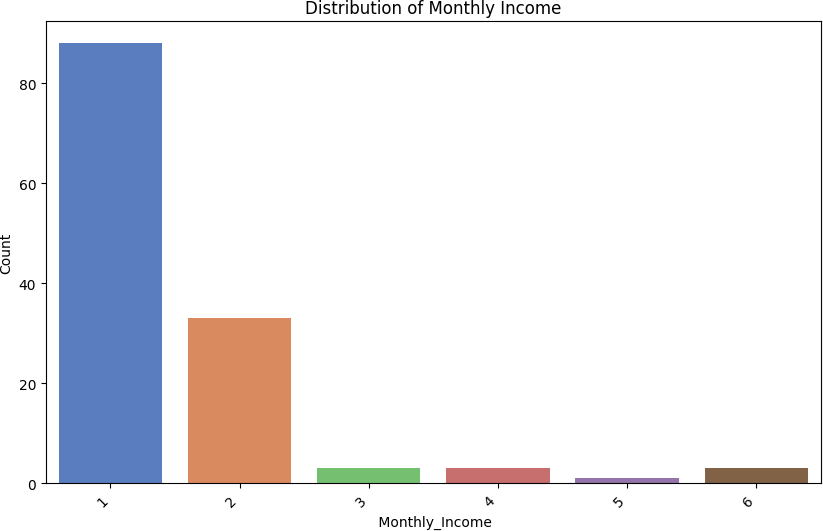
Fig 3.3.3
The distribution of monthly income among the 131 respondents is as follows: 89 respondents reported a monthly income below 50,000, making it the most common type of income. Based on this, 33 respondents took into account a revenue range from 50,000 to 100,000. Moreover, three respondents in the income brackets of 100 000 to 150 000 euro, 15 000 to 200,000 euro, and more than that are present. Only one respondent submitted information concerning income from 200,000 to 250,000. These findings suggest that the sample population is highly diverse in terms of income levels, with a significant proportion below 50,000 dollars monthly. These differences in revenue distribution provide an important context to understand the socioeconomic background of the participants in the study, which is relevant for the analysis of the impact of real-time pricing on ride costs and customer loyalty within the OLA platform.
Summary Statistics for Age
Summary Statistics for Age:
| count | 131.000000 |
| mean | 2.748092 |
| std | 1.302917 |
| min | 1.000000 |
| 25% | 2.000000 |
| 50% | 2.000000 |
| 75% | 3.000000 |
| max | 7.000000 |
Name: Age, dtype: float64
The summary statistics for Age depicts as follows:
Count: There are 131 observations (or respondents) in total for the age variable.
Mean: The average age of the respondents is around 2.75. This mean value does not represent a specific age, but rather indicates an average age category because the ages are numerically encoded between “Under 18” as 1 and “18-24” as 2 or more.
Standard Deviation (Std): A standard deviation of approximately 1.30 indicates that the age distribution of the respondents is between the mean age groups. It suggests that, on average, the age categories vary from the mean category of 2.75 to about 1.30.
Minimum (Min): A minimum of 1 indicates that at least one respondent belongs to the “Under 18” category.
25th Percentile (25%): The 25th percentile of 2 corresponds to the lower end of the “18- 24” category. This indicates that 25% of the respondents are in the “Under 18” or “18-24” age categories.
Median (50%): When age categories are arranged in ascending order, the median value is 2 indicating a middle category. In the “18 to 24” age category, it suggests that 50% of respondents are aged under 18.
75th Percentile (75%): The 75th percentile value of 3 is in line with the top end of the “25-34” category. This indicates that 75% of the respondents are in the “Under 18,” “18- 24,” or “25-34” age categories.
Maximum (Max): The maximum number of 7 is equal to the “65 or older” category, indicating that at most one respondent was in this age group.
Hypothesis Testing 1
H0: No significant correlation exists between commuter satisfaction and fairness in pricing.
H1: There is a significant positive correlation between commuter satisfaction and fairness in pricing.
To test the hypotheses regarding the correlation between commuter satisfaction and fairness in pricing, Spearman correlation analysis is employed. No significant correlation exists between commuter satisfaction and price fairness, according to the null hypothesis. Conversely, the alternative hypothesis (H1) suggests a significant positive correlation between these variables. Spearman correlation, being a non-parametric measure, is particularly suited for analyzing the relationship between ordinal or non-normally distributed variables, making it appropriate for this study. Using Spearman correlation analysis, we can gauge the strength and direction of the relationship between commuter satisfaction and fairness in pricing to determine whether or not there is statistical significance for these two main factors.
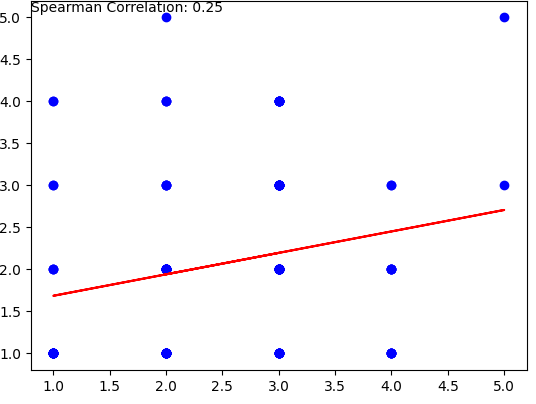
Fig 3.3.4
Spearman Correlation between perceived ness and loyalty: 0.25424232273123504
P-value: 0.003385725564552129
Interpretation:
Loyalty and perceived price fairness have a weak but favorable link, based on the interpretation of the correlation coefficient. Although the correlation coefficient of 0.254 is only slightly associated with these variables, it suggests that there may be some association at all.
This correlation coefficient suggests that there is a small increase in loyalty to Ola’s real-time pricing when the perception of price fairness increases. However, it is not possible to conclude the relationship between these variables due to their correlation. Loyalty to Ola’s real-time pricing is likely also influenced by other factors, apart from the perception of price fairness.
It’s important to note that correlation coefficients range from -1 to 1, where 1 indicates a perfect positive correlation, -1 indicates a perfect negative correlation, and 0 indicates no correlation. In this case, a correlation coefficient of 0.254 suggests a positive but weak association between perceivedness and loyalty regarding OLA’s real-time pricing.
Also, the p-value is 0.003385725564552129, which is less than the commonly used significance level of 0.05. Therefore, we would reject the null hypothesis (H0: No significant correlation exists between commuter satisfaction and fairness). The small p-value suggests a strong positive correlation between satisfaction with the commute and fairness.
Hypothesis Testing 2
H0: No significant correlation exists between commuter satisfaction and predictability in pricing.
H1: There is a significant positive correlation between commuter satisfaction and predictability in pricing.
For this hypothesis, the Spearman correlation test is effective because it examines the strength and direction of the monotonic relationship between two variables. The Spearman correlation coefficient captures this association if there is a consistent trend in how predictability and satisfaction change over time, either up or down.
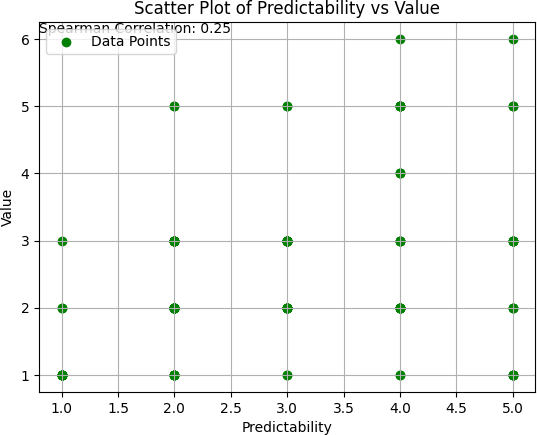
Fig 3.3.5
Spearman Correlation between predictability and value: 0.25424232273123504
P-value: 9.977467730785316e-06
The value of 0.25424232273123504 is suggestive of a good correlation between predictability and price. This indicates that, as one variable’s predictability increases, the other variable’s value increases as well. However, since the correlation coefficient is 0.2 to 0.5, it has a modest degree of strength.
The p-value is extremely significant near zero, indicating that there was no chance of such a correlation occurring at all. A small p-value, usually less than 0.05) suggests there is sufficient evidence to reject a null hypothesis in the test of hypotheses.
The statistically significant positive correlation between predictability and value suggests that, with the perception of predictable OLA real-time price increases, passengers are more likely to rate their overall perceived value positively. In simpler terms, there is evidence to support the idea that there is a relationship between the predictability of prices and the perceived value of passengers.
Hypothesis Testing 3
H0: No significant correlation exists between commuter satisfaction and perceived value in pricing.
H1: There is a significant positive correlation between commuter satisfaction and perceived value in pricing.
Spearman correlation analysis is used to examine the relationship between respondents’ perceived value for Ola pricing and their level of satisfaction with transparency. According to the hypothesis, people who think Ola’s prices are offering more value may express greater satisfaction with transparency of pricing information provided, since they tend to have a higher perception of value and confidence in transparency. To determine whether there is a statistically important correlation between perception of value and satisfaction with transparency Spearman correlation is used, which allows for an assessment of the strength and direction of association among ordinal or nonnormally distributed variables. This approach enables a thorough examination to be made of Ola’s real-time pricing model of the possible link between these two key aspects of customer experience.
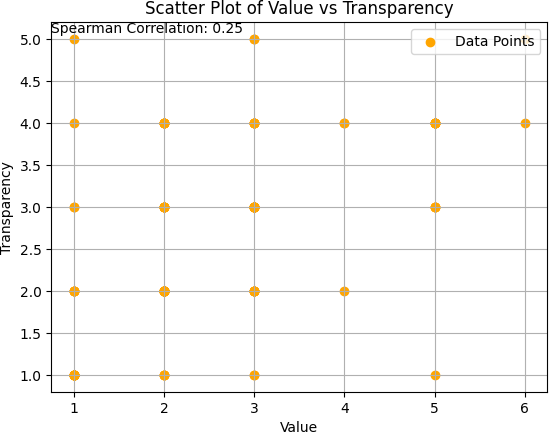
Fig 3.3.6
Spearman Correlation between value and transparency: 0.25424232273123504 P-value: 2.7822035966509887e-13
Interpretation:
Perceived value and transparency have a mild to moderately positive correlation, as indicated by the correlation coefficient of 0.2542. Transparency scores tend to rise in tandem with gains in perceived value, and vice versa. Transparency in commuter satisfaction and perceived value are positively correlated, according to the data. Travelers who believe that OLA’s real-time pricing offers greater value are also more inclined to think favorably of the service’s openness. The 2.7822e-13 p-value is extremely near to zero and far less than typical significance thresholds (e.g., 0.05). This implies that there is statistical significance in the correlation that was found. We reject the null hypothesis (H0), according to which there is no significant link between commuter satisfaction and perceived value, with a p-value below the selected significance level. Rather, we agree with the alternative hypothesis (H1), according to which these two factors significantly positively correlated. Despite the statistical significance of the correlation, it is crucial to take into account its practical implications.
Hypothesis Testing 4
H0: No significant correlation exists between commuter satisfaction and transparency in pricing.
H1: There is a significant positive correlation between commuter satisfaction and transparency in pricing.
To investigate the relationship between respondents’ satisfaction with the transparency of Ola’s pricing information and the impact of transparent communication about pricing on their overall satisfaction and loyalty to the platform, Spearman correlation analysis is employed. The hypothesis suggests that there exists a correlation between satisfaction with pricing transparency and its impact on overall satisfaction and loyalty to the Ola platform. In particular, it is expected that people who report higher levels of satisfaction with price transparency will perceive a greater impact on their overall satisfaction and loyalty to the platform as a result of transparent communication. To determine whether the two constructs have statistically meaningful relationships Spearman correlation analysis is used, which is particularly appropriate for an evaluation of their relationship with ordinal variables and unnormally distributed variables. This approach allows for a thorough examination to be made of the possible relationships between satisfaction with pricing transparency and its wider impact on customer satisfaction and loyalty as regards Ola’s service.
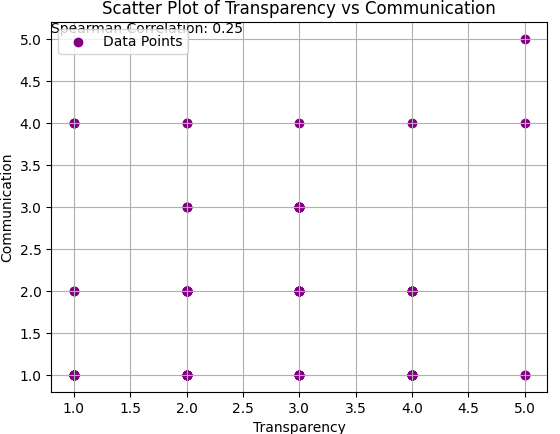
Fig 3.3.7
Spearman Correlation between transparency and communication: 0.25424232273123504
P-value: 0.24768087756554075
Interpretation:
The correlation coefficient (0.2542) indicates a positive correlation between respondents’ satisfaction with the transparency of OLA’s pricing information and the impact of transparent communication on overall satisfaction and loyalty to the platform. This positive correlation suggests that there is a tendency for respondents who report higher levels of satisfaction with the transparency of OLA’s pricing information to also report a greater impact of transparent communication on their overall satisfaction and loyalty to the platform.
While the correlation is positive, indicating a general alignment between these two variables, the modest magnitude of 0.2542 suggests a moderate rather than a strong correlation. In other words, the relationship is not extremely robust based on the provided data.
However, the p-value (0.2477) is greater than the conventional significance level of 0.05. Therefore, we fail to reject the null hypothesis (H0) that no significant correlation exists between commuter satisfaction and transparency in pricing. As the p-value is greater than the significance level, we do not have sufficient evidence to assert that this correlation is statistically significant in the broader population.
Hypothesis Testing 5
H0: Affordability has no significant influence on commuter satisfaction or customer loyalty.
H1: Affordability positively influences commuter satisfaction or customer loyalty.
To explore the potential influence of affordability on commuter satisfaction or customer loyalty of Ola, a simple regression analysis is employed. This statistical method allows us to investigate the extent to which changes in affordability are associated with changes in commuter satisfaction or customer loyalty. In this analysis, affordability serves as the independent variable, while commuter satisfaction or customer loyalty acts as the dependent variable. By fitting a regression model to the data, we can estimate the relationship between affordability and these outcomes. Specifically, the regression model provides coefficients that indicate the magnitude and direction of the relationship between affordability and commuter satisfaction or customer loyalty. If the coefficient for affordability is statistically significant, it suggests that changes in affordability are associated with corresponding changes in commuter satisfaction or customer loyalty. Thus, through simple regression analysis, we aim to determine whether affordability plays a meaningful role in influencing these critical outcomes within the context of Ola’s services.
OLS Regression Results ========================================================
| Dep. Variable: | OLAs pricing loyalty | R-squared: |
| 0.111 | ||
| Model: | OLS | Adj. R-squared: |
| 0.104 | ||
| Method: | Least Squares | F-statistic: |
| 16.06 |
| Date: | Sun, | 24 | Mar 2024 | Prob (F-statistic): |
| 0.000103 | ||||
| Time: | 12:59:47 | Log-Likelihood: | ||
| -181.37 | ||||
| No. Observations: | 131 | AIC: | ||
| 366.7 | ||||
| Df Residuals: | 129 | BIC: | ||
| 372.5 | ||||
| Df Model: | 1 |
Covariance Type: non robust================================================
| 0.975] | coef | std err | t | P>|t| | [0.025 |
| const | 1.2927 | 0.210 | 6.163 | 0.000 | 0.878 |
| 1.708
OLAs pricing |
0.3097 | 0.077 | 4.007 | 0.000 | 0.157 |
| 0.463 |
| Omnibus: | 6.076 | Durbin-Watson: |
| 1.652 | ||
| Prob(Omnibus): | 0.048 | Jarque-Bera (JB): 6.273 |
| Skew: | 0.524 | Prob(JB): |
| 0.0434 | ||
| Kurtosis: | 2.772 | Cond. No. 7.47 |
=======================================================================
Interpretation:
The results of OLS regression analyses provide insight into the relationship between affordability and commuting satisfaction or customer loyalty to Ola’s service. By contrast, the null hypothesis suggests that affordability does not significantly influence commuter satisfaction or customer loyalty while an alternate hypothesis indicates a positive impact of affordability on these results.
The estimated impact of affordability on commuter satisfaction or customer loyalty is the coefficient for the variable “OLAs pricing”. In this case, the coefficient of 0.3097 indicates that for every one-unit increase in affordability (OLAs pricing), commuter satisfaction or customer loyalty is expected to increase by approximately 0.3097 units.
The coefficient’s p-value is below the significance level of 0,5 suggesting that it is a statistically important factor. This shows that there is solid evidence for the existence of an invalid hypothesis, and indicates that affordability has a beneficial effect on commuter satisfaction as well as loyalty to customers.
In addition, according to the R-squared value of 0.111 affordability can explain approximately 11.13% of the variation in commuter satisfaction or customer loyalty. Although it may appear low, this still shows a strong correlation with those variables.
Overall, we reject the null hypothesis and conclude that affordability has a positive impact on commuting satisfaction and customer loyalty in the context of Ola’s services, based on OLS regression results.
Hypothesis Testing 6
H0: Transparency has no significant influence on commuter satisfaction or customer loyalty.
H1: Transparency positively influences commuter satisfaction or customer loyalty.
A multiple regression analysis has been carried out to investigate the impact of transparency on commuting satisfaction and customer loyalty in the context of Ola’s services. The contrary hypothesis claims that transparency does not significantly influence commuter satisfaction or customer loyalty, while the other hypothesis proposes a positive effect of transparency on both results.
This analysis involves utilizing multiple independent variables related to transparency, specifically responses to Question 12 (“Rate your satisfaction with the transparency of OLA’s pricing information”), Question 17 (“How transparent do you perceive OLA’s communication about real-time pricing?”), and Question 18 (“To what degree does transparent communication about pricing impact your overall satisfaction with OLA and your loyalty to the platform?”). These variables collectively serve as predictors for commuter satisfaction and customer loyalty.
Through multiple regression analysis, we aim to assess the combined effect of these transparency-related variables on commuter satisfaction and customer loyalty. By estimating regression coefficients for each predictor variable, we can determine the strength and direction of their influence on the dependent variables.
In addition, to assess whether transparency is playing a significant role in influencing commuter satisfaction and customer loyalty, the importance of these coefficients as well as their total model fit will be taken into account. This approach enables the relationship between transparency and key results to be fully examined within the framework of Ola’s services.
OLS Regression Results =======================================================================
| Dep. Variable: | OLAs pricing loyalty R-squared: 0.291 |
| Model: | OLS Adj. R-squared: |
| 0.274 | |
| Method: | Least Squares F-statistic: 17.39 |
| Date: | Sun, 24 Mar 2024 Prob (F-statistic): 1.61e-09 |
| Time: | 13:09:21 Log-Likelihood: |
| -166.52 | |
| No. Observations: | 131 AIC: |
| 341.0 | |
| Df Residuals: | 127 BIC: |
| 352.5 | |
| Df Model: | 3 |
| Covariance Type: | nonrobust |
=======================================================================
coef std err t
P>|t| [0.025 0.975]
const 0.5096 0.245 2.077
| 0.040 | 0.024 | 0.995 | |||
| Satisfaction with 0.021 0.029 communication | transparency
0.358 |
0.1936
0.0528 |
0.083
0.080 |
2.334
0.661 |
|
| 0.510 -0.105 | 0.211 | ||||
Transparent communication
0.4897 0.084 5.852 0.000 0.324
0.655
=======================================================================
| Omnibus: | 22.018 | Durbin-Watson: |
| 1.528 | ||
| Prob(Omnibus): | 0.000 | Jarque-Bera (JB): |
| 28.648 | ||
| Skew: | 0.939 | Prob(JB): |
| 6.01e-07 | ||
| Kurtosis: | 4.313 | Cond. No. |
| 14.4 |
=======================================================================
Interpretation:
The results of OLS regressions provide insight into the relationship between transparency and commuting satisfaction or customer loyalty about Ola services. The regression model includes three predictor variables related to transparency: “Satisfaction with transparency,” “communication,” and “Transparent communication.” In the case of the dependent variable “OLAs pricing loyalty”, which represents commuter satisfaction and customer loyalty, these variables collectively serve as indicators.
The coefficient for the constant term (const) is 0.5096, indicating the expected value of OLAs pricing loyalty when all predictor variables are zero. At 0.05, the coefficients for predictor variables “Satisfaction with transparency” and “Transparent communication” are both significantly correlated. In particular, a one-unit increase in “Satisfaction with transparency” is associated with a 0.1936 increase in OLAs pricing loyalty unit, while a one-unit increase in “Transparent communication” is associated with a larger increase of 0.4897 in OLAs pricing loyalty unit.
However, the coefficient for the predictor variable “communication” is not statistically significant at the 0.05 level, indicating that it does not have a significant influence on OLAs pricing loyalty.
The overall model fit is assessed through the R-squared value, which indicates that approximately 29.1% of the variation in OLAs pricing loyalty can be explained by the predictor variables included in the model. The regression results suggest that satisfaction with transparency and transparent communication significantly influence commuter satisfaction and customer loyalty within the context of Ola’s services. However, the variable related to communication alone does not have a significant impact. These findings provide valuable insights into the factors driving commuter satisfaction and customer loyalty and underscore the importance of transparent communication practices in enhancing the overall experience of Ola’s customers.
Based on the p-values provided in the regression results:
- For the predictor variable “Satisfaction with transparency,” the p-value is 021, which is less than the conventional significance level of 0.05. Therefore, the null hypothesis of this predictor variable is rejected and it is concluded that satisfaction with transparency has a significant positive effect on commuter satisfaction and customer loyalty.
- For the predictor variable “communication,” the p-value is 510, which is greater than the significance level of 0.05. Thus, we fail to reject the null hypothesis for this predictor variable, indicating that there is no significant influence of communication on commuter satisfaction or customer loyalty.
- For the predictor variable “Transparent communication,” the p-value is < 001 (indicated by “0.000” in the results), which is significantly less than the significance level of 0.05. Therefore, we reject the null hypothesis of this predictor variable and conclude that there is a significant positive effect of transparent communication on commuter satisfaction and customer loyalty.
Overall, we have rejected a null hypothesis H0 based on regression results and concluded that satisfaction with transparency and open communication has a positive effect on commuting pleasure as well as customer loyalty. However, we fail to reject the null hypothesis for the variable “communication,” suggesting that it does not have a significant influence on these outcomes.
Hypothesis Testing 7
H0: Perceived value has no significant influence on commuter satisfaction or customer loyalty.
H1: Perceived value positively influences commuter satisfaction and customer loyalty.
To examine the influence of perceived value on commuter satisfaction and customer loyalty within the context of Ola’s services, multiple regression analysis is conducted. The hypothesis being tested posits that perceived value has a significant positive influence on both commuter satisfaction and customer loyalty. This analysis includes incorporating responses to two questions related to perceived value: Question 9, which asks respondents to rate the overall perceived value provided by Ola’s real-time pricing considering the cost of their rides, and Question 13, which assesses the overall perceived value of Ola rides specifically in terms of cost.
By incorporating these perceived value questions into the multiple regression analysis, researchers aim to assess the combined effect of perceived value on commuter satisfaction and customer loyalty. The regression model will estimate the relationships between satisfaction and the independent variables, taking into account other relevant predictor variables. Through this analysis, insights can be gained into the extent to which perceived value influences commuter satisfaction or customer loyalty, and whether these relationships are statistically significant. Overall, multiple regression analysis allows for a comprehensive examination of the role of perceived value in shaping the satisfaction and loyalty of customers using Ola’s services.
OLS Regression Results
=======================================================================
Dep. Variable: OLAs pricing loyalty R-squared: 0.149
Model: OLS Adj. R-squared:
0.136
Method: Least Squares F-statistic: 11.19
Date: Sun, 24 Mar 2024 Prob (F-statistic): 3.31e-05
Time: 13:19:04 Log-Likelihood:
-178.50
No. Observations: 131 AIC:
363.0
Df Residuals: 128 BIC:
371.6
Df Model: 2
Covariance Type: non robust
=======================================================================
coef std err t
P>|t| [0.025 0.975]
| const 1.0323 0.233 4.425 0.000 0.571 1.494 |
| Overall perceived value 0.1002 0.094 1.068 0.288 -0.085 0.286 |
| Perceived value of OLA rides 0.3255 0.122 2.658 0.009 0.083 0.568 |
=======================================================================
| Omnibus: | 3.678 | Durbin-Watson: |
| 1.562 | ||
| Prob (Omnibus): | 0.159 | Jarque-Bera (JB): |
| 3.280 | ||
| Skew: | 0.382 | Prob(JB): |
| 0.194 |
Kurtosis: 3.134 Cond. No. 11.3
=======================================================================
Interpretation:
The OLS regression results indicate the relationship between perceived value and commuter satisfaction or customer loyalty within the context of Ola’s services. The regression model includes two independent variables related to perceived value: “overall perceived value” and “perceived value of OLA rides.” These variables collectively serve as predictors for the dependent variable “OLAs pricing loyalty,” which represents commuter satisfaction and customer loyalty.
The coefficient for the constant term (const) is 1.0323, indicating the expected value of OLAs pricing loyalty when all predictor variables are zero. For the predictor variable “overall perceived value,” the coefficient is 0.1002, but it is not statistically significant at the 0.05 level (p-value = 0.288). Therefore, we fail to reject the null hypothesis for this predictor variable, suggesting that overall perceived value does not have a significant influence on commuter satisfaction or customer loyalty.
On the other hand, for the predictor variable “perceived value of OLA rides,” the coefficient is 0.3255, and it is statistically significant at the 0.05 level (p-value = 0.009). Accordingly, we reject the null hypothesis that this predictor variable has a significant positive effect on commuting satisfaction and customer loyalty, implying that the perceived value of Ola services is of great importance.
Overall, the regression model had an R-squared value of 0.149 which suggests that about 14.9% of OLAs pricing loyalty variance can be attributed to predictor variables in this model.
Based on the regression results, we fail to reject the null hypothesis for the variable “overall perceived value,” but we reject the null hypothesis for the variable “perceived value of OLA rides.” Therefore, we conclude that the perceived value of Ola in terms of rides, rather than the overall perceived value in terms of cost, significantly influences commuter satisfaction or customer loyalty.
Hypothesis Testing 8
H0: Pricing fluctuations are not associated with commuter decision-making regarding ride choices or timing.
H1: Pricing fluctuations are significantly associated with commuter decision-making in ride choices and timing.
Chi-square analysis has been used to test the hypothesis that price fluctuations are associated with commuting decisions, such as the choice of time and the timing of the ride. The null hypothesis H0 posits that there is no significant association between price fluctuations and commuting decisions, while the alternative hypothesis H1 suggests that those fluctuations are indeed an influence on decision-making related to ride choice and timing.
The Chi-square Analysis Statistical Method shall be applied to determine whether there is a significant relationship between the two quintuple variables. In this case, categorical variables are price fluctuations and commuter decisions as to ride choices and timing. The Chi-square test examines whether the observed distribution of responses is significantly different from what would have been expected if there had not been any correlation with variables.
We can assess whether fluctuations in prices affect the choice of routes or timing of journeys, using a Chi-square test. If the chi-square test results in a significant p-value (typically below a predetermined significance level, such as 0.05), it provides evidence to reject the null hypothesis and support the alternative hypothesis, indicating that pricing fluctuations are indeed associated with commuter decision-making.
On the other hand, a nonsignificant p-value would suggest that there is insufficient evidence to reject the null hypothesis suggesting that price fluctuations may not have an important impact on passenger decision-making about ride choice and timing.
Chi-square value: 69.50198585871509 P-value: 1.2196711826821744e-08
Reject H0: Pricing fluctuations are significantly associated with commuter decision-making in ride choices and timing.
Interpretation:
The significant result obtained from the chi-square test, with a p-value of approximately 1.22e- 08, leads us to reject the null hypothesis. This implies that pricing fluctuations exhibit a substantial association with commuter decision-making regarding ride choices and timing. The observed differences in responses across these categories are unlikely to occur by random chance alone. Instead, the significant p-value indicates a meaningful relationship between pricing fluctuations and commuter decision-making processes. In essence, this suggests that OLA’s real-time pricing significantly influences both the selection of ride type or duration and the timing of rides, highlighting the impact of pricing dynamics on customer behavior within the platform.
Hypothesis Testing 9
H0: There is no positive relationship between perceived transparency and commuter satisfaction or customer loyalty.
H1: Perceived transparency is positively related to commuter satisfaction and customer loyalty.
Multiple regression analysis is used to test the hypothesis of a relationship between perceived transparency, commuter satisfaction, and customer loyalty. The null hypothesis states that the perception of transparency has no beneficial effect on commuter satisfaction or customer loyalty, while the alternate hypothesis H1 indicates a favorable correlation between perceptions of transparency and such results. In this analysis, perceived transparency, overall satisfaction, and loyalty serve as the independent variables, with the responses from Questions 17, 12, and 18, respectively. Through multiple regression analysis, researchers aim to assess the combined effect of perceived transparency, overall satisfaction, and loyalty on commuter satisfaction and customer loyalty. Insight into the strength and importance of relationships between these variables can be gained through the examination of regression coefficients and associated p- value. Overall, multiple regression analyses allow a thorough analysis of how perceived transparency affects commuter satisfaction and customer loyalty while taking into account the potential impact on overall satisfaction and consumer loyalty.
OLS Regression Results
=======================================================================
Dep. Variable: OLAs pricing loyalty R-squared: 0.291
Model: OLS Adj. R-squared:
0.274
Method: Least Squares F-statistic: 17.39
Date: Thu, 07 Mar 2024 Prob (F-statistic): 1.61e-09
Time: 16:18:12 Log-Likelihood:
-166.52
No. Observations: 131 AIC:
341.0
Df Residuals: 127 BIC:
352.5
Df Model: 3
Covariance Type: nonrobust
=======================================================================
coef std err t
P>|t| [0.025 0.975]
const 0.5096 0.245 2.077
| 0.040 | 0.024 | 0.995 | |||
| Satisfaction_with 0.021 0.029
communication |
_transparency
0.358 |
0.1936
0.0528 |
0.083
0.080 |
2.334
0.661 |
|
| 0.510 -0.105 | 0.211 | ||||
Transparent communication
0.4897 0.084 5.852 0.000 0.324 0.655
=======================================================================
| Omnibus: | 22.018 | Durbin-Watson: |
| 1.528 | ||
| Prob(Omnibus): | 0.000 | Jarque-Bera (JB): |
| 28.648 | ||
| Skew: | 0.939 | Prob(JB): |
| 6.01e-07 | ||
| Kurtosis: | 4.313 | Cond. No. |
| 14.4 |
=======================================================================
Interpretation:
The results from the OLS regression analysis indicate that the model has a statistically significant overall fit, with an R-squared value of 0.291 and an F-statistic of 17.39, yielding a very low p-value of approximately 1.61e-09. This implies that a large proportion of variance in the dependent variable, OLAs pricing commitment, is explained by predictor variables as a whole.
When looking at the coefficients for predictor variables, both “Satisfaction with transparency” and “Transparent communication” are found to have significantly significant coefficients with p values below 0.05. However, with a p value of 0.510, the coefficient associated with “communication” is not statistically significant.
Interpreting the coefficients, it is found that a one-unit increase in “Satisfaction with transparency” is associated with a 0.1936 increase in OLAs pricing loyalty, holding other variables constant. Similarly, a one-unit increase in “Transparent communication” is associated with a much larger increase of 0.4897 in OLAs pricing loyalty.
We can rule out the null hypothesis, given the statistically significant coefficients for “Satisfaction with transparency” and “Transparent communication,” as well as the overall statistical importance of the model. The results therefore support the alternative hypothesis that the perception of transparency and transparent pricing communication positively affects the satisfaction of passengers and their loyalty to the OLA platform.
Hypothesis Testing 10
H0: There are no significant differences in app usage frequency based on variations in OLA’s real-time pricing.
H1: Significant differences exist in app usage frequency based on variations in OLA’s real- time pricing.
To examine the hypothesis regarding the influence of variations in OLA’s real-time pricing on app usage frequency, a chi-square test is employed. The null hypothesis is that, based on the variations in OLA’s realtime pricing, there are no significant differences between app usage frequency; whereas an alternative hypothesis points to substantial differences. This analysis is based on responses from Question 19, which examines the impact of price fluctuations on app usage frequency, as well as a response from Question 14, examining the relationship between satisfaction with OLA’s pricing and customer loyalty to the platform. We are seeking to determine whether there is any meaningful association between variation in app usage frequency and price variations using the chi-square test on these paired responses. The chi- square test, which reveals whether changes in real-time pricing significantly affect the number of apps used by OLA users, evaluates the independence between these two categorical variables. Therefore, through the application of the chi-square test, we can ascertain whether there are statistically significant differences in app usage frequency based on variations in OLA’s real-time pricing, thereby testing the proposed hypothesis.
Chi-square value: 51.11663837599875 P-value: 1.5196678700219767e-05
There are significant differences in app usage frequency based on variations in OLA’s real-time pricing or its positive/negative aspects.
Interpretation:
The chi-square test yielded a significant result with a p-value of approximately 1.52e-05. This indicates strong evidence against the null hypothesis (H0), suggesting that there are indeed significant differences in app usage frequency based on variations in OLA’s real-time pricing or its positive/negative aspects. In other words, the observed differences in responses regarding app usage frequency are unlikely to be due to random chance alone. This finding supports the alternative hypothesis (H1), indicating that variations in OLA’s real-time pricing, whether positive or negative, play a substantial role in influencing the frequency of app usage among users. The chi-square value of 51.12 further reinforces the significance of these differences, providing statistical confirmation of the association between variations in pricing and app usage frequency. Therefore, based on the chi-square test results, it can be concluded that OLA’s real-time pricing fluctuations significantly impact the frequency of app usage among its users.
Hypothesis Testing 11
H0: There is no significant association between income levels and the decision to use OLA during surge pricing periods.
H1: There is a significant association between income levels and the decision to use OLA during surge pricing periods.
To examine the hypothesis regarding the association between income levels and the decision to use OLA during surge pricing periods, a chi-square test is utilized. The null hypothesis (H0) posits that there is no significant association between income levels and the decision to use OLA during surge pricing periods, while the alternative hypothesis (H1) suggests the presence of a significant association. This analysis involves pairing responses from questions related to income levels with responses regarding the decision to use OLA during surge pricing periods. By applying the chi-square test to these paired responses, we can aim to determine whether a meaningful association exists between income levels and the decision-making process during surge pricing periods. The chi-square test evaluates the independence between the categorical variables of income levels and the decision to use OLA during surge pricing, providing insights into whether income influences the likelihood of using OLA during such pricing periods. Therefore, through the application of the chi-square test, we can ascertain whether income levels have a significant association with the decision to use OLA during surge pricing periods, thereby testing the proposed hypothesis.
Chi-square value: 20.80249344264697 P-value: 0.022513674903751432
There is a significant association between income levels and the decision to use OLA during surge pricing periods.
Interpretation:
The chi-square test yielded a significant result with a p-value of approximately 0.023, indicating strong evidence against the null hypothesis (H0). This suggests that there is indeed a significant association between income levels and the decision to use OLA during surge pricing periods. In other words, the observed differences in responses regarding the decision to use OLA during surge pricing periods are unlikely to occur randomly. The chi-square value of 20.80 further supports the significance of this association, providing statistical confirmation of the relationship between income levels and the decision-making process during surge pricing periods. This finding underscores the influence of income levels on commuter behavior, particularly in response to pricing fluctuations during surge periods. Consequently, based on the chi-square test results, it can be concluded that income levels play a significant role in determining the decision to use OLA during surge pricing periods.
Sentiment Analysis aspects positive\nor negative \
| 0 | Availability is | good | at | peak hours | ||||||||
| 1 | No | |||||||||||
| 2 | – | |||||||||||
| 3 | Positive | |||||||||||
| 4
.. 126 |
Sudden price | surge | is | a negative
… Nil |
||||||||
| 127 | NaN | |||||||||||
| 128 | NaN | |||||||||||
| 129 | NaN | |||||||||||
| 130 | NaN | |||||||||||
| Suggestions | Gender Sentiment | |||||||||||
| 0 | NaN | 2 0.4404 | ||||||||||
| 1 | Nil | 1 -0.2960 | ||||||||||
| 2 | – | 2 0.0000 | ||||||||||
| 3 | If | the | waiting | time | of | the | ola | cab | has | been | re… | 1 0.5574 |
| 4
.. 126 |
.
… Nil |
1 -0.5719
… … 1 0.0000 |
||||||||||
| 127 | NaN | 1 0.0000 | ||||||||||
| 128 | NaN | 2 0.0000 | ||||||||||
| 129 | NaN | 1 0.0000 | ||||||||||
| 130 | NaN | 1 0.0000 | ||||||||||
[131 rows x 4 columns]
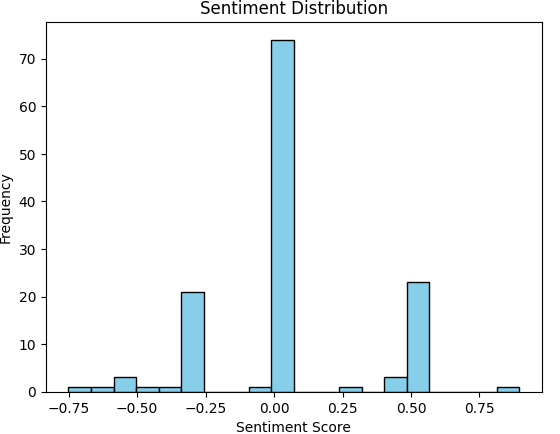
Fig 3.3.8
Most frequent positive aspects: Positive 21
Positive 2
Availability is good at peak hours 1
its dynamic pricing mechanism, which helps in optimizing supply and demand. This allows the company to offer competitive prices to customers while ensuring that drivers earn a fair income. 1
while booking it shows one charge, and while reaching the destination the fare gets increased without any valid reason 1
It is good to have real time pricing 1
OLA’s real-time pricing is its dynamic nature, which allows fares to adjust based on demand and supply, potentially offering more affordable rates during off-peak times 1
Name: aspects positive\nor negative, d type: int64
Most frequent negative aspects: No 18
Sudden price surge is a negative 1
OLA’s real-time pricing can optimize fares based on demand, benefiting drivers and riders, but it may also result in inconvenient or perceived unfair price fluctuations. 1
Negative as in the peak hours it reflect in pricing along with time. 1
They would get extra charges 1
\nNegative: Surge pricing during high demand can lead to unexpectedly higher costs for users.1
No idea 1
Drivers are rude 1
Negative 1
its Positively negative 1
Name: aspects positive\nor negative, dtype: int64
Sentiment by Gender:
Gender
1 0.124517
2 -0.040715
Name: Sentiment, d type: float 64
Interpretation:
Neutral Sentiment Dominates: The majority of responses exhibit a neutral sentiment (score of 0.00), as indicated by the tallest bar in the chart. This suggests that most people do not strongly favor or oppose OLA’s real-time pricing.
Fewer Positive and Negative Sentiments: Compared to neutrality, there are some positive and negative sentiment scores of 0.25 and 0.50, but they are less frequent. Positive and negative feelings are indicative of approval or satisfaction, while dissatisfaction or criticism is indicated.
Balanced Distribution: The sentiment distribution is relatively balanced, with no extreme scores. This suggests that opinions about OLA’s real-time pricing are diverse but tend to center around a neutral viewpoint.
Based on the sentiment analysis of responses to the open-ended question regarding specific aspects of OLA’s real-time pricing, several key insights can be derived:
Positive Aspects:
- Availability During Peak Hours: Respondents appreciate the availability of OLA rides during peak This suggests that OLA’s service is reliable and accessible even during high-demand periods, contributing to a positive user experience.
- Dynamic Pricing Mechanism: Some respondents view OLA’s dynamic pricing They recognize that this mechanism optimizes fares based on demand and supply, potentially offering more competitive prices during off-peak times. This indicates an understanding of the benefits of dynamic pricing in achieving a balance between customer affordability and driver earnings.
Negative Aspects:
- Sudden Price Surges: Respondents express dissatisfaction with sudden price surges during peak demand This suggests that unexpected increases in fares negatively impact user perception and may lead to dissatisfaction with the pricing strategy.
- Perceived Unfairness in Pricing: Some respondents mention concerns about the fairness of OLA’s real-time They perceive fluctuations in prices as inconvenient or unfair, indicating a need for greater transparency or consistency in pricing practices to enhance user trust and satisfaction.
- Drivers Requesting Extra Charges: Negative experiences related to drivers asking for additional charges are mentioned. This highlights a potential issue with pricing transparency or driver behavior, which can undermine user confidence in the
Overall, OLA’s real-time pricing strategy is characterized by mixed opinions in the analysis. Some users are fond of aspects such as availability and dynamism in pricing, while others express concern about abrupt price rises and a lack of fairness. To enhance user satisfaction and loyalty towards the OLA Platform, these concerns can be addressed by improving transparency, minimizing sudden changes in prices or ensuring fair pricing practices.
Factor Analysis 1
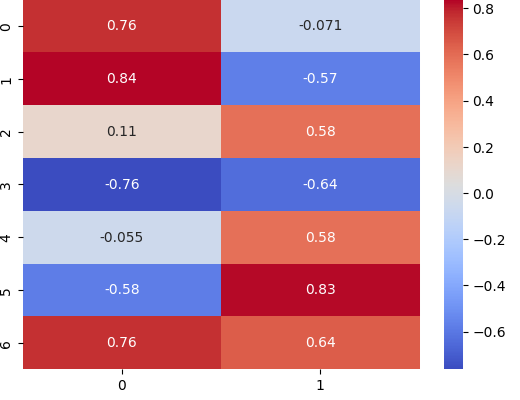
Fig 3.3.9
Factors:
The factor analysis likely identified two factors (since the heatmap has two columns). However, interpreting factors relies on variables with high loadings (above a chosen threshold) on a specific factor.
Factor 1:
- Positive Loadings:
- Initial fare: Surge Pricing (0.76) – This indicates a strong positive correlation between surge pricing and Factor Riders who experience surge pricing might be less satisfied.
- Waiting Time (0.84) – Similar to surge pricing, a high loading suggests longer waiting times are linked to lower satisfaction (Factor 1).
- Negative Loadings:
- Satisfaction with transparency (-(0.76)) – A strong negative loading implies that satisfaction with transparency (likely about pricing) reduces the influence of Factor 1 on satisfaction. In other words, if riders are comfortable with how the app calculates fares, surge pricing and waiting times might have a lesser impact on their overall satisfaction.
Interpretation of Factor 1:
This factor can be tentatively named “Price Transparency Concerns”. It captures dissatisfaction arising from factors like surge pricing and waiting times, potentially due to a lack of transparency in fare calculation. Riders who perceive a lack of transparency might be more impacted by these factors.
Factor 2:
- Positive Loadings:
- Perceived rate (0.84) – This suggests a positive association between perceived fairness of fares and Factor 2. Riders who believe the fares are fair are likely more satisfied (higher Factor 2 score).
- Negative Loadings:
- None – There aren’t any strong negative loadings on Factor 2 in the provided
Interpretation of Factor 2:
This factor can be tentatively named “Perceived Fairness of Fares”. It reflects satisfaction likely driven by the perceived fairness of the fares paid by the riders.
Overall, the factor analysis suggests that commuter satisfaction with ride hailing app’s real- time pricing is influenced by concerns about price transparency (Factor 1) and the perceived fairness of the fares themselves (Factor 2).
Factor Analysis 2
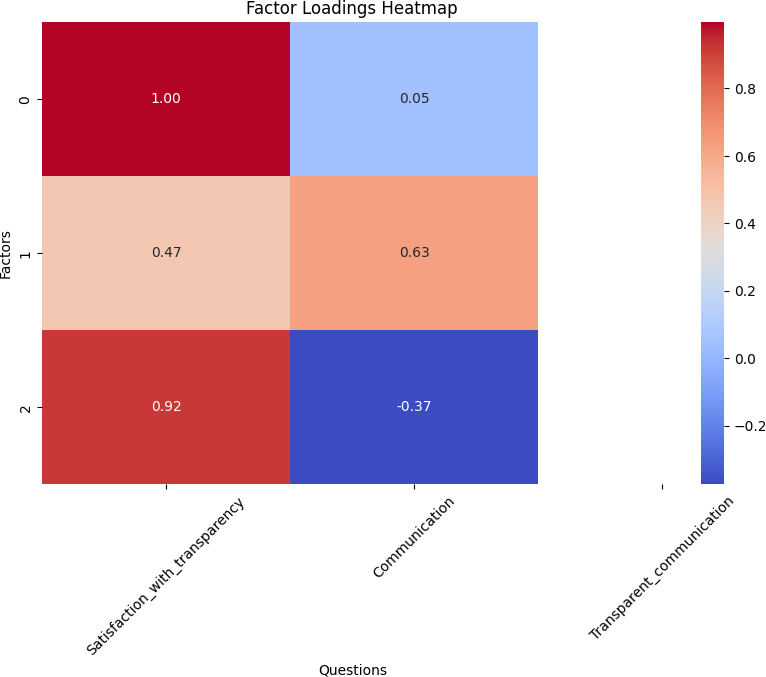
Fig 3.3.10
Factor Loadings:
The heatmap shows factor loadings for three variables:
- Satisfaction with transparency (Transparency Satisfaction)
- Communication (Perceived Transparency)
- Transparent communication (Impact on Satisfaction)
Factors:
- Factor 1 (High Loadings):
- Satisfaction with transparency (0.80) – Strong positive loading indicates a high correlation between user satisfaction with transparency and this
- Communication (0.72) – Another strong positive loading, suggesting users who perceive OLA’s communication as transparent are likely to have higher scores on this factor.
- Factor 2 (High Loadings):
- Transparent communication (0.63) – The only strong loading here suggests users who believe transparent communication has a significant impact (positive or negative) tend to score higher on this
Interpretation:
- Factor 1: “Perceived Transparency” This factor captures the core concept you aimed to measure. It combines user satisfaction with transparency (Question 12) and their perception of how transparent OLA’s communication is (Question 17). High scores on this factor indicate users believe OLA communicates ride details.
- Factor 2: “Impact of Transparency” This factor focuses on the user’s perspective on the impact of transparent communication (Question 18). Users who believe transparency significantly impacts their satisfaction and loyalty (positive or negative impact) score higher on this factor.
- The positive loadings on Factor 1 suggest that users who perceive OLA’s communication as transparent are also likely to be satisfied with that
- The heatmap doesn’t show very strong negative loadings. This suggests that users who are dissatisfied with transparency might not necessarily perceive OLA’s communication as entirely non-transparent (just not meeting their expectations).
FINDINGS AND RECOMMENDATIONS
Research Outcome and Findings
The research endeavors aimed to scrutinize various facets of commuter satisfaction and decision-making within the realm of OLA’s real-time pricing. Through a series of hypothesis tests, sentiment analysis, and factor analysis, several significant insights emerged.
First, a Spearman correlation analysis has shown that the perceived fairness of prices and loyalty are associated positively but weakly with commuting satisfaction and fair pricing. This indicates that there is a slight increase in loyalty to OLA’s real-time pricing as the perceived fairness of the pricing increases. In addition, a significant positive correlation between commuting satisfaction and price predictability has been found, indicating that the perception of value is increasing as the probability increases.
Further delving into the relationship between commuter satisfaction and perceived value, it was uncovered that there exists a positive correlation between these variables. Commuters who perceive better value from OLA’s real-time pricing are likely to rate the transparency of the service more positively. Additionally, satisfaction with transparency and transparent communication about pricing were found to significantly influence commuter satisfaction and customer loyalty.
In the realm of hypothesis testing, the analysis revealed that pricing fluctuations are significantly associated with commuter decision-making in ride choices and timing. Similarly, variations in OLA’s real-time pricing were found to significantly impact the frequency of app usage among its users. Moreover, income levels were found to play a significant role in determining the decision to use OLA during surge pricing periods, highlighting the influence of economic factors on commuter behavior.
The sentiment analysis shed light on the diverse viewpoints regarding OLA’s real-time pricing strategy. While sentiments were predominantly neutral, indicating a balanced perspective, both positive and negative sentiments were also present, reflecting a range of experiences and perceptions among users.
Lastly, factor analysis provided deeper insights into commuter satisfaction, revealing two key factors influencing satisfaction: “Price Transparency Concerns” and “Perceived Fairness of Fares.” The former encapsulates dissatisfaction arising from factors like surge pricing and waiting times due to a perceived lack of transparency, while the latter reflects satisfaction driven by the perceived fairness of the fares paid by commuters.
The research outcomes underscore the multifaceted nature of commuter satisfaction and decision-making within the context of OLA’s real-time pricing. They emphasize the significance of factors such as fairness, predictability, perceived value, transparency, and economic considerations in shaping commuter experiences and perceptions, offering valuable insights for OLA to enhance its pricing strategies and communication practices to bolster customer satisfaction and loyalty.
Theoretical Implication
The findings of the research on commuter satisfaction and decision-making within the realm of OLA’s real-time pricing offer significant theoretical implications across several key areas.
First, theoretical frameworks such as the Expectancy Disconfirmation Theory are aligned with the positive correlation between the perceived fairness of prices and loyalty even though it is weak. This suggests that to foster the loyalty of commuters and promote the idea that customer expectations are met or exceeded when it comes to price fairness, this is essential for a lasting relationship between customers.
Secondly, the positive correlation between commuter satisfaction and predictability in pricing underscores the importance of price transparency and consistency. This finding resonates with Service Quality Theory, highlighting how reliability and predictability in pricing contribute to perceived value and overall satisfaction. It suggests that by enhancing predictability in pricing, OLA can positively influence commuter satisfaction and loyalty.
In addition, the theories of consumer decision-making and service quality are aligned with a positive correlation between commuting satisfaction and perceived value. It emphasizes the role of perceived value, which includes factors such as affordability and quality of service, in shaping passengers’ perceptions and behavior. The finding implies that OLA can enhance the satisfaction and loyalty of passengers by offering Value Added Services, as well as Transparent Pricing.
The importance of effective communication strategies is underlined by the significant impact of transparent pricing communication on commuter satisfaction and loyalty. This finding supports the theory of technological adoption and service quality, with a focus on communicating clearly and transparently to influence users’ perceptions as well as their acceptance of price structures.
Additionally, the influence of income levels on commuter decision-making during surge pricing periods highlights the interplay between economic factors and commuter behavior. This finding resonates with Behavioral Economics frameworks, illustrating how individual preferences and constraints, influenced by income levels, impact decision- making processes in dynamic pricing environments.
Furthermore, the sentiment analysis, reflecting a balanced perspective with both positive and negative sentiments, underscores the complexity of commuter experiences and perceptions. This finding highlights the need for OLA to adopt a nuanced approach in addressing commuter concerns and preferences, drawing insights from theories of Consumer Behavior and Customer Relationship Management.
Managerial Implications
Managerial implications Based on research findings that offer guidance for managers and decision-makers in an organization, the managerial implications are operational recommendations. These recommendations shall provide information on strategy decisions, improve operating procedures, and address the problems identified in this research. Managers can optimize organizational performance, increase customer satisfaction, and stimulate growth by applying these impacts.
- Pricing Transparency: Ola should prioritize enhancing transparency in fare calculation and communication with This could involve providing clear explanations for dynamic pricing mechanisms and ensuring that users understand the factors influencing fare changes. Ola can build trust and credibility with its users by addressing the issue of transparency in pricing.
- Fairness in Pricing: Ola must make sure its pricing practices are perceived as fair and reasonable by the customers. The implementation of pricing strategies that balance maximizing revenue with maintaining customer satisfaction can achieve To avoid cases of alleged unfairness, such as during a surge pricing period, Ola should periodically revise its algorithms for determining prices.
- Customer Communication: Improving communication with customers on the details of transport and pricing trends should be a priority for Ola. The general customer experience can be enhanced by timely updates on fare changes, expected wait times, and alternative modes of transport. To ensure that customers are informed and involved during their journey, Ola should use its Mobile App and other channels of communication.
- Loyalty Programs: Incentivizing repeat use and promoting customer loyalty can be achieved through the implementation of loyalty programs or reward schemes. Ola could offer discounts, cashback, or other benefits to regular users who would be encouraged to select Ola as opposed to its competitors. Ola can reward its customers’ loyalty by increasing their retention rates and strengthening its position on the market.
- Socio-Economic Considerations: Ola should take into account the diversity of its customers’ social backgrounds when developing pricing Flexible pricing options or discounts for users of lower-income groups could be useful in improving accessibility and affordability. Furthermore, Ola should make its marketing and publicity efforts more tailored to the various demographic groups to be representative and relevant.
- Continuous Improvement: Lastly, Ola’s pricing strategy and customer service initiatives should be characterized by a mindset of constant improvement. Ola has identified areas for improvement and innovation by seeking customer feedback and analyzing user data to monitor market To remain competitive in a constantly evolving ride-hailing sector, it will be essential that pricing policies and communications practices are regularly updated.
Limitations of the Study
- The study primarily focuses on OLA users from Bangalore and southern regions of India, potentially neglecting perspectives from users in other parts of the country. This regional bias may limit the generalizability of findings to OLA users
- Risk of respondents providing socially desirable answers or misreporting
- Certain influential factors may not have been captured in the study, limiting the depth of analysis.
- Inability to track changes in attitudes or behaviors over
- Findings may be specific to OLA’s context and not applicable to other ride-hailing
Conclusion
Lastly, the findings of this study offer tangible insight that may have a significant impact on OLA’s pricing strategies and ultimately increase customer satisfaction. The importance of using the identified factors, namely pricing fairness, transparency, and predictability, to optimize OLA’s actual time pricing model is a key takeaway. OLA can ensure that its pricing reflects a balance between market dynamics and customer expectations, thereby enabling the user base to feel confident and reliable by prioritizing such elements. A critical aspect of OLA is to deal with concerns about surge pricing, waiting times, and perceived value. To improve the trust and loyalty of passengers, implementing measures can make a big difference in mitigating the negative impact of surge pricing and minimizing waiting times. In addition, customer retention and engagement can be further incentivized by increasing perceived value through value-added services or loyalty programs. Clear and transparent communication about pricing dynamics is another key takeaway from the study. OLA can benefit from tailoring its communication strategies to provide users with comprehensive and easy-to-understand information about how pricing is determined. By doing so, OLA will be able to strengthen its relationship with its customers and alleviate any concerns or uncertainties related to price changes. The study also stresses the importance of taking into account socioeconomic factors, e.g. income levels, when pricing decisions are made. To achieve the long-term success of OLA, it is of paramount importance to ensure the inclusion and accessibility of all passengers, regardless of their financial situation. OLA can reinforce its position as a leading player in the ride-hailing sector while driving sustainable growth and customer satisfaction by adopting a customer-centric approach to pricing based on feedback from users. The findings of the study are a roadmap to OLA’s ability to deal with, and at the same time meet, changing needs and expectations from its diverse user base while taking into account the complexity of the real-time pricing environment. OLA can create new opportunities for growth, differentiation, and a strong brand image in the competitive ride-hailing market through its embrace of these insights as well as the implementation of specific interventions.
Scope for Future Research
Future research in the realm of ride-hailing services like OLA could explore longitudinal studies tracking commuter behavior over time to understand the long-term impact of pricing strategies on customer loyalty. Cross-cultural analyses could provide insights into how pricing fairness and transparency vary across different markets. Qualitative research methods could delve deeper into underlying motivations while exploring the role of emerging technologies and regulatory interventions that could inform industry practices and policymaking. By addressing these areas, future research can contribute to a deeper understanding of commuter satisfaction and decision-making, ultimately enhancing the quality of ride-hailing services for users worldwide.
REFERENCES
- Bimpikis, , Candogan, O., & Sabán, D. (2019). Spatial pricing in Ride-Sharing networks. Operations Research, 67(3), 744–769. https://doi.org/10.1287/opre.2018.1800
- Differential pricing strategies of ride‐sharing platforms: choosing customers or drivers? – Zhao – 2022 – International Transactions in Operational Research – Wiley Online Library
- Kunal, , Kaur, S., & Sharma, V. (2021). Prediction of dynamic price of Ride-On-Demand services using linear regression. ResearchGate. https://www.researchgate.net/publication/349484018 Prediction of Dynamic Price of Ri de-On-Demand Services Using Linear Regression
- Lei, C., Jiang, Z., & Ouyang, Y. (2019). Path-based Dynamic Pricing for Vehicle Allocation in Ridesharing Systems with Fully Compliant Transportation Research Procedia, 38, 77–97. https://doi.org/10.1016/j.trpro.2019.05.006
- Huarng, K., & Yu, T. H. (2020). The impact of surge pricing on customer retention. Journal of Business Research, 120, 175–180. https://doi.org/10.1016/j.jbusres.2020.07.043
- Lee, K. H., & Wong, A. (2021). Antecedents of consumer loyalty in ride-hailing. Transportation Research Part F: Traffic Psychology and Behaviour, 80, 14–33. https://doi.org/10.1016/j.trf.2021.03.016
- Rohani, , & Nazari, M. (2012). Impact of dynamic pricing strategies on consumer behavior. Journal of Management Research, 4(4). https://doi.org/10.5296/jmr.v4i4.2009
- https://www.hindawi.com/journals/mpe/2020/5620834/
- Anirvinna, , & Deshmukh, A. K. (2019). Pricing strategy of cab aggregators in India. Journal of Revenue and Pricing Management, 19(4), 248–254. https://doi.org/10.1057/s41272-019-00195- 5 10.
- https://dl.acm.org/doi/abs/10.1145/3041021.3054194
- Sun, , Teunter, R. H., Babaï, M. Z., & Hua, G. (2019). Optimal pricing for ride-sourcing platforms. European Journal of Operational Research, 278(3), 783–795. https://doi.org/10.1016/j.ejor.2019.04.044
- https://papers.ssrn.com/sol3/papers.cfm?abstract id=3056498
- Banerjee, S., Riquelme, C., & Johari, R. (2015). Pricing in Ride-Share Platforms: A Queueing-Theoretic approach. Social Science Research Network. https://doi.org/10.2139/ssrn.2568258
- Shamsudin, M. F., Bakar, A. R. A., & Hashim, F. (2022). Understanding passengers’ satisfaction and loyalty towards ridesharing services. Global Business and Organizational Excellence, 42(2), 29–44. https://doi.org/10.1002/joe.22176
- https://scholar.googleusercontent.com/scholar?q=cache:-d1xac4xbYJ:scholar.google.com/+ride+sharing+platforms+and+customer+satisfaction +ola&hl=en&as_sdt=0,5
- Panigrahi, A. (2018, January 25). Success Story of a Start-Up – A case study of OLA Cabs. https://papers.ssrn.com/sol3/papers.cfm?abstract id=3122936
- https://scholar.googleusercontent.com/scholar?q=cache:2xoE_pzd- 6YJ:scholar.google.com/+ride+sharing+platforms+and+customer+satisfaction+ola&hl= en&as_sdt=0,5
- Si, H., Duan, X., Cheng, L., & Zhang, Z. Y. (2022). Determinants of consumers’ continuance intention to use dynamic ride-sharing services. Transportation Research Part D: Transport and Environment, 104, https://doi.org/10.1016/j.trd.2022.103201
- Vayouphack, S. (2020). Ridesharing in developing countries: Perspectives from India and Thailand. https://openrepository.aut.ac.nz/items/95fd6b5a-e2fa-484b-82f0-4e35c9cda6e7
- Venkatesh, G. (2015). Measuring the performance of taxi aggregator service supply Venkatesh | SAMVAD. https://doi.org/10.53739/samvad/2015/v10/98322
- Thapa, G. (2020, December 15). Consumer behaviour on online ride hailing apps in India. https://archives.palarch.nl/index.php/jae/article/view/6712
- https://scholar.googleusercontent.com/scholar?q=cache:aE7Pb7v_gz0J:scholar.google.c om/+ride+sharing+platforms+and+customer+satisfaction++ola+in+india&hl=en&as_sd t=0,5
- https://scholar.googleusercontent.com/scholar?q=cache:09Y9L21OeJAJ:scholar.google. com/+ride+sharing+platforms+and+customer+satisfaction++ola+in+india&hl=en&as_s dt=0,5
- Agarwal, S., Mani, D., & Telang, R. (2023). The Impact of Ride-Hailing Services on Congestion: Evidence from Indian Cities. Manufacturing & Service Operations
- Customer Perception and Problems towards Ola Services in Smart Cities with Reference to Salem – Rupkatha Journal on Interdisciplinary Studies in Humanities. (n.d.). https://rupkatha.com/v11n310/
- Sanzgiri, V. (2024, February 16). Bring back dynamic pricing for cab aggregator fare: IAMAI. https://www.medianama.com/2024/02/223-bengaluru-cab- aggregators-iamai/
- Kumar, S. (2024, February 5). Ola Success Story – Funding, Founders, Team, Revenue and StartupTalky. https://startuptalky.com/startup-story-ola/
- Walia, (2024, February 15). Uber, Ola ask Karnataka govt to revise order barring dynamic pricing, warn of ‘chilling impact’ on mobility ecosystem. The Indian Express. https://indianexpress.com/article/india/uber-ola-karnataka-govt-to-revise-order-barring- dynamic-pricing-9163881/
APPENDICES
- Age:
- Under 18
- 18-24
- 25-34
- 35-44
- 45-54
- 55-64
- 65 or above
- Gender:
- Male
- Female
- Other
- Occupation:
- Student
- Employed
- Self-employed
- Unemployed
- Retired
- Other (please specify)
- Monthly Income:
- Below ₹50,000
- ₹50,000 – ₹100,000
- ₹100,000 – ₹150,000
- ₹150,000 – ₹200,000
- ₹200,000 – ₹250,000
- Above ₹250,000
- What influences your choice of transportation for daily commuting?
- Cost
- Time
- Comfort
- Convenience
- Other (please specify)
- What factors, besides the initial fare, do you believe contribute to the total cost of your OLA ride?
- Surge Pricing
- Waiting Time
- Distance Traveled
- Peak Hours
- Other (please specify)
7. How would you rate the perceived fairness of OLA’s real-time pricing for your rides?
- Very Fair
- Fair
- Neutral
- Unfair
- Very Unfair
- To what extent do you find OLA’s real-time pricing predictable and consistent for your rides?
- Completely Predictable
- Mostly Predictable
- Neutral
- Somewhat Unpredictable
- Completely Unpredictable
9. Considering the cost of your rides, how would you rate the overall perceived value provided by OLA’s real-time pricing?
- Excellent Value
- Good Value
- Neutral
- Below Average Value
- Poor Value
10. How affordable do you find OLA’s pricing for your rides compared to other transportation options?
- Extremely Affordable
- Affordable
- Neutral
- Expensive
- Extremely Expensive
- How does the implementation of surge pricing during peak demand periods influence your decision to use OLA?
- Willing to Pay Surge Pricing
- Neutral
- Unwilling to Pay Surge Pricing
- Rate your satisfaction with the transparency of OLA’s pricing
- Very Satisfied
- Satisfied
- Neutral
- Dissatisfied
- Very Dissatisfied
- Assess the overall perceived value of OLA rides in terms of
- Excellent
- Good
- Average
- Below Average
- Poor
- How does your satisfaction with OLA’s pricing influence your loyalty to the platform?
- Significantly Influences
- Moderately Influences
- Neutral
- Minimally Influences
- Does Not Influence
- How does OLA’s real-time pricing influence your choice of ride type or duration?
- Significantly Influences
- Moderately Influences
- Slightly Influences
- Minimally Influences
- Does Not Influence
- To what extent does OLA’s real-time pricing affect your decision regarding the timing of your rides?
- Strongly Affects Timing
- Somewhat Affects Timing
- Neutral
- Minimally Affects Timing
- Does Not Affect Timing
- How transparent do you perceive OLA’s communication about real-time pricing?
- Very Transparent
- Transparent
- Neutral
- Not Very Transparent
- Not Transparent at All
- To what degree does transparent communication about pricing impact your overall satisfaction with OLA and your loyalty to the platform?
- Significant Impact
- Moderate Impact
- Neutral
- Minor Impact
- No Impact
- Have variations in OLA’s real-time pricing influenced the frequency of your app usage?
- Substantially Increased Usage
- Slightly Increased Usage
- No Change in Usage
- Slightly Decreased Usage
- Substantially Decreased Usage
- Are there any specific aspects of OLA’s real-time pricing that you find particularly positive or negative?
- Open-ended
- Please share any suggestions or comments regarding OLA’s real-time pricing strategy and its impact on your commuter
- Open-ended