
Relationship Between Cost Leadership Strategies and Performance of Domestic Airline Firms in Kenya
- Daniel Kiprotich Kiprop
- Sr. Dr. Lucy Wanza
- Mr. Robert Githinji
- 38-52
- Sep 4, 2023
- Leadership
Relationship Between Cost Leadership Strategies and Performance of Domestic Airline Firms in Kenya
1Daniel Kiprotich Kiprop,2 Sr. Dr. Lucy Wanza,3Mr. Robert Githinji
1 The Catholic University of Eastern Africa
2 Lecturer, The Catholic University of Eastern Africa
3 Lecturer, The Catholic University of Eastern Africa
DOI: https://doi.org/10.51244/IJRSI.2023.10804
Received: 17 July 2023; Revised: 01 August 2023; Accepted: 08 August 2023; Published: 04 September 2023
ABSTRACT
The business strategy or combination of strategies adopted by a firm has to fit the firm’s resources and competencies in addition to being responsive to the environmental dynamisms to achieve the desired competitive advantage. The objective of the study was to investigate the relationship between cost leadership and organizational performance of domestic airlines in Kenya. The study employed a correlational research design. The study targeted all the 48 domestic airline firms licensed and operating within the Kenyan borders. The study setting was the three airports in Kenya including JKIA, Wilson Airport, and Moi International Airport Mombasa. From each of the airlines, the target was to engage utmost five individuals holding management positions within the airline management structure. Stratified random sampling technique was used to arrive at a representative sample where Slovin’s formula was used. Primary data was collected using structured questionnaires while secondary data was gathered by use of a document analysis guide. A response rate of 90.23% was realized. Most of the respondents (44.85%, N = 87) were from airline with 11 to 20 staff. In terms of flight types, 40.72% (N = 79) indicated they offer non-scheduled flights. On nature of services 51.55% (N = 100) of the respondents indicated they offer both passenger and cargo hauling flights. Majority held that revenue for the company has been on the rise (60.3%, N = 117) and customers served increased annually comparing 2018 and 2019 (44.3%, N = 86). Pearson correlation test showed a weak positive correlation between cost leadership strategy and revenue generated by the airlines (N = 194, p = 0.005, r = 0.199 at 95% CL) and same to volume of cargo hauled (N = 194, p = 0.000, r = 0.255 at 95% CL) for the period of 2018 and 2019. Regression analysis revealed that cost leadership strategy had a 4% and 6.5% influence on revenue and volume of cargo hauled respectively implying Cost leadership is associated with performance of domestic airline firms in Kenya. The study recommends a longitudinal study in diverse industries to ascertain the relationship more so in the post Covid -19 pandemic.
Keywords: Cost Leadership, Domestic airline firms, Performance
INTRODUCTION
Organizations irrespective of size and industry operate in a dynamic business environment characterized by intense competition, technological advancements, ever-changing consumer tastes and preferences, and changing government policies.
To survive, adapt, and sustain long-term profitability amid these dynamic changes, firms seek to implement competitive business strategies including cost leadership (Chryssochoidis, Dousios, &Tzokas, 2016).
Cost leadership is achieved when a firm becomes the lowest-cost producer in its industry. The sources of cost advantage vary from one industry to another and may include pursuit of economies of scale, access to proprietary technology, and preferential access to cheap raw materials.
The history of the world’s aviation industry dates back to the Pre-World War I era following the establishment of Germany’s Deutsche Luftschiffahrts- Aktiengesellschaft AG (DELAG) in 1909. DELAG was headquartered in Frankfurt. It chartered flights across Germany’s major cities using airships that the Zeppelin Corporation manufactured. By 1914, DELAG’s airships had transported 34,028 passengers on 1,588 commercial flights. During these trips, the fleet accumulated a total of 175,535 kilometers. In spite its initial success, a significant number of DELAG’s airships including LZ 7, LZ 6, LZ8, and LZ 10 were destroyed either by fire or high winds (Brooks, 1965).
Throughout the 1920s and 1930s, African air services were operated by airlines based in Europe and the United States. The key operators included Air France, Imperial Airways, and Deutsche Lufthansa. Despite the colonial governments’ dominance in the continent’s aviation industry, Africa’s first airline, South African Airways, was established in 1934. Later, Ethiopia Airlines, Central African Airlines (CAA), East African Airways (EAA), and Air Afrique were incorporated in 1945, 1946, and 1961 respectively. CAA, EAA, and Air Afrique were multinational airlines. While EAA served Kenya, Uganda, and Tanzania, CAA served Zimbabwe, Zambia, and Malawi, while Air Afrique served twelve west African countries, among them, Benin, Burkina Faso, Cameroon, Central African Republic, Chad, Côte d’Ivoire, Gabon, Mauritania, Niger, the Republic of the Congo, and Senegal (Amankwah-Amoah, 2017).
The history of the Kenyan airline industry dates back to 1945 when the East African Airways (EAA) was formed to serve the governments of Kenya, Uganda, Tanganyika, and Zanzibar. Over the years, other firms have joined the industry making it more competitive. Competition from other airlines across the globe is continually making domestic airlines such as KQ more aware of their strategies and dwindling performance. Despite implementing various strategies, the airlines continue to performance dismally in the recent past due to diverse factors among them; globalization, liberalization and consolidation of the African markets. The downward trend in performance of these domestic airlines in Kenya calls for attention because their counterparts in the region such as Ethiopian airlines seems to be outperforming them and therefore assuming a competitive disadvantaged position.
Performance of Domestic Airline Firms
Analyzing the financial and operational metrics of domestic airline firms in Kenya reveals the key factors influencing their performance, which include customer satisfaction, on-time performance, cost management, and market share, ultimately determining their competitiveness within the industry (David, 2013). According to Samunderu (2023), air transport plays a crucial role in global economic development. The existence of direct connections between cities enables the seamless flow of goods, people, capital, technology, and ideas. This interconnectedness is vital for various industries to thrive and contribute to overall economic growth. Furthermore, falling air transportation costs have also played a significant role in facilitating this growth. As per the report’s findings on routes or airport, pairs’ total number within countries with multiple airports in some cities is much higher due to counting connections both ways. It highlights how governments worldwide have continued supporting airlines amidst the deeper and longer impact of COVID-19 shock compared to expectations from last year. These measures prevented widespread airline failures in 2021 similar to those experienced in 2020 (Florido-Benítez, 2021).
In regards to restrictions that can affect airline performance and entry into certain markets may be restricted if entities responsible for issuing concessions and permits exercise excessive discretion (Lee (2020). Such limitations could hinder competition among domestic airline firms operating within specific regions or countries. Additionally, Adwan (2021) shows empirical evidence suggesting that economies of scale and density significantly influence airline performance. Larger airlines benefit from economies of scale due to their ability to spread fixed costs over a larger volume of passengers carried or cargo transported. On top of that, are economies derived from increased aircraft utilization rates through improved scheduling efficiency. When it comes specifically to domestic airline, firms’ performance analysis based on these citations gathered thus far. Regarding financial metrics such as revenue generation and profitability indicators, it would be interesting to examine how different factors influence the customer satisfaction levels of domestic airline (Kaya et al., 2023).
Understanding what aspects, drive customer satisfaction, such as service quality and comfort, can contribute significantly to enhancing a firm’s financial performance (Hsu & Lin, 2023). Furthermore, on-time performance is crucial for domestic airline firms in gaining and maintaining customers’ trust and loyalty. Airlines that consistently deliver flights on time are more likely to attract repeat business and positive word-of-mouth recommendations from satisfied passengers. It would be worth exploring how various operational strategies affect airlines’ ability to adhere to schedules (Chen, Fu, Hensher & Sze, 2022). Cost management also plays a vital role in determining the financial health and competitiveness of domestic airline firms. Examining cost structures, including fuel expenses, labor costs, maintenance fees, and overhead expenditures across different airlines within the same market could provide valuable insights into industry trend. Identifying cost-saving measures without compromising safety standards is instrumental in improving profitability. Market share analysis is another critical aspect when evaluating the performance of domestic airline firms. Understanding how each carrier positions itself within its respective market segment allows for an examination of competitive dynamics. Factors influencing market share may include pricing strategies, route networks encompassing both popular destinations as well as emerging markets with growth potential (Meng-Lewis, Wong, Zhao & Lewis, 2022).
Theoretical Framework
Resource Based-View Theory
Wernefelt coined the resource based-view (RBT) theory in 1984. It is based on the premise that the possession of distinctive physical and human resources provide an organization with the ability to develop and sustain a competitive advantage. In this context, resources include organizational culture, employees, culture, knowledge, or key competencies. RBT, which is based on the assumption that competitive advantage occurs when resources are not only heterogeneous across the firm but also immobile in such a way that competing organizations cannot easily obtain such resources from other firms (Bromiley & Rau, 2016).
The theory also presumes that for resources to provide a competitive advantage, they must fulfill four criteria. First, it must be valuable. The resource must not only have strategic value to the firm but it must also result in more efficiency within the organization. If not, the resource lacks the ability to improve the organization’s competitiveness. Aside from being valuable, the resource must be rare to find amongst existing and potential competitors of an organization. When a resource is not rare, it can be easily duplicated or acquired by other players within an industry, thereby diminishing the sustainable competitive advantage. The resource must also be inimitable. It should be impossible to copy or duplicate the resource because they are dependent on unique historical settings, are rare or complex to replicate. Besides inimitability, competitors should not be able to substitute the resource with another alternative that offers similar results (Mweru & Muya, 2016). Supporters of the RBT theory contend that availability of valuable, rare, inimitable, non-substitutable resources helps organization to attain and sustain competitive advantage.
The theory (RBT), however, has been criticized for lacking operational validity. It has been argued, for example, that while RBT recommends that firms develop and obtain strategic resources that are rare, valuable, inimitable, and non-substitutable, it fails to explain how organizations can utilize those resources to attain a competitive edge (Bromiley& Rau, 2016). It has also been criticized for being too limited. The authors argue that RBV does not apply to small-scale organizations because they cannot afford to obtain valuable, rare, inimitable, and non-substitutable (VRIN) resources. (Bromiley and Rau (2016) also contend that the resources organizations need to achieve a sustained competitive advantage are those that are hard to obtain. In their opinion, only firms that already possess those resources can acquire and apply additional resources; otherwise, competitors would acquire them with equal ease.
According to the resource-based view, a sustained competitive advantage is possible only if resources meet the VRIN criteria. Hitt, Carnes, and Xu (2016) criticize this claim by arguing that sustained competitive advantage is not achievable. The scholars base their argument on the assertion that the current business environment is characterized by dynamic changes and innovation that force all the organizations to implement strategic changes or risk being obsolete. Accordingly, organizations are likely to surpass their industry leaders during their efforts to adapt to the constant changing business environment. As such, competitive advantage is temporary and firms should consistently yearn to achieve it through aligning their strategies to the environmental dynamics.
LITERATURE REVIEW
Cost Leadership and Organizational Performance
Various studies have been conducted worldwide to assess the impact of cost leadership on the bottom-line of organizations in different industries. In Hilman and Kaliappen (2014) study on “Do Cost Leadership Strategy and Process Innovation Influence the Performance of Malaysia Hotel Industry?” The study examined the performance of 54 three to five star rated hotels registered in the Ministry of Tourism and Culture in Malaysia. Cross-sectional research design was used to investigate their research question. The authors targeted 475 hotel managers with structured questionnaires that were sent through email. The questionnaire assessed whether the hotels pursued strategies to produce goods and services at low costs or utilized available equipment, services, and facilities properly. Results from the study found that cost leadership explained 97% of changes in organizational performance. These findings supported the hypothesis that cost leadership has a positive impact in organizational performance. However, the study was limited by a small sample size.
In a similar study titled “The Relationship between Cost Leadership Competitive Strategy and Firm Performance: A Mediating Role of Quality Management”,Kharub, Mor, and Sharma (2017) examined 245 ISO certified micro, small, and medium enterprises in India. The authors utilized a descriptive cross-sectional design. Additionally, they used simple random sampling to select key personnel from the selected organizations to interview for the study. Data was collected using structured questionnaires consisting of both open ended and close-ended questions. The study found no significant relationship between cost leadership and firm performance. The study results’ generalization to large organizations, however, was limited.
In another study on generic Strategies and Firm Performance of Austrian SMEs, Leitner and Guldenberg (2016), investigated the impact of cost leadership on small and medium-sized enterprises in Austria. A longitudinal research design was used to study a target population of all SMEs with 20 -500 employees. A sample of 120 firms across industries. Telephone interviews were conducted together with questionnaires for general managers. The results showed that firms that implemented low cost production strategies outperformed their counterparts with no generic strategies in terms of profitability and growth.
Hilman and Kaliappen’s (2014) results were similar to those found by Liu and Atuahene-Gima’s (2018) study titled “Enhancing Product Innovation Performance in a Dysfunctional Competitive Environment: The Roles of Competitive Strategies and Market-Based Assets. “In the study, Liu and Atuahene-Gima (2018) adopted a descriptive research design. The researchers also used simple random sampling to select 282 Chinese high technology companies. The target population were the managers of the selected companies with structured questionnaires that assessed the organizations’ competitive strategies and performance. Data from the study demonstrated that cost leadership was associated with higher returns. Differentiation, on the other hand, was found to be less effective in predicting performance in competitive business environments.
Bala and Gawuna (2020)) carried out a study on Cost Leadership Strategy and Performance of Hotels in Nigerian. They employed census to examine the impact of cost leadership on the performance of all the 83 hotels in Kano State Nigeria. The study utilized a cross-sectional research design. In the study, cost leadership was measured as the extent to which hotels minimized their production costs relative to their competitors. Performance, on the other hand, was measured as the extent to which businesses record financial and non-financial successes or failure in a given period. Results from the study found that cost leadership strategy had a direct significant positive relationship with hotels performance.
METHODOLOGY
Research design is a framework of methods and techniques utilized by researchers to integrate the different components of a study to ensure a research problem is addressed. It constitutes the blueprint for collecting, measuring, and analyzing data (Almalki, 2016). It describes the structure of the research problem and delineates the techniques used by a researcher to obtain empirical evidence on the issue of study. This study utilized a correlational research design.
A correlational research design is a framework to investigate the relationships among two or more variables. According to Koo and Li (2016), correlational research design is employed when a researcher wishes to determine the degree of the relationship between two or more variables. It is also useful in developing prediction models that can be used to predict the future value of a variable from the current value of one or more variables. While correlation research helps in the investigation of relationships among variables, it cannot be used to draw inferences about a causal relationship between a study’s constructs (Koo & Li, 2016). Correlational research design was chosen to investigate the extent of the relationship between generic strategies and organizational performance due to its ability to predict the future performance of domestic airline firms in Kenya.
Population refers to the total number of people, units, items, elements, or phenomenon a researcher wishes to investigate (Rahi, 2017). The target population, on the other hand, includes a specific population that a researcher wishes to study. The study targeted all the 48 domestic airline firms licensed and operating within the Kenyan borders as shown in Table 1 below.
Table 1. Target Population
| Category of Airline Operations | Number of firms per category |
| Passenger only | 19 |
| Cargo Only | 14 |
| Combined Passenger and Cargo | 15 |
| Total | 48 |
Source: Kenya Airports Authority (2022)
The respondents for the study were be drawn from the pool of individuals holding key managerial positions in the 48 airline organizations. Five top managerial positions were considered. The respondents include individuals holding diverse managerial positions in the selected organizations including operations managers, sales and marketing managers, maintenance managers, finance managers, and branch managers because all the competitive strategic decisions are made at their level.
Research instruments include measurement tools designed to gather or collect information on a topic of interest. Examples of research instruments include questionnaires, interviews, observations, and focus group discussions (Mohamad, Sulaiman, Sern, & Salleh, 2015). For the study, the researcher utilized structured questionnaires to collect primary data. Secondary data gathered from online publications and other company materials were collected using a document analysis guide.
Prior to conducting the survey, a pre-test of the instrument was be conducted on 10 respondents. A pre-test was done to guarantee the validity of the instrument. The questionnaires were administered to management and staff who were present at the premises or available on phone of the domestic airline companies during the time of visit. Once the questionnaires are retrieved, the researcher reviewed them in order to determine whether they are acceptable for usage. Any errors that were identified in the pre-test questionnaires was modified. It is also worth noting that participants who participated in the pre-test did not partake in the main study.
In order to ensure that an instrument accurately measures what it was intended to measure, validity tests was performed. Three types of validity were assessed: content, construct, and criterion validity. According to Heale and Twycross (2015), content validity refers to the extent to which items measure the content of the properties or traits that an investigator wishes to measure. For this study, content validity was ensured through the use of expert reviews and cross references from past studies on the related topics.
Construct validity indicates the extent to which an instrument accurately measures a variable. Common methods to assess construct validity include factor analysis and correlation tests. Criterion validity measures the extent to which an instrument’s scores correlate with an external variable. For this study, a positive relationship between the variables is expected. Accordingly, construct and criterion validity were measured using correlation tests. Reliability on the other hand refers to the consistency of a measurement tool. An instrument is termed reliable if it yields consistent results after repeated tests (Heale &Twycross, 2015. For this study, the reliability of the research instruments was measured using Cronbach’s alpha coefficient.
Conceptually, Cronbach’s alpha estimates the variation between a set of items in a group. Usually, the Cronbach’s alpha coefficient ranges from 0 and 1. It has been suggested that Cronbach’s alpha coefficient values that are greater than 0.9 imply excellent reliability. Values between 0.8 and 0.9 and those between 0.7 and 0.8, on the other hand, have been associated with “good” and “acceptable” reliability respectively. It is also worth noting that Cronbach’s alpha coefficient values below 0.7 have been termed questionable, poor, and unacceptable. After piloting on 10 respondents, Cronbach’s alpha coefficient was 0.809 far above 0.7 and therefore considered acceptable.
A sample is a representative subset of a population utilized by researchers to collect information that can be generalized to their entire population (Malterud, Siersman, & Guassora, 2016). Sampling, on the other hand, is the process of selecting a subset of a population in order to measure the characteristics, norms, and attitudes of a group of people. Sampling is beneficial to reduce the workload and costs that would be incurred in studying the entire population.
The study drew the respondents from the top-level managers in the sampled domestic airline companies. Five top-level managers in each of the organizations were selected to represent their firms. Slovin’s formula was employed in estimating the sample size.
Where; n = Sample size
N = Approximation of the population size (Sample frame)
e = Margin of error (5%)
![]() ≈ 43 airlines
≈ 43 airlines
This study therefore, had a total of 43 airlines sampled and 215 respondents selected from the management team. Thus, this study selected five respondents from management team of airlines sampled to make 215 respondents.
Table 2. Sample size
| Category of Airline Operations | Number of firms per category | Sampled firms | No of respondents |
| Passenger only | 19 | 17 | 85 |
| Cargo Only | 14 | 12 | 60 |
| Combined Passenger and Cargo | 15 | 14 | 70 |
| Total | 48 | 43 | 215 |
According to Etikan, Musa, and Alkassim (2016) there are two types of sampling, probability and non-probability sampling. While probability sampling offers individuals an equal opportunity to be included in the study, the chance of being selected is not known or confirmed in non-probability sampling. Examples of probability sampling methods include simple random sampling, systematic sampling, stratified sampling, clustered sampling, and multi-stage sampling. Non-probability sampling, on the other hand, include convenience sampling, judgment or purposive sampling, snowball sampling, and quota sampling (Etikan, Musa, &Alkassim, 2016). For the proposed study, the researcher employed probability methods, specifically, stratified sampling technique, to select proportionate sample of the 48 domestic airline companies in Kenya based on their category of operations. Five top-level managers from each of the sampled organizations were selected based on their disposition in strategy implementation. Stratified random sampling technique is deemed appropriate for this study because it ensured a fairly equal representation of the study objects. Stratification was based on the nature of operations, availability of staff, where the strata was whether the airlines are purely for passengers, cargo or both. After data collection, the questionnaires from the field was cleaned, coded, and keyed into a computer software – statistical package for social sciences (SPSS).The software was preferred over other statistical packages due to its wide range of analysis tools including descriptive analysis, regression, cluster analysis, and factor analysis. SPSS also comprises of a wide variety of visualization tools used in displaying results. Various data analysis procedures were utilized to evaluate the relationships between the study’s variables. Key among the quantitative tools that was employed includes descriptive statistics, such as frequencies, means, median, standard deviation, and mode.
Besides descriptive statistics, the researcher employed Pearson’s correlation analysis to investigate the relationships among variables as hypothesized. Negative correlation coefficients implied negative relationships while positive coefficients suggested positive relationships between variables. Additionally, Pearson’s correlation coefficients that was equal zero indicated a lack of correlation between variables. Coefficients near one, on the other hand, implied a strong correlation (Benesty, Chen, Huang, & Cohen, 2009).
Further, simple liner regression was employed to determine the extent to which cost leadership, predict the performance of domestic airlines in Kenya. The regression model took the form:
Y = α + β1X1+ Ɛ
Where;
Y represents organizational performance
α represents the constant term
β1, represent regression coefficients
X1 represents cost leadership strategy
Ɛ Represents Error term
FINDINGS
Presentation of the Findings
The data collection was a success given that out of the 215 targeted respondents, 194 (90.23%) from 43 domestic airlines in Kenya completed the survey. The tool used was found to be reliable with a Cronbach’s Alpha of 0.809. Following the disruptions witness in the Airline Industry in Kenya and globally secondary to COVID-19 pandemic, the 2020 data was found to be highly disrupted, and in most cases unavailable. The time specific data is, therefore, based on data for the years 2018 through end of 2019. Also, due to the sensitivity of the airline industry, getting actual revenues data for all the airlines from the informants or through secondary data search was ineffective. However, this did not affect the study since data collected on airlines sustained increment trend on revenue, passengers served, and volume of cargo hauled was sufficient.
Cost Leadership Strategies
Under this strategy, the respondents were asked to rate their degree of agreeing to seven statements on cost leadership in a 5-point Likert scale (1 – not at all, 2 – small extent, 3 – moderate extent, 4 – large extent, and 5 – very great extent). The responses are shown in the table below. The organization being able to “control operating and overhead costs” had the lowest score with overall mean (M) of M = 2.74 (standard deviation (SD) = 0.812, N = 194). All the other questions had a mean above 3.0 with highest mean (M = 4.20, SD = 0.724, N = 194) reported on the response to “the organization offers competitive prices for its products and services”.
Table 1. Response Distribution for Statements on Cost Leadership
| Statements on Cost Leadership | 1 | 2 | 3 | 4 | 5 | Mean | SD |
| My organization offers a wide range of products/services | 5.7%
(n = 11) |
24.7%
(n = 48) |
15.5%
(n = 30) |
33.5%
(n = 65) |
20.6%
(n = 40) |
3.39 | 1.22 |
| Over the years, my organization has achieved operational efficiency | 1.0%
(n = 2) |
2.1%
(n = 4) |
19.6%
(n = 38) |
53.6%
(n= 104) |
23.7%
(n = 46) |
3.97 | 0.781 |
| My organization has managed to control operating and overhead costs | 3.1%
(n = 6) |
38.4%
(n = 74) |
41.8%
(n = 81) |
15.5%
(n = 30) |
1.5%
(n = 3) |
2.74 | 0.812 |
| The firm offers competitive prices for its products and services | 1.0%
(n = 2) |
0.5%
(n = 1) |
10.4%
(n = 20) |
53.6%
(n= 104) |
34.5%
(n = 67) |
4.20 | 0.724 |
| The company outsources some services to firms or individuals that offer lower labor costs | 1.0%
(n = 2) |
16.0%
(n = 31) |
36.6%
(n = 71) |
35.6%
(n = 69) |
10.8%
(n = 21) |
3.39 | 0.917 |
| In the last two years, the organization has reduced the number of employees | 1.5%
(n = 3) |
20.6%
(n = 40) |
50.5%
(n = 98) |
24.7%
(n = 48) |
2.6%
(n = 5) |
3.06 | 0.786 |
| The organization utilizes contract-based employees to minimize costs | 0.0%
(n = 0) |
11.9%
(n = 23) |
22.2%
(n = 43) |
38.7%
(n = 75) |
27.3%
(n = 53) |
3.81 | 0.969 |
During the analysis, the responses for all seven statements were averaged to give an overall score per person on all the seven statements. Most of the respondents were agreeing moderately to a large extent as shown in the histogram below with averaged responses being concentrated between scale score 3 and 4. The mean score was 3.51, with a standard deviation of 0.384, with N = 194, which denotes most respondents fair believed the airlines were implementing cost leadership strategies.
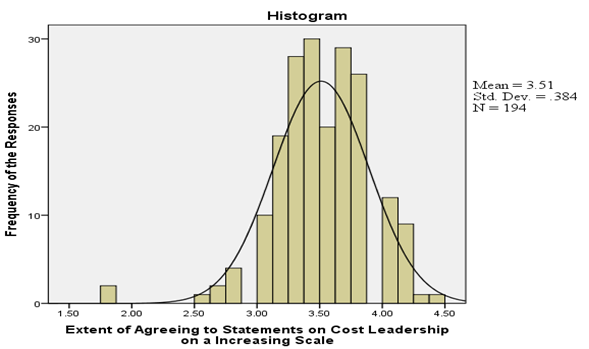
Figure 1. Averaged Score of Response to Cost Leadership Statements
Airline’s Performance
The airline performance was evaluated on three parameters; revenue generated, number of customers served and volume of cargo hauled. Descriptive statistics employed were; mean, standard deviation, minimum and maximum. The study results were presented in Table 15.
Table 15. Airline’s Performance
| N | Missing | Mean | Std. Deviation | Minimum | Maximum | |
| The airline’s revenue has been on an increasing trend since 2018 | 194 | 0 | 6644984.93 | 0.660 | 820000 | 34000000 |
| The airline’s revenue has been on an increasing trend since 2019 | 194 | 0 | 6639067.47 | 0.777 | 816000 | 30000000 |
| Has the number of customers been on an increasing trend from 2018 | 194 | 0 | 30537.26 | 0.794 | 10150 | 98345 |
| Has the number of customers been on an increasing trend from 2019 | 194 | 0 | 32051.10 | 0.783 | 10210 | 92700 |
| Has the total volume of cargo hauled been on the rise since 2018 | 194 | 0 | 5517.21 | 0.711 | 1200 | 9870 |
| Has the total volume of cargo hauled been on the rise since 2019 | 194 | 0 | 5056.86 | 0.141 | 1093 | 9740 |
Table 15 presents results of the descriptive statistics of airline performance of 48 domestic airline firms in Kenya during the period 2018 to 2019. For the airline’s revenue trend in 2018, the minimum value was 820000 while the maximum value was 34000000. The mean was 6644984.93 and standard deviation of 0.660. For the airline’s revenue trend in 2019, the minimum value was 816000 while the maximum value was 30000000. The mean was 6639067.47 and standard deviation of 0.777.
The study findings also revealed that the number of customers trend in 2018 had a minimum value of 10150 and maximum of 98345. The mean was 30537.26 and standard deviation of 0.794. The number of customers trend in 2019 had a minimum value of 10210 and maximum of 92700. The mean was 32051.10 and standard deviation of 0.141. The findings further indicated that the total volume of cargo hauled in 2018 had a minimum value of 1200 and maximum of 9870. It has a mean of 5517.21 and standard deviation of 00.711. Finally, for the total volume of cargo hauled in 2019 the minimum value was 1093 and maximum of 9740. Its mean was 5056.86 and standard deviation of 0.141.
Correlation Analysis
As shown in the correlation output Table 2, there was a weak positive correlation between cost leadership strategy and revenue generated between 2018 and 2019 (N = 194, p = 0.014, r = .175, CL = 95%).
Table 2. Correlation between Competitive Strategies and Revenue
| Revenue | Cost Leadership | ||
| Revenue | Pearson Correlation | 1 | |
| Sig. (2-tailed) | |||
| Cost Leadership | Pearson Correlation | .175* | 1 |
| Sig. (2-tailed) | 0.014 | ||
*. Correlation is significant at the 0.05 level (2-tailed).
Simple Linear Regression Model for Cost Leadership Strategies
The simple linear regression analysis models the relationship between the dependent variable organizational performance and independent variable cost leadership strategies. The results are shown in the section that follows;
Table 2. Model Summary
| R | R Square | Adjusted R Square | Std. Error of the Estimate |
| .175a | .031 | .026 | 1.29769 |
The coefficient of determination (R2) and correlation coefficient (R) shows the degree of association between cost leadership strategies and organizational performance. The results of the linear regression in Table 4 indicated that R2 =0.031 and R = 0.175. R value gives an indication that there is a strong linear relationship between cost leadership strategies and organizational performance. The R2 indicates that explanatory power of the independent variables is 0.031. This means that about 3.1% of the variation of organizational performance is explained by the regression model. This implies that the cost leadership strategies had an influence on organizational performance.
Table 3. Regression Model Fitness Results
| Sum of Squares | df | Mean Square | F | Sig. | |
| Regression | 10.265 | 1 | 10.265 | 6.096 | .014b |
| Residual | 323.329 | 192 | 1.684 | ||
| Total | 333.595 | 193 |
From Table 5 the F test provides an overall test of significance of the fitted regression model. The F value indicates that all the variables in the equation are important hence the overall regression is significant. The F-statistics produced (F = 6.096) was significant at p=0.000 thus confirming the fitness of the model and therefore, there is statistically significant relationship between cost leadership strategies on organizational performance.
Table 3. Regression Model Coefficients
| Unstandardized Coefficients | Standardized Coefficients | t | Sig. | ||
| B | Std. Error | Beta | |||
| (Constant) | 2.555 | .859 | 2.973 | .003 | |
| Cost Leadership | .601 | .243 | .175 | 2.469 | .014 |
The study results in Table 6 revealed that there was positive linear effect of cost leadership strategies on organizational performance (β1=.601, p=0.000). This reveals that an increase in cost leadership strategies increases organizational performance by 0.601 units.
Y =2.555 +0.601X1 ………………………………………………….….Equation 1
The study findings showed that most respondents fair believed the airlines were implementing cost leadership strategies with a mean score of 3.51, with a standard deviation of 0.384. The study findings on correlation further showed that there was a weak positive correlation between averaged cost leadership strategy and revenue generated between 2018 and 2019 (N = 194, p = 0.003, r = .216, CL = 95%). Cost leadership has a positive and significant association with airline’s revenue (β1=0.568, p=0.017< 0.05).
This implied that for the domestic airline firms to realize performance they should have a cost leadership strategy. The study concurred with Hilman and Kaliappen (2014) whose results showed that cost leadership explained 97% of changes in organizational performance. The findings supported the hypothesis that cost leadership has a positive impact in organizational performance. Further Leitner and Guldenberg (2016) found that firms that implemented low-cost production strategies outperformed their counterparts with no generic strategies in terms of profitability and growth. However, the study failed to concur with Kharub, MOR, and Sharma (2017) who found no significant relationship between cost leadership and firm performance.
The study findings showed that there is a correlation between cost leadership strategies and organizational performance of domestic airline firms in Kenya. This implies that the organization offers a wide range of products/services and has achieved operational efficiency. The organization has also managed to control operating and overhead costs as well as offering a competitive price for its products and services. The organization had outsourced some services to firms or individuals that offer lower labor costs hence reducing the number of employees. Further, the organization utilizes contract-based employees to minimize costs. Cost leadership is achieved when a firm becomes the lowest cost producer in its industry. Results from the study found that cost leadership strategy had a direct significant positive relationship with hotels performance.
CONCLUSION OF THE STUDY
On cost leadership, it was noted that, competitive prices for airline products and service directly affects performance of domestic airline firms in Kenya.
RECOMMENDATION OF THE STUDY
To endure the highly competitive and turbulent business atmosphere coupled with rapid technological changes, there is need for domestic airline firms in Kenya to enhance competitive strategic engagements and aligning them to the dynamisms of the environment. The positive association between these cost leadership and performance suggests that there would be increase in performance if the tactics were enhanced. Further, the study recommends that organization should managed to control operating and overhead costs because doing so would not only make them profitable but also sustainable. Furthermore, the study recommends that longitudinal surveys be conducted in different sectors and industries to ascertain the relevance of the findings more so in the post Covid – 19 period.
REFERENCE
- Adwan, M. (2021). COVID-19 on aviation: Insights on challenges facing the airlines; managing uncertainty, and the potential role of leadership in dealing with a crisis. Business Educator: Working Paper Series of the Centre for Management Learning and Business Education, 1, 61-78.
- Ahmad, H., & Halim, H. (2017). Determining Sample Size for Research Activities. Selangor Business Review, 2(1), 20-34.
- Alexander, E. (2017). After rationality: Towards a contingency theory for planning. In Explorations in planning theory (pp. 45-64). Routledge.
- Almalki, S. (2016). Integrating quantitative and qualitative data in mixed methods research–challenges and benefits. Journal of Education and Learning, 5(3), 288-296.
- Alvarez, S. A., & Barney, J. B. (2017). Resource‐based theory and the entrepreneurial firm. Strategic entrepreneurship: Creating a new mindset, 87-105.
- Amankwah-Amoah, J. (2017). Pan-African strategic alliance, global competition: A case study of Air Afrique.
- Bala, D., & Gawuna, A. A. (2020). Entreprenuership Practices In Contemporary Nigeria: Challenges And A Way Forward Towards Building A Strong Nation. Journal Doi, 6(12).
- Bonett, D. G., & Wright, T. A. (2015). Cronbach’s alpha reliability: Interval estimation, hypothesis testing, and sample size planning. Journal of Organizational Behavior, 36(1), 3-15.
- Bromiley, P., & Rau, D., (2016). Operations management and the resource based view: Another view. Journal of Operations Management, 41, 95-106.
- Brooks, P. W. (1965). A history of the world’s qirlines. The Journal of Transport History, (1), 60-61.
- Chen, C., Huang, H., & Wey, S. (2017). The mediating roles of differentiation strategy and learning orientation in the relationship between entrepreneurial orientation and firm performance. Corporate Management Review, 37(1), 1-40.
- Chen, T., Fu, X., Hensher, D. A., Li, Z. C., & Sze, N. N. (2022). Air travel choice, online meeting and passenger heterogeneity–an international study on travellers’ preference during a pandemic. Transportation Research Part A: Policy and Practice, 165, 439-453.
- Chryssochoidis, G., Dousios, D., &Tzokas, N. (2016). Small firm adaptive capability, competitive strategy, and performance outcomes: Competing mediation vs. moderation perspectives. Strategic Change, 25(4), 441-466.
- Crawford, V. P. (2016). New directions for modelling strategic behavior: Game-theoretic models of communication, coordination, and cooperation in economic relationships. Journal of Economic Perspectives, 30(4), 131-50.
- Daoud, J. I. (2017, December). Multicollinearity and regression analysis. In Journal of Physics: Conference Series (Vol. 949, No. 1, p. 012009). IOP Publishing.
- David Mc A, B. (2013). Service quality and customer satisfaction in the airline industry: A comparison between legacy airlines and low-cost airlines. American journal of tourism research, 2(1), 67-77.
- Etikan, I., Musa, S. A., &Alkassim, R. S. (2016). Comparison of convenience sampling and purposive sampling. American journal of theoretical and applied statistics, 5(1), 1-4.
- Fernando, S. (2018). Kenyan airways: a new era of East African aviation.
- Florido-Benítez, L. (2021). The effects of COVID-19 on Andalusian tourism and aviation sector. Tourism Review, 76(4), 829-857.
- Frantz, R., & Marsh, L. (2016). Herbert Simon: A Hedgehog and a Fox. In Minds, Models and Milieux (pp. 1-4). Palgrave Macmillan, London.
- Heale, R., &Twycross, A. (2015). Validity and reliability in quantitative studies. Evidence-based nursing, 18(3), 66-67.
- Heinz, S., & O’Connell, J. F. (2013). Air transport in Africa: Toward sustainable business models for African airlines. Journal of Transport Geography, 31, 72-83.
- Hilman, H., &Kaliappen, N. (2014). Do cost leadership strategy and process innovation influence the performance of Malaysia hotel industry. Asian Social Science, 10(10), 134-144.
- Hilman, H., &Kaliappen, N. (2014). Do cost leadership strategy and process innovation influence the performance of Malaysia hotel industry. Asian Social Science, 10(10), 134-144.
- Hitt, M. A., Carnes, C. M., & Xu, K. (2016). A current view of resource based theory in operations management: A response to Bromiley and Rau. Journal of Operations Management, 41(10), 107-109.
- Hsu, C. L., & Lin, J. C. C. (2023). Understanding the user satisfaction and loyalty of customer service chatbots. Journal of Retailing and Consumer Services, 71, 103211.
- Justinian, M. J. (2016). Application of Porter’s generic competitive business strategies and their effect on performance in Zanzibar hotel industry (Master’s Thesis: Open University of Tanzania).
- Jyoti, J., Arora, H., &Kour, S. (2017). Outsourcing and Organizational Performance: Role of Cost Leadership, Differentiation and Innovation Strategies. Sustainable Competitive Advantage: A Road to Success, 171.
- Kaya, G., Aydın, U., Ülengin, B., Karadayı, M. A., & Ülengin, F. (2023). How do airlines survive? An integrated efficiency analysis on the survival of airlines. Journal of Air Transport Management, 107, 102348.
- Kaya, N. (2015). Corporate entrepreneurship, generic competitive strategies, and firm performance in small and medium-sized enterprises. Procedia-Social and Behavioral Sciences, 207, 662-668.
- Kharub, M., Patle, B. K., & Sharma, G. (2018). The relationship between differentiation strategy and firm performance: A mediating role of quality management. IOSR Journal of Mechanical and Civil Engineering, 66-71.
- Koo, T. K., & Li, M. Y. (2016). A guideline of selecting and reporting intraclass correlation coefficients for reliability research. Journal of chiropractic medicine, 15(2), 155-163.
- Lee, J. W. (Ed.). (2020). Aviation Law and Policy in Asia: Smart Regulation in Liberalized Markets (Vol. 10). Brill.
- Leitner, K., &Guldenberg, S. (2010). Generic strategies and firm performance in SMEs: A longitudinal study of Austrian SMEs. Small Business Economics, 35(2), 169-189.
- Leitner, K., &Guldenberg, S. (2010). Generic strategies and firm performance in SMEs: A longitudinal study of Austrian SMEs. Small Business Economics, 35(2), 169-189.
- Liu, W., &Atuahene-Gima, K. (2018). Enhancing product innovation performance in a dysfunctional competitive environment: The roles of competitive strategies and market-based assets. Industrial Marketing Management, 73, 7-20.
- Meng-Lewis, Y., Wong, D., Zhao, Y., & Lewis, G. (2022). Understanding complexity and dynamics in the career development of eSports athletes. Sport Management Review, 25(1), 106-133.
- Mhlanga, O. (2018). Impacts of the macro environment on airline performances in southern Africa: Management perspectives. Tourism and Hospitality Research, 1467358418771442.
- Mishra, P., Pandey, C. M., Singh, U., Gupta, A., Sahu, C., &Keshri, A. (2019). Descriptive statistics and normality tests for statistical data. Annals of Cardiac Anaesthesia, 22(1), 67.
- Mohamad, M. M., Sulaiman, N. L., Sern, L. C., &Salleh, K. M. (2015). Measuring the validity and reliability of research instruments. Procedia-Social and Behavioral Sciences, 204, 164-171.
- Muchiri, L., Ombui, K., &Iravo, M. (2017). Impact of strategic responses on the performance of oil marketing companies in Kenya. International Journal of Scientific and Research Publications, 7(10), 2250-3153.
- Mwangi, G. K., &Mwangangi, P. (2018). Influence of procurement management on performance of retail chain stores in Nairobi city county, Kenya. Journal of International Business, Innovation and Strategic Management, 1(7), 231-248.
- O’Connell, J. F. (2011). The rise of the Arabian Gulf carriers: An insight into the business model of Emirates Airline. Journal of Air Transport Management, 17(6), 339-346.
- Paradis, E., O’Brien, B., Nimmon, L., Bandiera, G., &Martimianakis, M. A. (2016). Design: selection of data collection methods. Journal of graduate medical education, 8(2), 263-264.
- Peterson, R. (2018). Impacts of airline deregulation. TR News, 315.
- Rahi, S. (2017). Research design and methods: A systematic review of research paradigms, sampling issues and instruments development. International Journal of Economics & Management Sciences, 6(2), 1-5.
- Samunderu, E. (2023). Africa’s Air Transport Infrastructure: Challenges, Complexities and Opportunities. In African Air Transport Management: Strategic Analysis of African Aviation Market (pp. 151-187). Cham: Springer International Publishing.
- Su, Z., Guo, H., & Sun, W. (2017). Exploration and firm performance: The moderating impact of competitive strategy. British Journal of Management, 28(3), 1-30.
- Taylor, J. M., Macpherson, T. W., Spears, I. R., & Weston, M. (2016). Repeated sprints: an independent not dependent variable. International journal of sports physiology and performance, 11(5), 693-696.