
Rural Livelihood Choices Effect on Perceived Soil Erosion in Kieni Sub Counties, Nyeri County in Kenya
- Fred K. Wamalwa (Ph.D.)
- Prof. Florence Ondieki – Mwaura (Ph.D.)
- 115-127
- Jan 30, 2024
- Social Welfare
Rural Livelihood Choices Effect on Perceived Soil Erosion in Kieni Sub Counties, Nyeri County in Kenya
Fred K. Wamalwa (Ph.D.)1*, Prof. Florence Ondieki – Mwaura (Ph.D.)2
1Department of Development studies, Catholic University of Eastern Africa, Eldoret, Kenya.
2Department of Development studies, Jomo Kenyatta University of Agriculture and Technology, Nairobi, Kenya.
*Corresponding Author
DOI: https://doi.org/10.51244/IJRSI.2024.1101010
Received: 29 August 2023; Revised: 15 September 2023; Accepted: 20 September 2023; Published: 29 January 2024
ABSTRACT
Poverty continues to be the main cause of livelihood challenges in the developing world. The environmental constraints among rural populations in arid and semi-arid communities or drylands continues to be a subject of interest in development research. One of the most understated effects of livelihood activities on the human wellbeing is their implication on soil degradation. Most studies regarding poverty and the environment overlook consequences of rural livelihood choices in marginal areas on the environment. The purpose of this study was to investigate household livelihoods influence on soil erosion in Kieni East and West sub counties of Nyeri County in Kenya. This has become necessary as poor rural populations are the hardest hit in terms of negative effects of livelihoods on soil degradation. The study adopted cross sectional research design, involving mixed method approaches to collect primary and secondary sources of data. The main source of quantitative data collection was household survey, while the qualitative aspect of data was collected using focused group discussions and desk reviews. Proportionate stratified random sampling technique was used to establish a 400 sample size in 10 sub locations of Kieni East and Kieni West sub counties. An independent T-Test was carried out to test statistical significance at p<0.05 at the two sites. Multiple regression analysis was used to determine the influence of livelihood choices on soil erosion problems. Based on the analysis, the linkage between livelihoods and soil erosion was significant. Pooled results show that soil erosion is mainly caused by cropping activities [B=0.277], forest activities [B=.195], and livestock activities [B=.125] respectively. The results also demonstrate that livestock activities influence on soil erosion in Kieni East was significant [B=.183] at P<0.05 and insignificant in Kieni West [B=.073] at p>0.05. The study concludes with some recommendations for policy consideration.
Key Words: Drylands; Crop activities; Livestock activities; Forest activities; Soil erosion, Kenya
INTRODUCTION
Generally, the association of poverty with rural populations is explained by deprivation in terms of basic and economic livelihood opportunities. Present day concerns about the level of poverty in rural areas have caused significant interests in research. Over the years different approaches have been adopted to address the problem of poverty in rural areas. These include poverty reduction strategies, food security programmes, sustainable agriculture and rural development, the Millennium Development Goals (MDGs) and from 2015, Sustainable Development Goals (UN, 2015). However, in spite of these concerted efforts, poverty remains a significant issue in the developing countries (World Bank, 2018).
Livelihood approaches to reduce poverty recognise that resources are at the centre of livelihood choices. Resources are seen in terms of ‘capitals’ and which are viewed as accessible or inaccessible to people mainly on the basis of structural factors. Therefore, the approaches view resources as assets and categorise them into five categories: human, physical, financial, natural and social (DFID, 2000). Definitional concepts of livelihoods vary among scholars. For instance, Ellis (2000) and Ellis & Freeman (2005), define a livelihood as comprising the assets, the activities, and the access to these assets and activities as mediated by social capital which together determine the living gained by the rural individual or household. Rural households engage in a variety of activities to support their wellbeing. Livelihood diversification activities adopted by rural households in developing countries can take several forms (Sherren, et. al., 2016; Hilson, 2016; Gebru & Beyene, 2012). A study by Heffernan and Misturelli (2000) of arid and semi-arid land (ASAL) communities in Kenya found that households in rural Kenya pursue a wide variety of activities. Based on these findings, we isolate two main categories of livelihoods that include on-farm and non-farm activities. We classify on farm activities as crop and livestock activities and non-farm as off farm and forest based activities in this study.
According to Babbier (2010, 2013), poverty is the main obstacle to promoting environmental conservation. Some of the environmental problems faced in developing countries include water shortage and contamination, deforestation, land degradation, air pollution and the loss of biodiversity. Over a few past decades, interest in sustainable development (Babbier, 2003) has been out of concerns to conserve the environment. Therefore, although current economic development may be leading to enhanced rural household welfare, it is at the expense of excessive depletion and degradation of natural capital. According to Sharda, et. al., (2013), it is estimated that 80% of the current degradation on agricultural land in the world is caused by soil erosion due to water. Erosion by water is a primary agent of soil degradation at the global scale, affecting about 1094 million hectares, or roughly 56% of the land experiencing human induced degradation (Nasri, et. al., 2009). It is estimated that cultivated and degraded land generates 10–20 times more runoff than do forests; thus, expanding cultivation can drive soil degradation unless the land is well managed (Moges, et. al., 2009). Moreover Kodiwo, et. al., (2013) in their study on agricultural land use shows that 23 and 8 per cent of the total land area in Kenya is severely and very severely degraded respectively.
The battle against poverty remains an important priority on Kenya’s development agenda (Government of Kenya, 2007). Kenya’s development agenda as enunciated in Vision 2030 aims to make Kenya a “middle” income country providing high quality life for Kenyans by the year 2030. However, the majority of the poor continue to be concentrated in rural areas, where their livelihoods (Lufumpa, 2005) depend on land for subsistence. This has led to continued deterioration of the environment, especially soil quality on which household agricultural activities are based. Therefore, Kenya faces the challenge of improving its economic performance and the lives of its citizens without undermining the environment upon which its national earnings and individual people’s livelihoods depend (Government of Kenya, 2007) thus undermining SDGs implementation (UN, 2015). The missing knowledge gap was thus failure of farmers to link livelihood choices to soil erosion as one of the main precursors of poverty in the area. The objective of this study was to determine the impact of rural household livelihood activities on soil erosion in Kieni East and West Sub counties in Nyeri County of Kenya.
METHODOLOGY
2.1 Research design
In order to understand fully the phenomenon of this study, a mix of quantitative and qualitative approaches were adopted. The quantitative component of the study assisted in the collection of quantitative data to understand household behaviour through household survey. The qualitative data (Kanbur, 2003 and Rao, 2002) was collected using focus group discussions and secondary documents review.
2.2 Study area location
Two sites were used in this study – Kieni East and Kieni West sub counties, in Nyeri County in Kenya, see Figure 2.1. The two sites depict similar farming systems and socio-cultural settings. The study area comprised of four wards in each sub county i.e. Mweiga, Mwiyoyo/Endarasha, Mugunda and Gatarakwa wards of Kieni West; and Naromoru/Kiamathaga, Thegu River, Kabaru, and Gakawa wards of Kieni East Sub County. The area is characterized by high temperatures in low altitude areas and low temperatures for areas adjustment to the Aberdare’s and Mt. Kenya water towers (Wamicha, 1993). The driest areas are Kiganjo and Narumoru that are within Agroclimatic zones (V) and (VI) respectively, while the mountains (Kenya and The Aberdare Ranges) within zone (I) are the wettest.
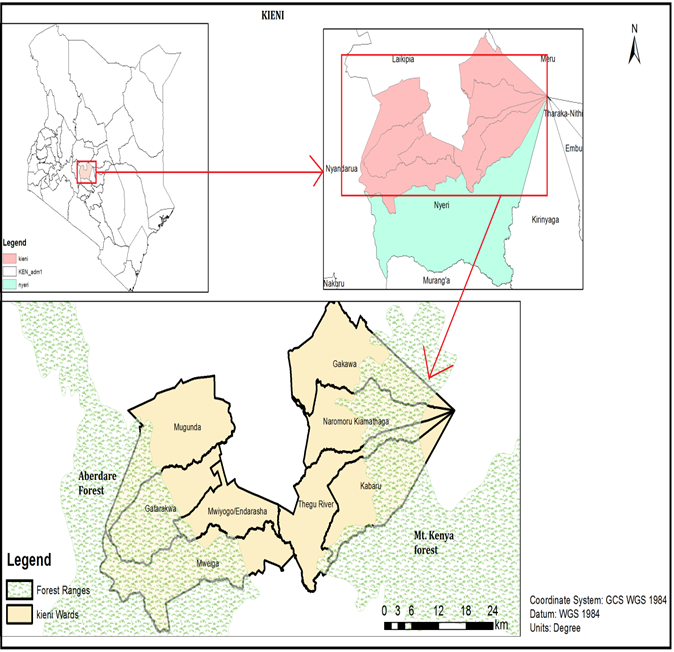
Fig. 2.1 Geographical location of Kieni East and Kieni West sub counties
2.3 Population
According to the 2009 population census (KNBS, 2010), the population of Kieni, was estimated at 175,812 (51,304 households) over an area of 1,321Km². Populations are mainly immigrants from the higher potential areas of Nyeri County and surrounding counties in the Mt. Kenya region and The Aberdare Ranges. The study populations were all the 51,304 households. Ten sub locations for this study were randomly selected from a total 59 sub locations (clusters) in the eight wards (strata). The individual farm household was used as the unit of analysis.
2.4 Sample size
The sample size for the study was determined using this formula as proposed by Yamane (1967) at 95% confidence level and P=0.5, i.e. n=N/[1+N(e)2]; where: n = the desired sample size; N = population of study (51,304); and e = level of precision(sampling error), the range in which the true value of the population is estimated. In this study, the range was +_ 5%. Based on these values set for alpha, desired statistical power level, effect size, and anticipated number of predictors, a sample size (n) of 396 (≈ 400) households (200 households for each of the two sites) of study site was considered adequate to balance required level of reliability and cost. The number of ten sub locations was also considered to be sufficiently large for drawing valid statistical inferences and was also manageable to be surveyed with the available resources of finance and time.
2.5 Sampling Techniques
In order to represent the population with sufficient accuracy and to infer the sample results to the population, the target sample households were selected in a random two stage sampling process. In the first stage, the study sub locations were randomly selected using proportionate stratified random sampling technique (PSRST) to determine the number of sample sub locations relative to sizes of each stratum (ward) in the population. This resulted in the selection of 10 sub locations; see Table I, appendix 1, each with 40 households according to their respective population strengths. Accordingly, the probability of selecting each of the ten selected sub locations based on population size was determined and varied between 11.1% for Gakanga sub location, and 56.8% for Kamatongu sub location, see Table I. The probability of selecting each household in the selected sub locations based on the population was also determined, and varied from 1.4% for Kamatongu to 10.9% in Bondeni sub location (Table I. in the Appendix). The constant overall weight of 1.3 (see Table I in the Appendix) demonstrates that each household in the population had an equal chance of being selected for the household survey interview. In the second stage, using random sampling techniques, individual households units in the selected sub locations were randomly selected in relation to population. Household lists provided by the local administrators (area Assistant Chiefs) of the sampled sub locations were used as sampling frame for selecting households. Accordingly, 400 households (40 households for each of the ten sub locations) were randomly selected for the study (Table I in the Appendix).
2.6 Instruments and Data Collection Procedures
A survey using structured questionnaire was the primary method of investigation employed for this study. However, focus group interviews, key informant interviews, and direct personal observations were also used in order to enrich the study with relevant qualitative information. A common questionnaire was developed for both study sites. It was administered in Kikuyu, the local language which households of both sites speak between April and July, 2017 with assistance of 5 enumerators. Two separate focus group discussions were conducted for each study site, with male and female household members. The focus group discussions were conducted in June 2017 after some preliminary findings from the questionnaire survey data were investigated. The focus groups composed of between 6 and 9 members of households in both sites. The participants were identified in purposeful selection among the survey samples that were thought to express their views actively in consultation with the enumerators. Village and major town markets in the area were visited to gather information on prices of major traded agricultural, livestock and forest products, including off farm activities. Farm field observation was conducted on some household farms to observe livelihood activities, management practices, and spatial locations in the farmers’ land holding.
RESULTS AND DISCUSSIONS
3.1 Descriptive Statistics
Table (II) shows descriptive statistics of variables studied. Pooled data results show that majority of households (76.5%) engage in crop activities, followed by off farm activities (60.5%), forest activities (45.8%), and livestock activities (39.8%) respectively. The results further show that household income was earned from the four main activities in the area. Annual average household income was Kenya Shillings (Kes) 31,455.20 from FA; 34,430.73(CA); 32,628.93(LA); and 66,300.83(OA). In term of soil erosion perception, pooled results indicate 98.8% households reported cause of soil erosion in the area as due to over grazing, and over cultivation [OGC]; 29.5% households experience soil erosion on their farms [SEF]; and 59.95% households believed farm produce reduction was due to soil erosion [FPR].
Table II. Descriptive statistics of Kieni East, Kieni West, and Pooled Data (all surveyed households)
| Variable Description | Kieni East (N= 200) | Kieni West (N= 200) | Pooled Data (N= 400) | |||
| %/Mean | SD | %/Mean | SD | % | SD | |
| Household activities | ||||||
| Household who engage in forest activities[FA] | 39.2 | 52.2 | 45.8 | |||
| Household who engage in crop activities[CA] | 64.5 | 88.5 | 76.5 | |||
| Household who engage in livestock activities[LA] | 47.0 | 32.5 | 39.8 | |||
| Household who engage in off farm activities[OA] | 55.0 | 66.5 | 60.5 | |||
| Independent variables(livelihood activities) | ||||||
| [FA]Annual Household income from forest activities (KShs) ** | 10,459.55 | 11,653.17 | 20,995.45 | 37383.35 | 31,455.20 | 21,554.19 |
| [CA]Annual household income from crops (KShs) *** | 23,056.62 | 52,615.09 | 81,033.08 | 175,790.46 | 34,430.73 | 63,077.08 |
| [CA]Average number of crop varieties grown per household | 4.8 | 3.8 | 4.3 | |||
| [LA]Annual Household income from livestock (KShs) ** | 29064.89 | 37175.48 | 37783.08 | 46821.33 | 32,628.93 | 41472.23 |
| [LA]Average household livestock number in TLU*** | 12.48 | 7.97 | 10.23 | |||
| [OA]Average annual household income from off farm activities (KShs) ** | 63,672.73 | 70,353.60 | 68,490.91 | 142,522.19 | 66,300.83 | 115,263.53 |
| Dependent variables(Soil erosion) | ||||||
| [OGC]% Households who perceive cause of soil erosion in the area as due to over grazing and over cultivation** | 100 | 98.4 | 98.9 | |||
| [SEF]% households experiencing soil erosion on their farms*** | 15.7 | 42.1 | 29.5 | |||
| [FPR]% households farm produce reduction due to soil erosion*** | 34.7 | 82.5 | 59.95 | |||
| Variables in which sample households of Kieni East have significant differences from those of Kieni West: *** = at 0.01 level of significance ** = at 0.05 level of significance. | ||||||
3.2 Estimates for Soil Erosion
Following Moore, et., al (2006), regression estimates of livelihood activities on soil erosion were developed from general regression model in equation 1 below.
Y= a+b1X1+b2X2+…bnXn………………………………………………………………………………….1
Where Y is the dependent variable, and X1,…,Xn are the n independent variables; and a, b1,…,bn, regression coefficients.
Considering soil erosion factors identified in this study, regression coefficients for four livelihood activity variables were computed as shown below in the regression models (2,3,&4) for the soil erosion variables in Kieni East, Kieni West, and overall study area. It is therefore a 3-step hierarchical regression, which involves the interaction between four continuous scores. In this case, soil erosion variables for Kieni East were entered at Step 1 (Model 2). In the second model, variables for Kieni West entered (Model 3), while pooled data for the first two models (Model 1) was for the overall soil erosion in the study area.
Model 1(Pooled Data Estimates):
Yse=B0+BFAXFA+BCAXCA+BLAXLA+BOA XOA
where: Yse = soil erosion variable; B0 = Regression intercept coefficient; BFA = Forest activity regression coefficient ; XFA= Forest activity variable; BCA= Crop activity on regression coefficient; XCA = Crop activity variable; BLA= Livestock activity regression coefficient; XLA = Livestock activity variable; BOA = Off farm activity regression coefficient, and XOA = off farm activity variable.
Model 2(Kieni East Data Estimates):
Yseke=B0+BFAkeXFAke+BCAkeXCAke+BLAkeXLAke+BOAkeXOAke……………………………………………2
where: Yseke = soil erosion variable in Kieini East; B0 = Regression intercept coefficient; BFAke = Forest activity regression coefficient (Kieni East); XFAke= Forest activity variable in Kieni East; BCAke= Crop activity on regression coefficient(Kieni East); XCAke= Crop activity variable in Kieni East; BLAke= Livestock activity regression coefficient(Kieni East); XLAke = Livestock activity variable(Kieni East); BOAke = Off farm activity regression coefficient(Kieni East), and XOAke = Off farm activity variable(Kieni East).
Model 3(Kieni West Data Estimates):
Ysekw=B0+BFAkwXFAkw+BCAkwXCAkw+BLAkwXLAkw+BOAkeXOAkw………………………………..………..3
where: Ysekw = soil erosion variable in Kieini West; B0 = Regression intercept coefficient ; BFAkew= Forest activity regression coefficient (Kieni West) ; XFAkw= Forest activity variable in Kieni West; BCAkw= Crop activity on regression coefficient(Kieni West); XCAkw= Crop activity variable in Kieni West; BLAkw= Livestock activity regression coefficient(Kieni West); XLAkw = Livestock activity variable(Kieni West); BOAkw = Off farm activity regression coefficient(Kieni West), and XOAkw = off farm activity variable(Kieni West).
The data obtained from all respondents (200 from each site including their livelihood activities and soil erosion) were considered in the models. The explanatory variables (Xi) included in the model were household: forest activities (FA), crop activities (CA), livestock activities (LA), and off farm activities (OA). FA, CA, LA, and OA are categorical variables. The dependent variable used in this multiple regression analysis was household perception of soil erosion in terms of soil erosion causes [OGC); soil erosion manifestation on farms [SEF]; and farm produce reduction (FPR), see table II. Like explanatory variable, dependent variables are also categorical. In Table III, regression analysis estimates are shown of livelihood activities on soil erosion.
Pooled results (Table III) indicate that the three out of four livelihood activities in the area cause soil erosion, with the greatest impact from crop activities[B=0.277], forest activities[B=0.195], and lastly cropping activities[B= B=0.125]. Results show that off farm activities had insignificant effect on soil erosion.
Table III. Hierarchical regression analysis coefficients of livelihood activities predicting soil erosion scarcity for Kieni East and West and pooled data
| Variables | Kieni East | Kieni West | Pooled Data | ||||||
| Model 1: Soil erosion | Model 2: Spoil erosion | Model 3: Soil erosion | |||||||
| B | t | Sign. | B | t | Sign. | B | t | Sign. | |
| Const. | -3.480 | .001*** | -1.699 | .091 | -.179 | -3.622 | .000*** | ||
| Forest activities[FA] | .222 | 2.831 | .000*** | .220 | 2.923 | .004*** | .195 | 3.844 | .000*** |
| Crops activities[CA] | .194 | 2.892 | .004*** | .222 | 3.315 | .001*** | .277 | 4.457 | .000*** |
| Livestock activities [LA] | .183 | 2.342 | .020** | .073 | .942 | .347 | .125 | 2.502 | .013** |
| Off farm activities [OA] | -.082 | -1.085 | .279 | .124 | .124 | .094 | .033 | .669 | .504 |
| F | 16.77 | ||||||||
| Adjusted R² | .113 | .168 | .137 | ||||||
a. Dependent Variables: Soil erosion
*** Significant at 1% level ** Significant at 5% level * Significant at 10% Level
3.2.1 Cropping Activities Influence on Soil Erosion
In Table III, regression analysis show that cropping activities cause soil erosion (B=0.277, t-values=4.457, p<0.05). Results also show that the effect of crop activities on soil erosion in both sites was significant (Kieni East [B=.194, t-values=2.892, p˂0.05], Kieni West [B=.222, t-values=3.315, p˂0.05]). Description results in Table I show that 30% and 60% of household belief over cropping has resulted in soil erosion. Over-cropping reduces the soils ability to produce valuable humus for soil fertility as it is constantly being ploughed or stripped for crop growth. One of the FGD participants summed it up thus:
…because of land over use as a result of small plot sizes, the soil has become very weak, hence low produce! (FGD Participant, Kamburaini Sub Location, Kieni East).
With less humus the soil dries out and is open for wind and rain erosion thus causing soil erosion on individual household farms. This finding is consistent with previous studies (Boardman, et. al., 2003) showing that farming practices associated with some crops encourage runoff and erosion. For example, cultivation of potatoes in rows and ridges channel runoff. Also there are certain agricultural practices that are environmentally unsustainable and can be the single biggest contributor to the general increase in soil quality decline, leading to reduced farm produce. The tillage on agricultural lands is one of the main factors since it breaks up soil into finer particles, which increase erosion rates. The favourable influence of reduced tillage system and of crop residues on soil erosion was also suggested by Lal, (2006), who showed that in no-tillage system, soil losses by erosion were close to the ones found in case of soil protection with 6 tonnes per hector of mulch. Furthermore, focused group discussions (FGDs) results show that some households farm on sloppy grounds which enhances the rate of soil loss as a result of farming activities. For instance studies carried out on a 9% slope Luvisol, in the Centre of Croatia, showed that ploughing on the upstream-downstream direction resulted in losing soil by erosion (Kisic, 2006). Other improper cultivation activities such as farming on steep slope and mono-cropping, row-cropping and surface irrigation wear away the natural composition of the soil and its fertility.
3.2.2 Forest Activities and Soil Erosion
Regression analysis in Table III show that forest activities cause soil erosion (B=0.195, t-values=3.844, p<0.05). Results also show that the effect of forest activities on soil erosion in both sites was significant (Kieni East [B=.222, t-values=2.831, p˂0.05], Kieni West [B=.220, t-values=2.923, p˂0.05]). According to 98% and 60% study respondents respectively, households experience soil erosion on their farms and recorded reduced farm product as a results of soil erosion. The forest is important source of livelihood for local communities, according to FGD results. It is from the forests where households obtain fuelwood, food, medicine, and construction materials. Studies have shown that local households are almost fully dependent on the forests, relying especially on the woodlands for their subsistence that may lead soil degradation. For instance, a study conducted in southwest Niger by Favreau, et. al., (2009), showed that land clearing increased surface runoff volume by a factor close to three. Therefore the removal of trees without sufficient reforestation has resulted in damage to habitat, biodiversity loss and drying of soil in the study area. One of the FGD participants emotionally declared:
“… watu wa mbali walikuja wakakata miti, pia mimi siwezi lala njaa kukiwa na miti …” (Loosely translated, people came from far and cut trees, and for me, I cannot sleep hungry and there are trees!). (FGD participant, Kamatongu Sub-location, Kieni West).
Also in apparent corroboration of the above finding, an aging FGD participant had this to say:
… when we settled here in the sixties, the forest was full of trees, but now … it is empty! (FGD Participant, Kamburaini Sub-location, Kieni East).
Also, Gicheru, et. al., (2012) found in their study in Kenya (Narok), that the loss of land cover (grass, bushes and trees) exposes the soil to erosion. FGD results also revealed that soil erosion and sedimentation are closely associated with forest activities. The participants observed that in recent times, the rivers in the area have filled with sediments as a result of flooding from the water catchment areas. This has been occasioned by the increasing demand for agricultural products, thus leading to the conversion of forests into farm fields and pastures. Such a transition from natural vegetation to agriculture causes soil erosion. A case in point, Kabanza, et. al., (2013) while working in South-Eastern Tanzania on land cover dynamics showed that as annual crops increased, natural vegetation lost large proportions of land, mostly bush land, wooded grassland or woodland, which had been converted to cashew orchards. Therefore land cover change can lead to an overall reduction of natural vegetation, which is a driver of soil erosion. During FGDs, it was observed that most of the crop varieties when compared to indigenous plants cannot hold onto the soil, suggesting that current cropping pattern cannot withstand pressure from moving water.
3.2.3 Livestock Activities Effect on Soil Erosion
Livestock kept by households include cattle, sheep, goats, and poultry, among others. Regression analysis show that livestock keeping causes soil erosion (B=.125, t-values=2.502, p<0.05)(Table III). Results in Table III also indicate that the effect of livestock activities on soil erosion in both sites was not the same. It was significant in Kieni East(B=.183, t-values=2.342, p˂0.05], but insignificant in Kieni West(B=.073, t-values=.942, p˃0.05]). Descriptive results also indicate that over 98% of respondents reported overgrazing as the major cause of soil erosion on their farms. The possible explanation for the difference in significance may lie in livestock population in the two sites. Household number of livestock (in tropical livestock unit[TLU] in Kieni West [7.97] was almost half that in Kieni West [12.48] in Kieni East at p<0.01. This means there is less trampling on the soil that leads to soil compaction which causes loss of soil through water runoff. Okoti, et. al., (2006) showed that there is increased gully erosion, especially near the mountain areas due to animal trampling. Amman, et. al., (2004) in Narok also report that high livestock levels result in degradation, especially during critical periods of drought. In an area with similar condition, Johansson, et. al., (2002) found that in the semi-arid catchment of Lake Baringo the change from cattle to goats resulted in the goats browsing on more bushes and twigs to survive in much harsher conditions, but leads to an even harder pressure on the remaining vegetation. Therefore overgrazing destroys surface plant cover and breaks down soil particles, increasing the rates of soil erosion. Further, it is vital to note that when soil is loosened by over grazing and vegetation rumpling, it can be subject to wind and water erosion.
CONCLUSION AND POLICY IMPLICATIONS
This study investigated the impact of household livelihood choices on soil erosion. We conclude that household forest, cropping, and livestock keeping activities lead to soil erosion outcomes because of over grazing and over cropping in the study area. Further, we conclude the three activities results into soil erosion at individual household farms. Our last conclusion from the study is that household livelihood activities lead to reduced farm yields of households as a result of soil erosion. Consequently, it is concluded that the main causes of soil erosion in the area are both on farm (cropping and livestock activities) and off farm (forest activities). These activities therefore are vital components for policy that aim to control soil erosion Kieni East and Kieni West respectively and enable the communities to benefit from Kenya Vision 2023 agenda under the Sustainable Development Goals.
Policies that target the regulation of the livelihood activities would contribute immensely towards soil erosion control in the study and similar areas. Relevant government and civil society agencies policies should target mitigation of over-cultivation as a soil erosion control measure by promoting the planting of cover crops that provide vegetative cover to the soil surface. To control overgrazing, we recommend policy makers to take plant-growth rate, natural processes of grazing lands and animal grazing behaviour into consideration; including promotion of sustainable grazing management styles that control over grazing as a cause of soil erosion. Secondly, relevant policy agencies at all levels should be supported to target efforts at household level that control soil erosion through strategies like mulching, planting a cover cropping, including annual grasses, small grains, legumes and other types of vegetation planted to provide a temporary vegetative cover. Finally, we advocate for policies that promote plans that reduce farm produce losses due to soil erosion at farm level through crop production on suitable lands; contour and terracing farming practices; vegetable plantation; mulching, switching to no or minimum tillage; rotational grazing; and switching to drip irrigation.
CONFLICT OF INTEREST
We declare that there is no conflict of interest whatsoever by the authors of the manuscript or any other entities by submitting this paper and by the publication of the same.
REFERENCES
- Amman, H.M. A., & Duraiappah, A.K.,2004. Land tenure and conflict resolution: A game theoretic approach in the Narok district in Kenya. Environment and Development Economics. 9. 383-407.
- Barbier, E.B.,2013. Wealth Accounting, Ecological Capital and Ecosystem Services. Environment and Development Economics. 18.133-161.
- Barbier, E.B.,2010. Poverty, Development, and Environment, Environment and Development Economics, 15(6), 635-660.
- Barbier, E.B.,2008. Poverty, Development, and Ecological Services. International Review of Environmental and Resource Economics, 2(1), 1-27.
- Barbier, E.B.,2003. Habitat-fishery linkages and mangrove loss in Thailand, Contemporary Economic Policy, 21(1), 59-77.
- Boardman, J., Evans, R., & Ford, J. 2003. Muddy floods on the South Downs, southern England: problem and responses. Environ. Sci. Policy, 6 (1), 69–83.
- DFID.,2000. Sustainable Livelihoods Guidance Sheets Sections 1-5. London: DFID.
- DFID.,1999. Sustainable Livelihoods Guidance Sheets. Sections 1-4. London: DFID.
- Ellis, F.,2000. Rural livelihoods and diversity in developing countries. Oxford, Oxford University Press.
- Ellis,F.,2000b. The determinants of rural livelihood diversification in developing countries. Journal of Agricultural Economics, 51(2), 289–302.
- Ellis, F., & Freeman, H.A. (eds).,2005. Rural Livelihoods and Poverty Reduction Policies. Routledge: London and New York.
- Favreau, G., Cappelaere, B., Massuel, S., Leblanc, M.,Boucher, M., Boulain, N., & Leduc,C. 2009. Land clearing, climate variability, and water resources increase in semiarid southwest Niger: A review. Water Resources Research,45(7), 10.1029/2007WR006785
- Gebru, G. W., & Beyene, F.,2012. Rural household livelihood strategies in drought-prone areas: A case of Gulomekeda District, eastern zone of Tigray National Regional State, Ethiopia. Journal of Development and Agricultural Economics. 4. 158–168. doi:10.5897/JDAE12.026
- Gicheru, P., Makokha, N., Le, C., Gachimbi, L. N., Wamuongo, J. W., McNeil, D., & Brouwer, F.,2012. Land subdivision and degradation in Narok, Kenya. Land Use Policies for Sustainable Development: Exploring Integrated Assessment Approaches, 148. Edward Elgar Publishing Limited, Cheltenham, UK
- Government of Kenya,2007. Kenya Vision 2030. Ministry of State for Planning, National Development, & Vision 2030 and Office of the Deputy Prime Minister and Ministry of Finance. Nairobi, Kenya.
- Heffernan, C., & Misturelli, F.,2000. The Delivery of Veterinary Services to the Poor: Preliminary findings from Kenya. (Report for DFID’s Animal Health Programme), London DFID.
- Hilson, G.,2016. Farming, small-scale mining and rural livelihoods in Sub-Saharan Africa: A critical overview. The Extractive Industries and Society. 3. 547–563. doi:10.1016/j.exis.2016.02.003
- Johansson J., & Svensson J., 2002. Land degradation in the semi-arid catchment of Lake Baringo, Kenya. Earth Sciences Centre, Goteborg University, Sweden.
- Kabanza, A., Dondeyne, S., Tenga, J., Kimaro, D., Poesen, E., Kafiriti, E., & Deckers, J. 2013. More people, more trees in South Eastern Tanzania: Local and global drivers of land-use/cover changes. African Geographical Review. 32. 44–58.
- Kanbur, R.,2003. Qualitative and Quantitative Poverty Appraisal: Complementarities, Tensions, and Way Forward. New Delhi: Permanent Black Publishers.
- Kenya National Bureaus of Statistical(KNBS),2010. Statistical Abstract, 2009, Nairobi, Government printer.
- Kisic, I., Basic, F., Mesic, M., Butorac, A., & Othmar, N. (2006). Water erosion under different crops in Croatia, International Soil Tillage Research Organisation 17th Triennial Conference – Kiel, Germany
- Kodiwo, M.O. & Okere, F.A.,2013. Analysis of Spatial Variations of Agricultural Land Use Intensity and Land Degradation in different Physiographic Regions. Asian Journal of Humanities and Social Sciences (AJHSS).1(1)
- Lal, R.,2006. Enhancing crop yields in developing countries through restoration of the soil organic carbon pool in agricultural lands. Land Degrad. & Develop. 17. 197-209
- Lufumpa, C.L.,2005. The Poverty-environment Nexus in Africa, African Development Review,17(3), 366-381.
- Mitova, T., Rousseva, S., & Tzvetkova, E.,(2006). Conservation Agricultural Practices for Soil Erosion Protection in Bulgaria – A Brief Review, International Soil Tillage Research Organisation 17th Triennial Conference. Kiel, Germany, 1053
- Moore, Andrew & Anderson, Brigham & Das, Kaustav & Wong, Weng-Keen. 2006. Combining Multiple Signals for Biosurveillance. 10.1016/B978-012369378-5/50017-X.
- Nasri, M., Sadat, F., Mohammad, J., & Hassan, A., (2009). Using Field Indices of Rill and Gully in order to Erosion Estimating and Sendiment Analysis (Case Study: Menderjan Watershed in Isfahan province, Iran) 38(1), 1-14.
- Okoti, M., Keya, G. A., Esilaba A. O., & Cheruiyot, H. (2006). Indigenous Technical Knowledge for Resource Monitoring in Northern Kenya. J. Hum. Ecol., 20(3), 183-189
- Rao, V.,2002. Experiments in Participatory Econometrics: Improving the Connection Between Economic Analysis and the Real World. Economic and Political Weekly. 1887–91.
- Republic of Kenya (RoK). 2001. Poverty Reduction Strategy Paper 2000 – 2003 Vols. I &II. Nairobi: Government Printer.
- Sharda, V.N., Mandal, D., & Ojasvi, P.R.,2013. Identification of the soil erosion risk areas for the conservation planning in different states of India. J Environ Biol. 34. 219–226
- Sherren, K., Loik, L., & Debner, J. A.,2016. Climate adaptation in “new world” cultural landscapes: The case of Bay of Fundy agricultural dykelands (Nova Scotia, Canada). Land Use Policy. 51. 267–280. `doi:10.1016/j.landusepol.2015.11.018
- UN,2015. The Millennium Development Goals Report, New York
- Wamicha, W.N.,1993. Land qualities influencing Agricultural production in the Kieni” intermontane” area, Nyeri district, Kenya. (Paper presented during the 3rd International Workshop of the African Mountains Association (AMA).
- World Bank. 2018. Poverty and Shared Prosperity 2018: Piecing Together the Poverty Puzzle. World Bank, Washington, D.C. World Bank.
- World Bank, 2007. World Development Report 2008: Agriculture for Development. Washington, DC. © World Bank.
APPENDIX 1
Table I. Sub locations and number of Households randomly selected for questionnaire survey
| A | B | C | D | E | F | G | H | |
| Strata/Ward | Cluster/Sub location | Sub Location Size | Cumulative Sum(a) | Clusters sampled | Probability 1 | Household per Sub Location | Probability 2 | Overall weight |
| Naromoru/
Kiamathiga |
Naromoru | 1161 | 1661 | 1200 | 32.4% | 40 | 2.4% | 1.3 |
| Ndiriti | 1094 | 2755 | ||||||
| Gaturiri | 1063 | 3818 | ||||||
| Rongai | 989 | 4807 | ||||||
| Kamburaini | 1813 | 6620 | 6330 | 35.3% | 40 | 2.2% | 1.3 | |
| Thigithi | 666 | 7286 | ||||||
| Murichu | 762 | 8048 | ||||||
| Gikamba | 1098 | 9146 | ||||||
| Kabendera | 830 | 9976 | ||||||
| Kabaru | Kirima | 1505 | 11481 | 11460 | 29.3% | 40 | 2.7% | 1.3 |
| Ndaathi | 1719 | 13200 | ||||||
| Kimahuri | 1961 | 15161 | ||||||
| Munyu | 1020 | 16181 | ||||||
| Thegu | Thungari | 1811 | 17992 | 16590 | 35.3% | 40 | 2.2% | 1.3 |
| Lusoi | 605 | 18597 | ||||||
| Thirigitu | 1446 | 20043 | ||||||
| Maragima | 872 | 20915 | ||||||
| Gakawa | Gathiuru | 1609 | 22524 | 21720 | 31.4% | 40 | 2.5% | 1.3 |
| Githima | 1363 | 23887 | ||||||
| Kahurura | 5125 | 29012 | ||||||
| Mweiga/Mweiga
|
Bondeni | 367 | 29379 | 26850 | 7.2% | 40 | 10.9% | 1.3 |
| Amboni | 1194 | 30573 | ||||||
| Njengu | 784 | 31351 | ||||||
| Kamatongu | 2915 | 34272 | 31980 | 56.8% | 40 | 1.4% | 1.3 | |
| Gatarakwa | Watuka | 1126 | 35398 | |||||
| Lamuria | 1366 | 36764 | ||||||
| Embaringo | 1217 | 37981 | 37110 | 23.7% | 40 | 3.3% | 1.3 | |
| Kamariki | 1809 | 39790 | ||||||
| Endarasha/
Mwiyogo |
Mitero | 901 | 40691 | |||||
| Charity | 1456 | 42147 | ||||||
| Gakanga | 569 | 42716 | 42240 | 11.1% | 40 | 7.0% | 1.3 | |
| Endarasha | 1907 | 44623 | ||||||
| Kabati | 701 | 45324 | ||||||
| Muthuini | 571 | 45895 | ||||||
| Labura | 1494 | 47389 | 47370 | 29.1% | 40 | 2.7% | 1.3 | |
| Mwiyogo | 471 | 47860 | ||||||
| Mugunda | Karemeno | 538 | 48398 | |||||
| Ruirii | 993 | 49391 | ||||||
| Kamiruri | 722 | 50113 | ||||||
| Nairutia | 1191 | 51304(b) | ||||||
| TOTAL | 10 | 400 |