
Structural and Stratigraphic Reservoir Characterization of “MONI” Field¸ Niger Delta.
- Yemisi C. Ajisafe
- Victor O. Towoju
- Dotun E. Ogunrinde
- Opeyemi E. Folorunso
- Oluwaseun V. Omoyemi
- 104-119
- Apr 2, 2024
- Earth Science
Structural and Stratigraphic Reservoir Characterization of “MONI” Field¸ Niger Delta.
Yemisi C. Ajisafe, Victor O. Towoju, Dotun E. Ogunrinde, Opeyemi E. Folorunso, Oluwaseun V. Omoyemi
Ekiti State University, Ado-Ekiti
DOI: https://doi.org/10.51244/IJRSI.2024.1103010
Received: 20 February 2024; Revised: 06 March 2024; Accepted: 11 March 2024; Published: 03 April 2024
ABSTRACT
Reservoir characterization of “MONI” field of the Niger Delta has been carried out using well log and seismic data. The study is aimed at delineating structural and stratigraphic features associated with hydrocarbon entrapment of the field. Lithostratigraphic correlation reviewed two main lithologies which are reservoir sands and seal shales. Well log correlation and interpretation across the field indicates – main stratigraphic bounding surface which include two sequence boundaries and one maximum flooding surface. This indicates about three depositional sequences exists in the study area. Stacking patterns (progradation, retrogradation, and aggradation) were delineated and interpreted as lowstand system tract (LST), highst and system tract (HST), and transgressive system tract (TST). The alternation of LST, HST and TST offers good reservoir and seal for the hydrocarbon accumulation. The depositional environment of the reservoirs ranges from subaerial channel deposits, barrier bar, tidal channel sands to delta distributary channel fill. Subaerial channel deposits have a bad reservoir quality, tidal channel sands possess a fair reservoir quality while delta distributary channel fill have a good reservoir quality. Petrophysical analysis shows that three reservoirs delineated have a porosity ranging from 19.37% to 23.62%, permeability ranging from 1408.71 to 1855.36 mD, a Net-to-Gross ranging from 0.46 to 0.88, volume of shale ranging from 11.72% to 24.92%, Water saturation ranging from 37.24% to 47.96% and hydrocarbon saturation ranging from 52.04% to 62.76%. Structural interpretation reviewed four main faults that serves as traps to the accumulation of hydrocarbon. Three hydrocarbon bearing sands were interpreted in the seismic volume. Time and depth structure maps show that the hydrocarbon bearing structure is a fault assisted anticlinal structure. Seismic facies analysis reviewed five facies. The study concluded that structural and stratigraphic features can be used to characterize reservoirs.
Keywords: Reservoir characterization, structural features, facies analysis, hydrocarbon entrapment, depositional sequences
INTRODUCTION
Reservoir characterisation and subsurface geological mapping are perhaps the most important tools used to explore for undiscovered hydrocarbons and to develop proven hydrocarbon reserves (Oyedele et al, 2013). Reservoir characterisation is the study of reservoir properties using geologic, geophysical, petrophysical, and engineering disciplines, including uncertainty analysis of geologic and engineering data and spatial variations to describe petroleum deposits and the nature of the rocks that contain hydrocarbon (Lines and Newrick, 2004).
Two important aspects of reservoir characterization are: (1) characterization of the reservoir’s geometric features, including structural and stratigraphic controls and depositional facies bodies, and (2) characterization of petrophysical properties, including porosity, fluid saturation, and permeability. Stratigraphic reservoir characterization is basically the stratigraphic interpretation of seismic data based on the properties of seismic reflections (Vail, 1987) while the role of structural reservoir characterization in the location and definition of hydrocarbon reservoir is to define the geometry and spatial organization of structures like faults that determines the presence of hydrocarbon, reservoir permeability and reservoir porosity (Cosgrove, 1998; Lines and Newrick, 2004). The characterization of reservoirs requires the integration of different types of data. Seismic data can contribute to a well-defined geometric description of structural and stratigraphic aspects of the reservoir. The result of this study will provide valuable information as regards the reservoir characterization of “Moni” Field structurally and stratigraphically.
GEOLOGY OF THE AREA
The Niger Delta Basin covers an area of about about 300,000km2 and a sediment volume of about 500,000km3 and it composed of an overall regressive clastic sequence that reaches a thickness of 9 to 12km (29,500 to 39,400ft) (Hospers, 1965; Kulke, 1995). The Niger Delta is divided into three formations, representing prograding depositional facies that are distinguished mostly on the basis of sand-shale ratios (Adiela, 2016; Fig.1). The Akata Formation is the basal unit composed of marine shales believed to be the source rock within the basin. The Agbada Formation is made up of alternating sandstone, siltstone and shale sequences that constitute the petroleum reservoir of the basin. On the other hand, the Benin Formation largely consists of non-marine sands with a few shaly intercalations (Odoh et al., 2012). The basin is bounded to the west and northwest by the western African shield, which terminates at the Benin hinge line and to the east, by the Calabar hinge line. The Anambra basin and Abakaliki anticlinorium mark its northern limit and to the south, it is bounded by the Gulf of Guinea (Oyedele et al., 2013).
From Eocene to Recent, the delta has prograded southward, forming depobelts that represent the most active portion of the delta at each stage of development (Doust and Omatsola, 1990). The Delta has only one identified petroleum system referred to as the Tertiary Niger Delta (Akata – Agbada) petroleum system (Avbovbo, 1978; Kulke, 1995). The Niger Delta province is the twelfth richest in petroleum resources, with 2.2% of the world’s discovered oil and 1.4% of the world’s discovered gas (Petroconsultants, Inc. 1996a).
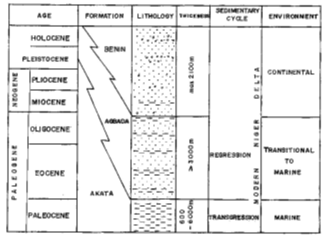
Fig. 1. Generalized Lithostratigraphy of Niger Delta (Nwangwu, 1990).
METHODOLOGY
The datasets available for this study include 3D Seismic data (Fig.2) and Well Log data which comprises well deviation data for seven wells, Checkshot data for well Moni-7, well logs – Neutron Log, Resistivity Log etc. and well head data for all the wells (Table 1). Interpretation of datasets was done using commercial Petrel software which is an interactive software for well correlation, to estimate all the parameters needed for the petrophysical characterization of reservoirs and other analysis done in the study.
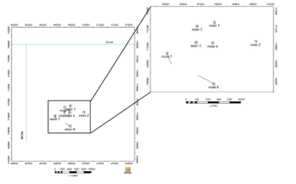
Fig. 2. Base map of the study area showing the location of each well and the seismic lines
Table 1. Available Well Log Data
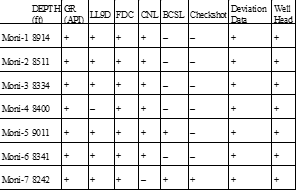
Where “+” means available and “–” represents not available.
GR – Gamma ray log, LL9D – Resistivity log,
FDC – Density log, CNL – Compensated Neutron log,
BCSL – Sonic log.
Well Log Analysis
Correlation of the wells was done both in both N-S and W-E direction (Figure 6 and Figure 7). Three reservoirs were identified and correlated and across the seven wells. The gamma ray log was used to discriminate shale units from sand units. The gamma ray log measures the number of radioactive elements present in a formation. Deflections to the right indicates high radioactivity while deflections to the left indicate lower radioactivity. Resistivity log was used to determine fluid contents and identifying pore fluid types. Density and neutron log crossplot were used to identify the type of hydrocarbon present, while the density and sonic logs were used to generate synthetic seismogram. Wells were correlated and carefully tied to the seismic data using the checkshot data. Horizon/events were mapped, interpreted and correlated all through the study area. Horizon picks were done iteratively in in-line and cross-line directions. Difficulty in picking some of the time domain horizons was encountered due to heterogeneity in the seismic response. This heterogeneity is often present in the form of discontinuous reflection event. The presence of these faults in the study area is an indication that there is a possibility of hydrocarbon accumulation. From the horizon and fault interpretation, time structure maps were produced. Mapped horizons and the generated fault polygons were used to generate depth structural maps for the three reservoirs.
Evaluation of Petrophysical Parameters
Petrophysical evaluation is essential in the oil industry because accurate formation evaluation enables reserve development models for optimal well production and management (Ehinola et al., 2017). The Petrophysical Parameters to be determined includes: Volume of Shale, Porosity, Permeability, water saturation, Net to Gross, Water Saturation and Hydrocarbon Saturation.
- Shale Volume
Shale volume is used to evaluate the shale distribution of a reservoir (Islam et al., 2014). The volume of shale is very important to note because it is used to evaluate other petrophysical parameters like reservoir net thickness, irreducible water saturation (Swirr), effective porosity and thus the permeability. The gamma ray index (IGR) was determined from the equation below:
![]() ………………….(1) (Schlumberger, 1974)
………………….(1) (Schlumberger, 1974)
where: IGR = Gamma ray index; GRlog = Reading of Gamma ray log; GRmax = maximum gamma ray (shale) reading; GRmin = minimum gamma ray (clean sand) reading.
![]() ………..……(2) (Larionov, 1969)
………..……(2) (Larionov, 1969)
- Porosity
Porosity (ϕ) is defined as the pore volume per unit volume of formation or rock. It is also the percentage of the total volume of the rock that is occupied by pores (Asquith and Krygowski, 2004)
The porosity was calculated from density log using
![]() ……………………(3) (Dresser, 1979)
……………………(3) (Dresser, 1979)
![]() …………..(4) (Dresser, 1979)
…………..(4) (Dresser, 1979)
where: Φtot = total porosity; Φeff = effective porosity, ρma is the matrix density = 2.65g/cm3 (sandstone); ρfl is the fluid density= 1.0g/cm3 ; ρb = formation bulk density.
- Water Saturation
Fluid Saturation is the fraction of the formation pores volume occupied by formation Fluid (Adekunle and Elileojor, 2017). In petroleum reservoirs, the fluids are usually water and hydrocarbons. The relative volumes of water and hydrocarbons in the pore volume of the reservoir rock are designated as saturations. Water saturation in the reservoir rock is the fraction of the pore volume occupied by water. Hydrocarbon saturation in the reservoir rock is the fraction of the pore volume occupied by hydrocarbons (Ramesh, 2016).
Sw=0.082/∅tot………………………(5) (Udegbunam and Ndukwe, 1988)
Sh = 1- Sw …………………………(6)
- Permeability
Permeability (K) is a measure of the ease with which a fluid of given viscosity can flow through a formation (Ologe, 2016).
F=0.62/∅2.5………………..…(7)
![]() ………………..…………….(8)
………………..…………….(8)
![]() ………………………….(9)
………………………….(9)
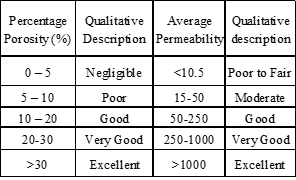
where K is the Permeability, Swi is irreducible water saturation and Φ is effective porosity. Table 2 gives the porosity and permeability values range for characterizing reservoirs.
Table 2. Porosity And Permeability Values for Reservoirs Qualitative Description (Rider, 1986)
- Net to Gross
This is a measure of the thickness of the productive (Net) reservoir sands within the Total (Gross) reservoir thickness. The N/G is expressed as a ratio.
NTG= (Net Sand)/(Gross Sand)…………………. (10)
Well Log Lithofacies Identification
The identification of lithofacies and depositional environments from well logs is based on the principle that well log responses are related to changes in the grain size, thickness, texture, and lithology along the well path (Nton and Rotimi, 2016; Abbey and Orenuga, 2017; Fig.3). Shapes on the gamma ray log can be interpreted as grain-size trends and, by sedimentological association as facies successions. A decrease in gamma ray values will indicate an increase in grain size: small grain sizes will correspond to higher gamma ray values.
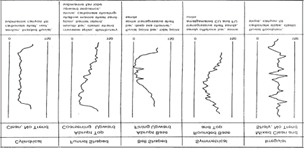
Fig. 3. Idealized Gamma Ray Log Curve Shapes and the Depositional Settings in which they can Originate (Rider, 1999)
Structural Interpretation
Seven faults were picked named F1, F2, F3, F4, F5, F6 and F7. Three horizons were identified. After the horizons were picked, time structure and depth structure maps were reviewed to conduct the structural interpretation of the horizons. A graph of depth (Z) versus the two way travel time (TWT) of the checkshot data (with equation y = -352.959 + 2.49114x – 0.000715059x2) was used to convert the time maps to depth maps.
Seismic Sequence
Seismic Sequences were identified using the reflection pattern of the seismic section as shown in Fig. 4.
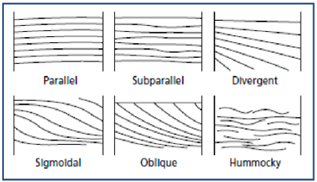
Fig.4: Internal Bedforms that Typifies Different Seismic Sequence within Sedimentary Sequences (Mitchum et al. 1977).
RESULTS AND DISCUSSION
Well Correlation
The three reservoirs delineated as R1, R2 and R3 (Figs. 5 and 6). From the well log correlation, it was found that in well Moni-7, all the reservoirs have a low resistivity reading which is suggestive of absence of hydrocarbon in well Moni-7.
Reservoir R1 is shallowest in well Moni-6 where it occurs between depth 7887ft to 7970ft (thickness of 83ft) and deepest in well Moni-1 between depth 7143ft to 7887ft (thickness of 744ft). Reservoir R1 contains both oil and gas but has a low amount of sand compared to other reservoirs.
Reservoir R2 is shallowest in well Moni-7 where it occurs between depth 7028ft to 7309ft (thickness of 281ft) and deepest in well Moni-6 between depth 6977ft to 7415ft (thickness of 438ft). The reservoir contains mostly oil in all the wells.
Reservoir R3 is shallowest in well Moni-5 where it occurs between depth 6018ft to 6510ft (thickness of 492ft) and deepest in well Moni-6 between depth 6261ft to 6846ft (thickness of 585ft). In well Moni-5 and well Moni-6 the reservoir contains only oil but in well Moni-2 the neutron-density crossplot shows the presence of gas while the well log for wells Moni-3, Moni-4 and Moni-3 did not provide the neutron-density crossplot for the top of the the reservoir.
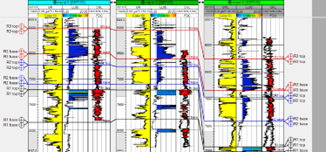
Figure 5: Reservoir correlation across well 5, well 3 and well 6
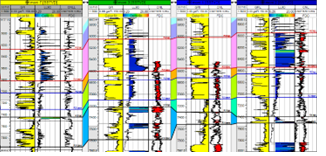
Figure 6: Reservoir correlation across well 7, well 3, well 4 and well 2
Petrophysical Evaluation
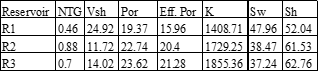
The values of the petrophysical parameters for all the reservoirs are given in Table 3. Table 4 gives the average values for the three reservoirs. The average porosity ranges from 19.20 to 23.60 which are in the range of Good to Very good reservoirs according to Rider (1986) classification (Table 4). The average Net-to-Gross varies between 0.46-0.88, the average effective porosity varies between 15.96 – 21.98, the average water saturation varies between 37.24 – 48.26 and the average hydrocarbon saturation varies between 51.74% and 62.76%. The permeability is very high ranging from 1408.71-1855.36 milli-darcy. Using the classification of Rider (1986), the reservoirs have an excellent permeability.
Table 3. Computed Petropysical Parameters
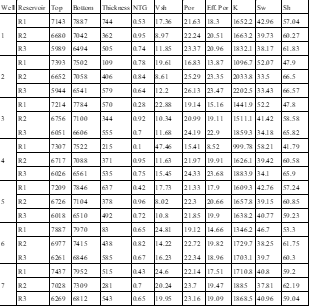
Table 4. Average Computed Petropysical Parameters for Well the Reservoirs
Structural Analysis
- Fault Interpretation
Fig.7 – Fig. 10 show the seven faults that were picked namely F1, F2, F3, F4, F5, F6 and F7. F1 extends through the map east to west. Faults F1, F2, F4 and F5 are major faults while Faults F3, F5 and F6 are minor faults
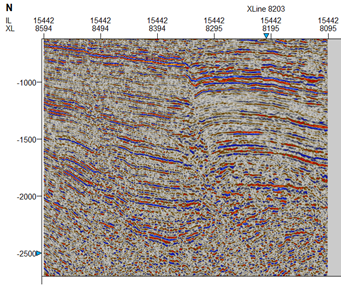
Fig. 7. Raw seismic Cross line 8203 section
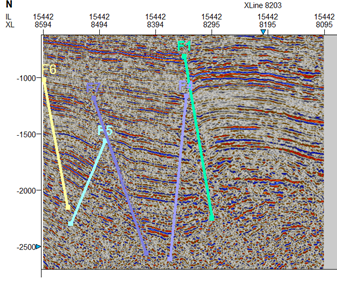
Fig.8. Seismic Cross line 8203 Section Showing Faults F1, F5, F6 and F7
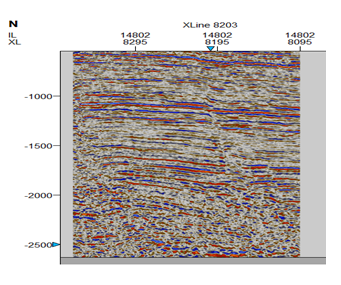
Fig.9. Raw Seismic Cross line 8203 Section
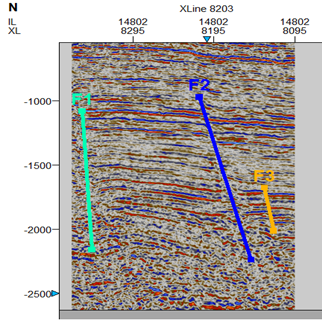
Fig. 10: Seismic Cross line 8203 Section showing Faults F1, F2 and F3
- Seismic to Well Tie
Fig.11 shows the synthetic seismograph that was generated using the check shot data, sonic log and the density to tie well Moni-7 to seismic.
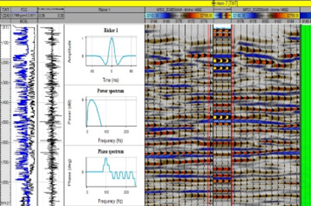
Fig.11.Synthetic seismograph of well 7, generated using check shot data.
- Depth Maps
Fig. 12 to Fig. 14 shows the depth structure contour maps for the time structure maps. The colour ranges from red to purple, where red colouration represents places with lower elevation depth and ranges to purple colouration which represent places with higher elevation depth. All the maps are dipping from the North-East direction (lower elevation depth red colouration) to the South-Western direction (higher elevation depth blue to purple colouration) but an anticline structure is present in the southern part of map for Horizon R1 and R2 where the wells are located.
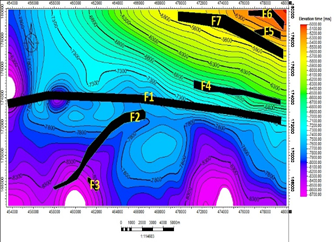
Fig. 12. Depth map for Horizon R1
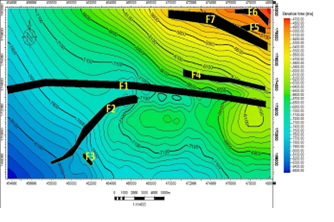
Fig. 13. Depth map for Horizon R2
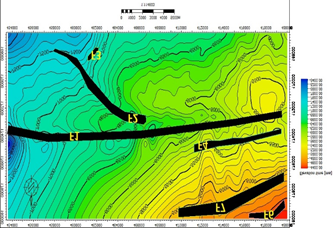
Fig.14. Depth map for Horizon R3
Sequence Stratigraphy
Facies Analysis From Log
From the well log Facies analysis it is found that Reservoir R1 is a Subaerial Channel Deposit (Fig. 15), Reservoir R2 is a Delta Distributary Channel Fill deposit except in well Moni-7 where it is a Tidal Chanel (TC) deposit (Fig. 16). Reservoir R3 is a Delta Distributary Channel Fill (DDCF) and Tidal Channel Deposit (Fig. 17). Two sequence boundaries and one maximum Flooding Surface was identified (Fig. 18). Subaerial channel deposits are known as bad hydrocarbon reseervoirs, reservoir R1 which is a subaerial channel reservoir have an hydrocarbon saturation as low as 41.70% in well Moni-4.
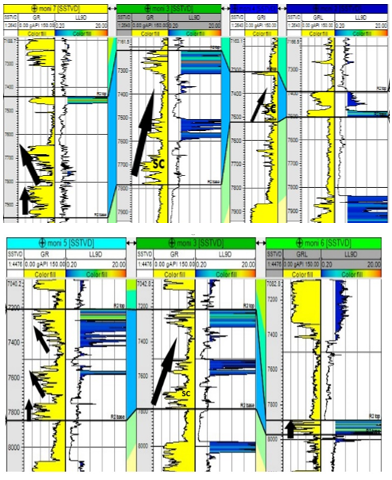
Fig. 15. Depositional Environment for Reservoir R1
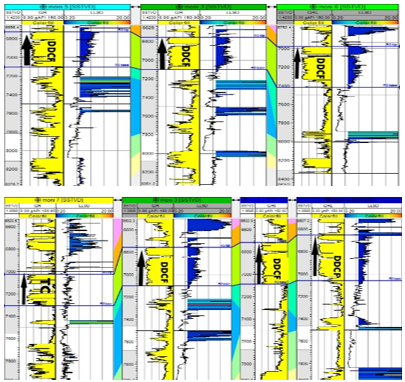
Fig.16. Depositional Environment for Reservoir R2
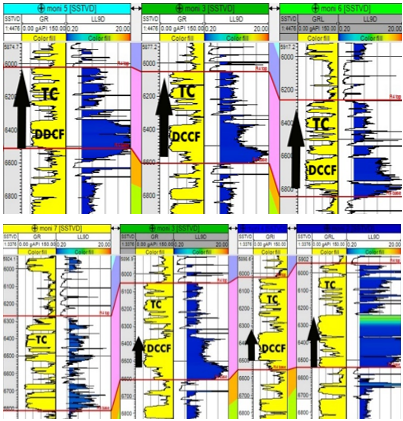
Fig. 17. Depositional Environment for Reservoir R3
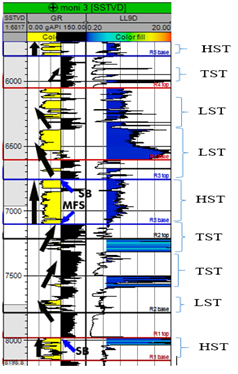
Fig. 18. Facies analysis from log using well Moni-3
(HST – Highstand system tract, TST – Transgressive system tract, LST – Lowstand system tract)
Seismic Facies Analysis
Six seismic facies were recognized using the characteristic of amplitude, frequency, and continuity and reflection configuration. Labelled A, B, C, D, E and F (Fig.19). The facies were defined primarily on the basis of seismic reflection patterns and the amplitude of their reflections.
The chaotic reflection beneath facie A is probably the basement. The base of Facie A is charcterized by a hummocky and chaotic, highly discordant and discontinous medium to high reflection, beneath Facie B there is a generally very chaotic reflection pattern, beneath Facie C we have a subparallel discontinous wavy reflection, beneath Facie D we have a subparrallel dicontinous reflection while beneath Facie E and Facie F we have a continous parrallel and subparallel reflection (Fig. 20.
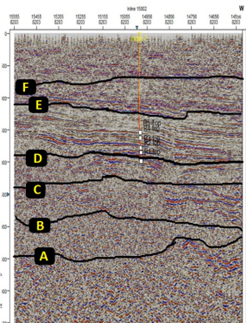
Fig. 19. Seismic inline 15002 section showing the marked facies
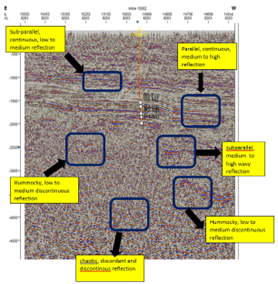
Fig. 20. Seismic Inline 15002 Section showing the seismic facies
CONCLUSION
Structure and Stratigraphic analysis from well logs and 3-D Post stack time migrated seismic data has been used to characterize “Moni” field. Three reservoirs (R1, R2 and R3) were identified from the well log analysis and lithostratigraphic correlation was carried out for the reservoirs. The well was then tied to seismic using the checkshot data to map the top of the reservoirs.
Petrophysical analysis shows that three reservoirs delineated have a porosity ranging from 19.37% to 23.62%, permeability ranging from 1408.71 to 1855.36 mD, a Net-to-Gross ranging from 0.46 to 0.88, volume of shale ranging from 11.72% to 24.92%, Water saturation ranging from 37.24% to 47.96% and hydrocarbon saturation ranging from 52.04 to 62.76. The petrophysical analysis showed that the reservoirs are of good quality.
Time structure and depth structure maps were reviewed for the mapped horizons. Seven faults were picked, named F1, F2, F3, F4, F5, F6 and F7. Four of the faults (F1, F2, F4 and F5) are regional faults while three faults (F3, F5 and F6) are local faults. The structural analysis indicate that the closure are fault dependent. Anticlinal closure and fault assisted closures which are known as a good hydrocarbon prospect were recognized in the depth structure contour maps.
Two sequence boundary, one maximum flooding surface, two transgressive system tract, three highstand system tract and three low stand system tract were identified. Six seismic facies were also identified (labelled A, B, C, D, E and F). Well log facie analysis also indicates that the depositional environment of the reservoirs ranges from subaerial channel deposit, barrier bar deposit, and tidal channel deposit to delta distributary channel fill. Tidal channel sands usually possess a fair to good reservoir quality due to their high degree of heterogeneity while delta distributary channel fill are good reservoirs because they are of a relatively higher porosity. Only reservoir R1 is a subaerial channel deposit.
REFERENCES
- Abbey, C. P. and Orenuga, I. A. (2017). Identification of Lithofacies and Depositional Environment: Case study of Teger Oil Field Niger Delta. Petroleum Technology Development Journal. 7(1): 287-309
- Adekunle, S. and Elileojor, E. O. (2017). Use Of Seismic Attributes and Well Logs Data in Quantitative Reservoir Characterization of K-Field, Onshore Niger Delta Area, Nigeria. IOSR Journal of Applied Geology and Geophysics (IOSR-JAGG). 5(5): 63-72
- Adiela, U. P. (2016). Reservoir Characterization of X-Field, Onshore, Niger Delta. International Research Journal of Interdisciplinary & Multidisciplinary Studies (IRJIMS). 2(2): 83-89
- Asquith, G. and Krygowski, D. (2004). Relationships of Well Log Interpretation in Basic Well Log Analysis Method in Exploration Series: American Association of Petroleum Geologists Memoir 16: 14p
- Avbovbo, A. A. (1978). Tertiary Lithostratigraphy of Niger Delta. American Association of Petroleum Geologists Bulletin, 62: 295-300
- Coleman, J. M. and Prior, D. B. (1980). Deltaic sand bodies. AAPG Note series 5: 195p.
- Cosgrove, J. W. (1998). The rode of structural geology in reservoir characterization. In: Coward, M. P., Daltaban, T. S. & Johnson, H. (eds) Structural Geology in Reservoir Characterization. Geological Society, London Special Publications. 127: 1-13.
- Doust, H. and Omatsola, E. (1990). Niger Delta, In: – Edwards, J. D., and Santogrossi, P.A., Eds., Divergent/Passive Margin Basins. AAPG Memoir 48: 239-248.
- Dresser, A. (1979). Log interpretation charts. Houston Dresser Industries Inc. 107p.
- Ehinola, O. A., Ogunsakin, O. M. and Olopade, E. O. (2017) Petrophysical Evaluation Using Well Logs 3D Models and Mud Log Hydrocarbon Typing Analysis: Case Study of an Onshore Niger Delta Field. Journal of Environment and Earth Science. 7(4). P332-341
- Emery, D and Myers, K. J. (1996). Sequence Stratigraphy. 2nd ed. Blackwell Science Ltd. p47-98
- Gatliff, R. W., Hitchen, K., Ritchie J. D. and Smythe, D. K. (1984) Internal structure of the Erlend Tertiary volcanic complex, north of Shetland, revealed by seismic reflection. Journal Geological Society of London 141: 555–562.
- HWU. (2005). Petroleum Geoscience,1st ed. Heriot-Watt University, Institute of Petroleum Engineering, Edinburgh. p453-468
- Islam, T. A., Islam, M. A., Tasnuva A., Biswas, R. K. and Jahan, K. (2014) Petro physical parameter studies for characterization of gas reservoir of Narsingdi gas field, Bangladesh. International Journal of Advanced Geosciences, 2 (2): 53-58.
- Kaplan, A., Lusser, C. U.and Norton, I. O. (1994). Tectonic map of the world, American Association of Petroleum Geologists, Tulsa. panel 10, scale 1:10,000,000.
- Kulke, H., (1995) Regional Petroleum Geology of the World. Part II: Africa, America, Australia and Antarctica: Berlin, Gebrüder Borntraeger, pp 143-172.
- Larionov, V. V. (1969). Borehole Radiometry. National Electric Drag Racing Association. 27: 345pp
- Mitchum, R. M., Vail, P. R. and Thompson, S. (1977). Seismic stratigraphy and Global changes of sea level, Part 2: The depositional sequence as a Basin unit for stratigraphic analysis: in Payton, C. W: Seismic stratigraphy – application to hydrocarbon exploration: American Association of Petroleum Geologists Memoir 26: 53 – 62
- Nelson, C. S and James, N. P. (2000). Marine Cements in Mid-Tertiary cool-water shelf limestones of New Zealand and Southern Australia. Sediment 47: 609-629.
- Nton, E. and Salami S. (2016). Reservoir Characteristics and Palaeo-Depositional Environment of Duski Field, Onshore, Niger-Delta. Global Journal of Geological Sciences 14: 49-68
- Odoh, B. I, Onyeji, J. and Utom, A. U., 2012. The Integrated Seismic Reservoir Characterization Study in Amboy Field of Niger Delta Oil Field – Nigeria. Geosciences 2012, 2(3): 60-65
- Ologe O. (2016) Reservoir Evaluation of “T-X” Field (Onshore, Niger Delta) From Well Log Petrophysical Analysis. Bayero Journal of Pure and Applied Sciences, 9(2): 132 – 140
- Oyedele, K. F., Ogagarue, D. O. and Mohammed, D. U. (2013). Integration of 3D Seismic and Well log Data In the Optimal Reservoir Characterisation of EMI Field, Offshore Niger Delta Oil Province, Nigeria. American Journal of Scientific Industrial Research, 4(1): 11-21
- Petroconsultants (1996a). Petroleum Exploration and Production Database: Houston, Texas, Petroconsultants, Inc.
- Ramesh, A. (2016) Well logging Principles, Interpretation and Applications. MSc. Thesis, Dr Br Ambedkar University Srikakulam
- Rider, M. (1986). The Geological Interpretation of Well Logs. Blackie Glasgow Publishers. p151-165.
- Rider, M.H. (1999). Geologic interpretation of well logs, 2nd ed. Whittles Publishing Services. p65-68
- Selley, R. C. (1998). Elements of Petroleum Geology, 3rd edition. Freeman and Company Publishers. p37-299.
- Shell. (1982). Well Log Interpretation. p11-13.
- Vail, P. R. (1987), Seismic stratigraphy interpretation procedure, in Bally, A. W. (ed.), Atlas of seismic stratigraphy: American Association of Petroleum Geologists: Studies in Geology, 27(1): 1-10.
- Veeken, P. C. (2007) Seismic Stratigraphy, Basin Analysis and Reservoir Characterisation (Seismic Exploration 37). 1st edition. Elsevier publications. p355-418
- Weber, K. J. and Dakoru E. M. (1975) Petroleum geology of the Niger delta: proceedings of the Ninth World Petroleum Congress. Applied Science Publishers. p210–221