
Vulnerability to Risk of Gully Erosion on Transportation Routes and Landed Properties in Benin City Nigeria
- Olisa C. L
- Olisa B. S
- Enyinda C. A
- 220-234
- Feb 5, 2024
- Transportation
Vulnerability to Risk of Gully Erosion on Transportation Routes and Landed Properties in Benin City Nigeria
Olisa C. L1, Olisa B. S2, Enyinda C. A3
1Department of Urban and Regional Planning, Federal University of Technology, Akure
2,3Logistics and Transport Technology, Federal University of Technology, Akure
DOI: https://doi.org/10.51244/IJRSI.2024.1101018
Received: 26 December 2023; Accepted: 03 January 2024; Published: 05 February 2024
ABSTRACT
The Edo State Ministry of Environment registered 25 gully erosion sites in Benin City. The impacts of some of them have been very detrimental to lives, destroying roads and properties worth billions of Naira. Despite the treat to lives, properties, and accessibility, many are still living around the gullies. The study examined the perceptions of the population at risk and their preparedness to relocate. Questionnaire, GPS, Field measurement, and Google Earth Image were used as data sources to accomplish the objective of the paper. The result indicates that there is a high level of perception among the population at risk. Residents’ perceived vulnerability to gully hazards is directly related to their proximity to the hazard point, while the level of residents’ preparedness to vacate the gully environment is directly related to perceived vulnerability and financial capability. The study result was depicted in map form. Though managing the gully erosion hazard is beyond the capability of the residents within the neighbourhoods, government intervention has been very poor. The study recommended the relocation of populations at risk, while advance drainage designs and construction be executed in order to put an end to the gully.
Keywords: Gullies, roads, properties, hazard, vulnerability and exposure, risk, transportation.
INTRODUCTION
Gullies represent some of the most destructive forms of erosion, destroying soil, undermining infrastructure, damaging farmlands, altering transportation corridors, and lowering water tables (Valentin et al., 2005). Gully erosion affects sediment budgets and flux rates and influences stream dynamics, as evidenced by hydrograph data (Costa and Bacellar, 2007; Perroy, Bookhagen, Asner, and Chadwick, 2010). The Edo State Ministry of Environment identified 25 erosion sites within Benin metropolis. While some of these are still minor environmental problems, Others are major and devastating (Odjugo, 2022). In Nigeria, the federal and state governments have attempted to give gully erosion problems some attention, even though it is inadequate. The threat of damages to property, enterprise, and human life has made the relevance of gully erosion management of great importance in disaster research literature. Thus, hazard management has incorporated various approaches to addressing this environmental problem. A major aspect of the hazard management scheme is the assessment and management of the risks associated with the given hazard in question and how it cuts across its various stakeholders. Hence, assessing risk is a process of evaluating the risks arising from a hazard, taking into account the adequacy of any existing controls, and deciding whether or not the risks are acceptable. (Rout & Sikdar, 2017)
Risk is the probability of loss, the likelihood of a specific hazard occurring, and its consequences on humans and property. The risk incurred depends on three independent elements: “hazard, vulnerability, and exposure”, (Xiaodong, Qiuhua, Richard, & Xia, 2022). Risk perception is referred to as intuitive risk judgments, which most people utilize to assess the potential impacts and consequences of a hazard (Slovic, 1987). The concept of risk perception also involves social perception of risk, which reflects the adjustment choices and coping capacity of those at risk (Slovic, 1987; Blaikie, Cannon, Davis, and Wisner, 1994). Meanwhile, socio-cultural characteristics are considered contributing factors to varying degrees of people’s reactions and behaviors in judging the magnitude of risks. The cultural and economic background influences the perception and people’s attitude toward natural hazards, even when they have similar characteristics (Palm, 1998). Pallaris (2000) states that despite the knowledge acquired and the many technological advances, the threat of degradation remains as pertinent as ever, and one of the main reasons for this is that high-risk areas are not being effectively and efficiently identified by the existing erosion risk models. Although gully erosion studies in Benin has been examined by various researchers who focused on various aspect such as the financial implications of its environmental degradation (Odjugo 2012), the structural pattern of the erosion sites such as its initiation point. slope-area relationship, and threshold of gully initiation and volume of soil lost (Ehiorobo and Izinyon, 2012), risk assessment of Gully site, severity of erosion and vulnerability analysis (Aderemi and Iyamu, 2013), and causes. types of soil erosion and the management techniques that will help to ameliorate its hazard (Esiegbe and Gbakeji, 2014), none of these studies has examined the relevance of risk perception studies in gully erosion risk management in Benin City.
RELATED LITERATURES
Understanding the way that the public perceives risk is key to answering the question and solving the threats faced by the locally affected population. The scientific estimate of the risk will not provide an answer to the perceived risk of the public associated with these hazard scenes. Participation is a vital component of a risk governance methodology that combines the best expertise with an inclusive approach towards addressing risk perceptions and stakeholder concerns. Thus, this study is poised to examine and map the level of residents’ risk perception and preparedness for gully erosion hazards in the selected study sites using participatory and geo-spatial tools. These are tools that effectively communicate the level of’ perceived risk of the locally affected population and are significant mediums for risk management and policy making. A hazard is defined as a potentially damaging physical event, phenomenon, or human activity that may cause the loss of life or injury, property damage, social and economic disruption, or environmental degradation (Public Safety Canada, 2017). This event has a likelihood that it will occur in a specific area, within a given time frame, and with a given intensity (UN-ISDR, 2002). A hazard is a generic source of danger that can arise from an occurrence or process that occurs naturally or is caused by humans and has the potential to cause loss. Accordingly, a risk (or consequence) is the likelihood that a certain danger may materialize (Sahni, Dhameja, and Medury, 2001); also, a hazard is any source that could cause injury, damage, or unfavorable health effects to something or anybody (CCOHS, 2023).
The majority of risks are hypothetical or dormant, posing just a theoretical chance of risk; once a hazard becomes “active,” though, it may create an emergency. An event is a dangerous circumstance that has manifested. Risk is the result of the interaction between possibility and hazard (Mikulas 2013). Gully erosion is a significant risk factor that has the ability to accelerate the erosion process and results in hazardous situation such as the loss of physical, social, and economic properties, as well as infrastructure (Jibo, Laka, & Ezra, 2020). After this hazard has been identified, policy and decision-making—two key components of risk assessment and management—will be needed to mitigate its associated risk and vulnerability.
Vulnerability is the exposure or susceptibility of a phenomenon to the effects of the identified hazards (BCCP, 2014). The ESPON Hazards Project (2005) defines vulnerability as the degree of fragility of a person, a group, a community, or an area towards defined hazards. It is the specific characteristics or conditions of the exposure inventory that increase the chance that a hazard will cause damage, harm, or loss. Thus, vulnerability varies according to exposure characteristics (UN-ISDR, 2002). In relation to hazards and disasters, vulnerability is a concept that links the relationship that people have with their environment to social forces and institutions and the cultural values that sustain and contest them. Studies have shown that proximity to the source of the threat or the physical nature of the hazard plays a significant role in determining the degree to which populations are vulnerable to hazards (Cutter, Mitchell, and Scott, 2000). The question is: how do people perceive hazards? To represent and comprehend the world around us, perception is the process of organizing, identifying, and interpreting sensory data (Mamudi & Alamry, 2021; Schauter, 2011). The nose, ears, and eyes are among the sense organs that take in information from the surroundings. Every sense organ is a component of a sensory system that provides the brain with sensory data after receiving input from the senses. Somehow, sensory inputs are transformed into sensations of vehicles, planes, flowers, computers, desks, and sounds, as well as tastes, smells, and touches. Psychologists describe how perceptual experience is derived from the physical energy that sense organs receive.
In common parlance, the word “risk” refers to the “chance of disaster” (Royal Society, 1992). It has specific definition when applied to the risk assessment process. “The combination of the probability, or frequency, of occurrence of a defined hazard and the magnitude of the consequences of the occurrence” is the most widely recognized definition (Royal Society, 1992). (Renn, 2008) Risk is a mental model. Another name for it is framing. A portion of these models correspond to reality as it might appear, and a portion relate to how people and society interpret this appearance (some might refer to this as the result). It is primarily concerned with how people talk about and then assess risk, taking into account contextual aspects that appear to be directly related to the probabilistic nature of risk or its effects. This framing leads to circumstances in which expert risk assessment and lay risk assessment lead to contradictory results, which may result in suboptimal behaviors, ill-designed, or poorly accepted risk management strategies.
As a result, the terms “risk,” “risk management,” “risk assessment,” and the like may refer to a variety of realities. While this is not a problem in and of itself, it poses many issues when recognizing a risk worth managing, selecting a management method, and establishing the risk governance process. An appraisal of what the risks entail in practice for people impacted may be included in the risk assessment. This is greatly dependent on how the risk is perceived. People’s beliefs, attitudes, judgments, and sentiments, as well as the broader societal or cultural values that people hold toward dangers and their advantages, are all factors in risk perception. People’s perceptions of risk are crucial in the process of assessing and managing risk. Risk perception will play a significant role in determining whether a risk is regarded “acceptable” and whether the risk management measures implemented are perceived to solve the problem. Perceptions, on the other hand, are not georeferenced phenomena, although they can be mapped when coupled to spatial data with position information. The end product is a highly helpful technology that allows users to perform complex geo-queries on data and then map the results.
STUDY AREA
Benin City, the capital city of Edo State, had a projected population of 1,595,702 in 2017. Benin City is situated at longitudes 5°31′ and 5°45′ E and latitudes 6°12 and 7°13′. Benin City is situated on a nearly undulating low-lying plain with a local relief of 91 meters above sea level on average. The eastern margin is tilled towards the Ikpoba River, which drains the city’s eastern section, and the western edge descends gently towards the Ogba stream, which drains the city’s western portion (Odermer et al., 1992). Benin has an equatorial climate with an annual rainfall of over 2000mm and a mean temperature of 24°C. (Esiegbe, Omofonwmam, and Kadiri, 2007). The mean relative humidity is 81% (Areola, 2004). There are two predominant seasons in Benin: the rainy season and the dry season. The rainy season, which occurs between the months of April and mid-October, is characterized by high temperatures and high relative humidity. In the rainy season, the south-west wind dominates, while in the dry season, the north-east trade wind dominates. The dry season occurs between the months of October and March. Benin soils are reddish-brown ferrasols (Areola, 2004). The soils are deeply weathered, non-motted, and non-concretionary red, which have a heavy, textured subsoil with a high clay fraction, mostly kaolnite.
Benin City is grouped among those soils referred to as low-activity clay (LAC) soil (Kogbe, 1989). These are soils having an effective cation exchange capacity (C.E.C.) of less than 15 mg/1000 g of clay in the diagnostic B horizon (Odermerho, 1988). The area is underlain by sedentary rock of the Pleistocene age, often referred to as the Benin formations. This formation is dominantly arenaceous, comprising soft, poorly sorted, unconsolidated, cross-bedded, occasionally pebbly yellow and white sands. The vegetation in Benin could be described as savanna or derived savanna, which emerges after the destruction of the original forest. The vegetation is associated with tall grasses in the dry season. There are scattered stout trees of different species; the most noticeable are cashew, palm tree, pear, mango, cocoa, and kola nut. Common to all the earth materials at different locations in the area is that under agricultural land use, they are porous and highly permeable, and they are covered by tree crops. No matter how high the rainfall is, little or no surface runoff is generated. However, with severe compaction under urban land use, the top soils acquired higher values of bulk density, thus becoming relatively impermeable so that whenever it rains, runoffs are generated, which subsequently produce gullies in the area (Aderemi and Iyamu, 2000).
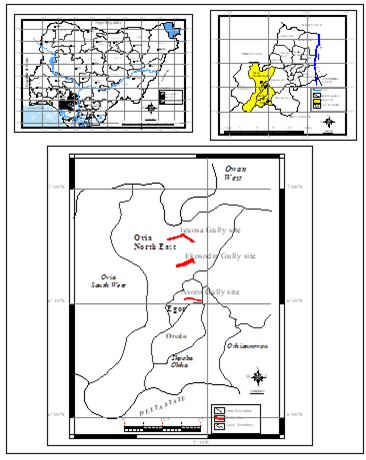
Figure 1: Benin City in its Regional settings showing study area
Source: Ministry of lands and survey, modified by the researcher, 2022
MATERIALS AND METHODS
The length and width of the gullies were measured using measuring tape and a surveyor’s peg; the depth was measured using rope and read off using a measuring tape. At the length of every 60 meters, the width and depth of the gullies were measured, and the coordinate point locations were obtained with the aid of a hand-held GPS (Garmin 72) to determine the basal extent of the gullies. These measurements were combined with information obtained from HITECH Construction Company to determine the severity of gully extents and expansion. Photographs of the study sites were also taken with a digital camera. Images of the study areas were obtained from Google Earth, while the base map of the area was obtained from the Land Survey. The image and map were georeferenced and vectorized to extract the gully site, road layouts, land uses, and housing units using ArcGIS software. The vector layers created within the UTM coordinate projection system enabled the calculation of area and lengths. The study employed a topographical map to generate the DEM of the study area; this gave a visual representation of the relief nature of the study area.
Questionnaire was used to elicit information from respondents on their risk perception and preparedness for the gully erosion hazard. Risk characteristics were measured using a five-point scale, where 1 is the lowest score and 5 is the highest score. This information constituted the non-spatial data that was used to create the attribute database. Based on this, risk perception maps from their responses were generated. The population of the study comprised residents of the Ekosodin, Asoro, and Iguosa areas of Benin City. This study adopts the concept of vulnerability based on the proximity of the resident location to the point of hazard in delineating the locally affected population to constitute the study population. A cross-section of 300m of housing units around the gully site constituted the sampled area. The residential buildings within the delineated areas are 124 buildings in Ekosodin, 277 buildings in Asoro, and 199 buildings in Iguosa, giving us a total of 600 residential buildings.
A total of 150 copies of the questionnaire were administered, with 31 copies at the Ekosodin study site. 69 copies at the Asoro study site and 50 copies at the Iguosa study site. This was estimated by using 25% of the population size of residential buildings on each site. A systematic sampling technique was used in the selection of respondents. To do this, questionnaires were administered at every fourth building, starting from the first building. The data obtained was analyzed using the SPSS statistical package. The chi-square and Pearson’s t-test were used to test the research hypothesis. The GPS locations of respondents were collected and used to develop a spatially referenced database of perceptions using Geographic Information Systems (GIS). The step-by-step processes in data analysis are illustrated with the aid of Figure 2, the cartographic model.
Buffering. An analytical proximity tool was used to define areas within a specified distance around the gully sites. Buffered zones at distances of 100m, 2000m, and 30 m from the gully site were created. Land uses and residents within the buffered zone of 0–15 m from the gully site were mapped as hot spots. The digitized road layout and housing units were overlaid with the buffered gully site. The output was used to generate a vulnerability map of the study area based on distance using overlay spatial intersect. The contour line data extracted from the topographical map was used to create a 3D layer in the ArcGIS software to show the terrain of the area. Variables drawn from the questionnaire were analyzed using an aggregated individual response model, and scores obtained from this analysis were used to determine the resident’s risk perception. A map was then used to visualize the various levels of the respondent’s risk perception.
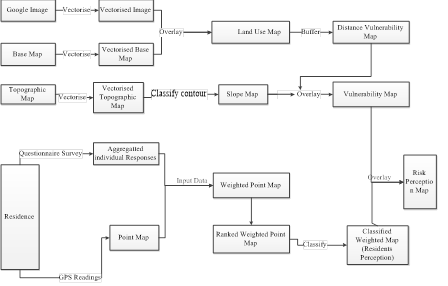
Figure 2: The Cartographic model.
Source: Authors, 2022
RESULT AND DISCUSSION
The analysis of the age distribution of 150 respondents shows that 40.7 were below 30 years of age, 25.3% were between 31-40 years, and those that were within 41-50 years were 20.7%. Age groups between 51-60 and 61 and above are 8.0% and 5.3%, respectively. More than 59% of the respondents are above 30 years old, which implies that they are mature and could therefore contribute meaningfully to the questionnaire. Besides, 54.3% of the respondents were male, while 44.7% were female. Analysis of the marital status of respondents reveals that singles constitute 36.7% of respondents, married are 62.7%, and widow/ widower are 0.6%. This statistic indicates that a larger population of people who are married along with their children are exposed to risks and dangers related to gully hazards.
Responses show that there is a considerable high level of literacy among the respondents, as the majority of them (58.7%) have tertiary education, 33.3% have secondary education, and 8% have primary education. They are literate enough to understand the content of the questionnaire. The majority of people living around the gully sites are involved in various business activities. Businessmen and women constitute 37.3% of the respondents, students 28.7%, and civil servants 21.3% of the respondents. Others, 12%, are company workers and farmers. The estimated income level of people living around the three sampled gully sites ranges from people earning less than NI0,000 naira per month to 28.7%. 33.3% earn between N10,000-N50,000 monthly. This is followed by those earning NS1,000-N100,000 monthly (30.6%), while income categories of NI01,000-NI50,000 and above NI50,000 are (2%) and (5.3%), respectively.
Findings revealed that the category of residents that is mostly found around the gully site are low-income earners. This has the capacity to influence their inability to finance relocation or their preparedness. There are varying sizes of households around the gully sites, as shown in Figure 3. The result revealed that households less than 5 are 38.0% 5–9 persons are 37.8%, and the household size of 10–14 persons is 12%. Those between 15-20 persons and above are 6% and 5.3%, respectively. This revealed that there is a high population that is exposed to the dangers of hazards.
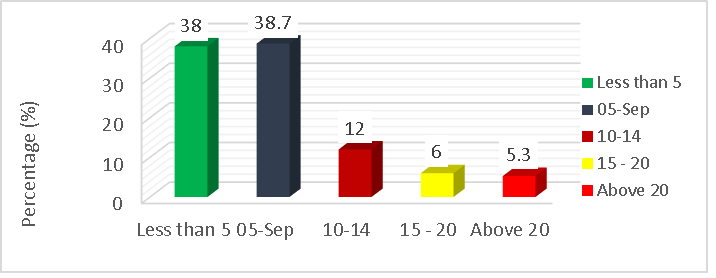
Figure 3. Household size
Source: Authors, 2022
The result indicates that 100 of the respondents in all the sites are aware of the presence of gullies in their areas. The respondents asserted that the gully sites and the rates of encroachment are obvious and alarming. Based on the rating scale assessment of 150 respondents in the study areas, 68.7% have the intuition that poor drainage is most likely the cause of the gully erosion, while 24.7% attribute the likely cause to poor drainage system. Only 1.3% of respondents are certain about the actual cause of the gully erosion. About 2.7% of respondents objected to the poor drainage system as the likely and or least likely cause of the threatening gully around them. Table l indicates that the major cause of the gully erosion in the study area, according to the respondents, is a poor drainage system. Evidently, the drainage conveying storm water did not get to the river where they were supposed to empty the storm water. Erosion started eating backward, where the drainage stopped. This was the situation at the three sites.
Table 1: Poor drainage system
| SN | Scale of Residents’ Risk Perception | Frequency | Percent |
| 1. | Not likely | 4 | 2.7 |
| 2. | Least Likely | 4 | 2.7 |
| 3. | Uncertain | 2 | 1.3 |
| 4. | Likely | 37 | 24.7 |
| 5. | Most likely | 103 | 68.7 |
| Total | 150 | 100.0 |
Source: Authors, 2022
Level of Residents’ concern on the Gully threat on access road and building properties
Residents whose residences are close to the gully sites show great concern about the expansion of the gully erosion. 44.7% and 30% respectively show much concern about the gully erosion as its rapid encroachment to residential areas and access road threatens safety of ‘both private and public properties’ including life of residents. Access roads and residential buildings have been lost to the gully hazard. Some residential buildings are damaged, while some access road have collapsed into the gully due to the uncontrolled erosion. Figure 4 shows access road that has collapsed due to the gully erosion.
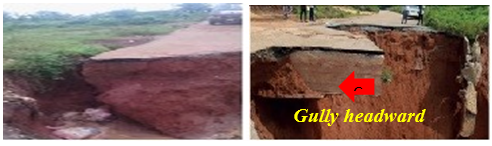
Figure 4: Damaged Roads at Asoro (left) area and UNIBEN (right) by gully erosion
Source: Author, 2021
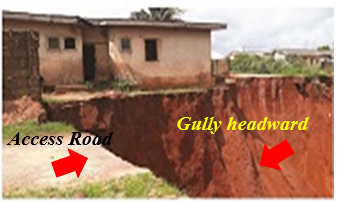
Figure 5: A damaged access road at Iguosa Housing Estate
Source: Author, 2021
Residents whose residences are close to the gully sites show great concern about the expansion of the gully erosion. About 74% show much concern about the gully erosion, as its rapid encroachment on residential areas and access roads threatens the safety of both life and property. Some residential buildings have been damaged, while some houses and access roads have collapsed into the gully. Some residents have abandoned their residences, but some are expecting government intervention, especially those at Ekosodin. Their expectation is that because of the location of the University of Benin, the government will be moved to do something. The study sites were given 15 m of concentric buffering (0–15, 16–30, 31–45).
Land uses and residences within the buffered zone of 0–15 m from the gully site are classified as hot spot areas. A total of 14 residential buildings were found within the first buffer zone, 15 meters away from the brink of the gully erosion. These buildings are highly vulnerable to damage. Spatial analysis on vulnerability carried out revealed the role of proximity in influencing residents’ perceptions of risk from gully erosion in the study sites. The level of residents’ concern about the gully hazard differs based on their distance to the gully sites. This is shown in Figures 6a, b, and c. The gully erosion area is shown in brown, and the building properties of residents who showed ‘a very great’ concern (44.7%) about the gully threat are indicated in red, followed by those who showed ‘great concern’ (30.6%) indicated in yellow. Residents who show moderate concern about the gully hazard (6.7%) are indicated in tarn brown, while those with little concern (12.7%) are shown in white.
Residences of those who show no concern (6.7%) are indicated in green. Residents’ perceptions of the safety of their lives and properties in the study area can be categorized as follows: very unsafe, a bit unsafe, not certain, a bit safe, and very safe based on perceived knowledge of residents’ safety, the expansion rate of the gully, level of risk, and willingness to move to safer locations. About 39.4% responded that their lives are very unsafe and that they are therefore looking for a place to relocate. While 19.3% felt that their lives and properties were a bit unsafe when they considered the distance of their residences to the gully spot, 6.7% were not certain in their response about their level of safety. They remain partially unthreatened by the gully due to the distance and expectation of government intervention. Although 16.7% of respondents believed that their lives and properties were a bit safe from potential dangers that may happen from gully hazards, they still had premonitions that the lives of their children were also in danger while going to or returning from school, especially during the rainy season.
Only 18% of the respondents believe that their lives and properties are very safe from the risk, threat, and potential hazards associated with the gully erosion. Their risk perception of the gully erosion is very low. This category of respondents is not willing to relocate for any reason associated with the gully erosion. Thus, it can be inferred that the majority of respondents have a high-risk perception of gully erosion in the neighbour hood as it threatens life, property, and access to neighbour hood facilities and services. Figures 6a, b, and c show the level of risk perception of residents in the study areas in varying degrees. This is indicated as low risk, medium risk, and high risk. These classifications are represented in three colour classes: brown, yellow, and red, respectively.
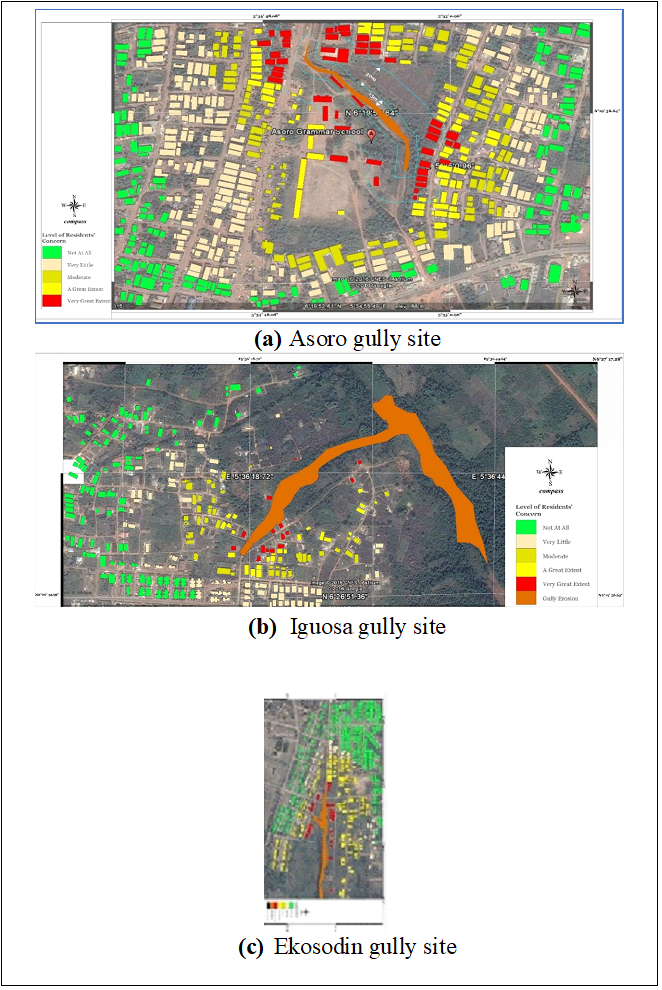
Figure 6: Level of Residents’ concern on the Gully threat on access roads and properties
Source: Authors, 2022
Residents’ Derived Perceptions of Safety
In spite of the magnitude and threat of the gully to life and property, the government’s intervention has been minimal. It was only in Asoro that the government intervened, and that was only when the gully claimed a life after a heavy downpour. Residents of Ekosodin and Iguosa noted that government officials from the federal, state, and local levels have come for gully inspection many times, but no action has been taken. Measures put in place by the association of property owners to check the expansion of the gully erosion yielded no result. In 2015, about 600 sand bags were used to build an improvised retaining wall of 10 feet across the Ekosodin gully to retain eroded sands from the run-off from adjacent streets. The whole 600 bags full of sand were carried away after a heavy downpour. Respondents are of the view that the control of the gully erosion is beyond what the community could handle. They are asking the federal and state governments to come to their aid. About 93.4% of respondents affirmed that the gully threat keeps increasing. They stressed that the rate at which it is cutting deep towards access roads and residential areas is alarming. It is observed that only 6.7% out of the total number of respondents pointed out that gully size has remained the same around their residences, while none of the respondents agreed that the gully threat has reduced.
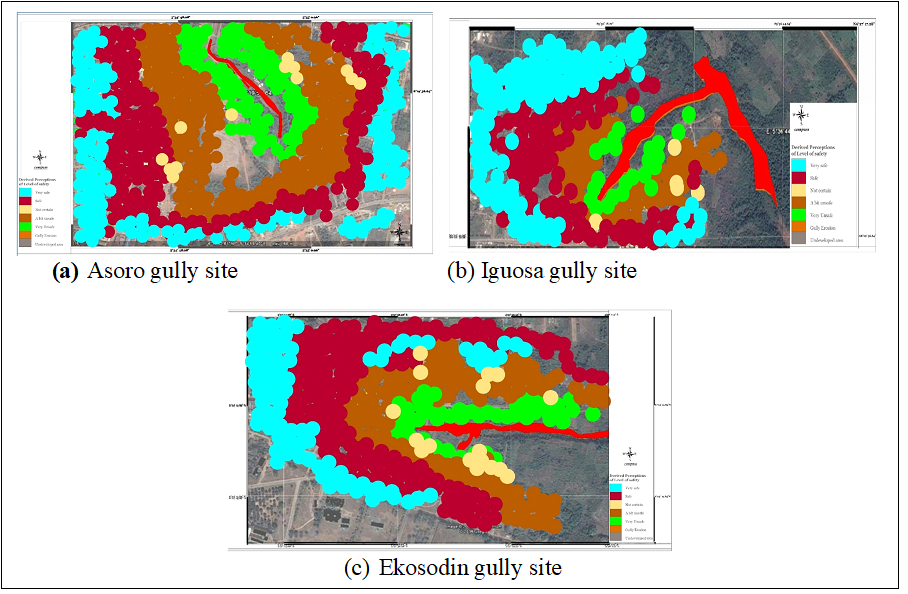
Figure 7: Buffered spot analysis of Residents’ Derived Perceptions of Safety
Source: Authors, 2021
As shown in figure 8, measurement carried out at the site reveals that within seven months (December 23, 2015, June 14, 2016, and May 10, 2021), The gully erosion at lguosa expanded on its head ward a distance of 48.61 metres towards the residential area at lguosa Housing Estate. As of 2021, transportation routes and physical structures that were marked as highly vulnerable to high risk of gully erosion (in red) had been eroded in all the locations of study, that is, Ekosodin, Asoro, and Iguosa (see figures 7a, b, and c). Figure 8 shows a sample of the extent of gully expansion on the transport route and structures at Iguosa.
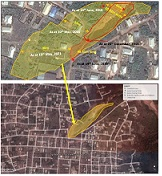
Figure 8: Spatial extent of gully expansion on transportation routes and landed Properties at Iguosa;
Source: Google Aerial view, 2021
Table 2 indicates the result of the study’s hypothesis using a one-sample t-test. The hypothesis states that “there is no significant difference between the variations in the levels of residents’ risk perception in the study area'”. The values of the known or hypothesized population mean that is being compared with the sample data are zero, as provided in the table. It was revealed that for all the perception statements, the statistical significance (p-value) (Sig, 2-tailed) of the one-sample t-test was less than 0.05. Therefore, it can be concluded that the population means are statistically significantly different.
Table 2. Hypothesis
| Test Value = 0 | ||||||
| t | df | Sig. (2- tailed) | Mean Difference | 95% Confidence Interval of the Difference | ||
| Lower | Upper | |||||
| I think about it | 32.610 | 149 | .000 | 3.58667 | 3.3693 | 3.8040 |
| I talk about it | 34.253 | 149 | .000 | 3.71333 | 3.4991 | 3.9276 |
| I get necessary information about it | 31.034 | 142 | .000 | 3.48252 | 3.2607 | 3.7043 |
| I think it poses a threat to our safety | 35.928 | 142 | .000 | 3.69231 | 3.4892 | 3.8955 |
| 1 think it poses a threat on landed properties | 31.013 | 141 | .000 | 3.65493 | 3.4219 | 3.8879 |
| Personal strange measure | 17.860 | 132 | .000 | 2.24060 | 1.9924 | 2.4888 |
| Its too destructive to bother preparing for | 34.541 | 145 | .000 | 3.69863 | 3.4870 | 3.9103 |
| Is of concern | 37.560 | 145 | .000 | 3.94521 | 3.7376 | 4.1528 |
| Would cause loss or damage to your life or property | 37.874 | 146 | .000 | 3.93197 | 3.7268 | 4.1372 |
| Participatory measure | 22.578 | 144 | .000 | 2.65517 | 2.4227 | 2.8876 |
| Proximity of my properties/residence to gully site | 32.839 | 148 | .000 | 3.42953 | 3.2232 | 3.6359 |
| Expansion of gully in spite of intervention projects | 33.049 | 148 | .000 | 3.34228 | 3.1424 | 3.5421 |
| Others | 12.058 | 56 | .000 | 2.75439 | 2.2968 | 3.2120 |
Source: Authors, 2022
Table 3: t-test Table
| Paired Samples Statistics | |||||||||
| Mean | N | Std. Deviation | Std. Error Mean | ||||||
| Pair 1 | Level of Risk | 3.5152 | 99 | 1.10068 | .11062 | ||||
| Level of preparedness | 1.6768 | 99 | .68256 | .06860 | |||||
| Paired Samples Correlations | |||||||||
| N | Correlation | Sig. | |||||||
| Pair 1 | Level of Risk & Level of preparedness | 99 | .142 | .160 | |||||
| Paired Samples Test | |||||||||
| Paired Differences | t | df | Sig. (2-tailed) | ||||||
| Mean | Std. Deviation Error | Std. error Mean | 95% Confidence
Interval of the Difference |
||||||
| Lower | Upper | ||||||||
| Pair 1 | Level of Risk
Perception – Level of Preparedness |
1.83833 | 1.20971 | .12158 | 1.59711 | 2.07966 | 15.121 | 98 | .000 |
Source: Authors, 2022
The mean of the level of risk perception and the mean of the level of preparedness were compared in the t-test in Table 3. The results given in the first row (t =15.121, df = 98, p < 0.001), under the column heading “t-test for paired differences,” are parameters for the standard test and assume homogeneity of variance. The conclusion from the test is that there is strong evidence of a difference in the mean level of perception and level of preparedness, as reflected in the table, which is 1.838. Therefore, the null hypothesis is rejected, and the alternative is accepted. Despite the high level of perception, preparedness to relocate is predicated on the availability of funds.
CONCLUSION
This study focused on the assessment and mapping of residents’ risk perception and level of preparedness for the vulnerable to vacate the gully erosion sites at Ekosodin, Asoro, and Iguosa neigh bourhood areas in Benin City. Using an aggregated individual response model, scores obtained from this analysis were used for map visualization. The social-economic characteristics of the residents were analyzed to determine the livelihoods of the residents around the gully sites. Residents around the gullies belong to a low-income group with a large household size. The study revealed that, though their perception of the risk of gully erosion is high, they could not relocate due to a lack of funds. Residents’ perceived vulnerability to gully hazards is directly related to the proximity of residents’ locations to the gully.
Residences found within a distance of 15 to 100 metres are considered unsafe for living. The zone is highly susceptible to gully disasters and has been classified as a death zone. There are a total of 26 buildings found within this zone, of which 14 residential buildings have been abandoned. Measures that were put in place to reduce the accelerated expansion of gully erosion have failed several times. Residents are of the view that erosion control is beyond what they can handle. Their expectation is for the government to come to their aid. Residents Perceived vulnerability to gully hazards is directly related to their proximity to the hazard point, while the level of residents’ preparedness to vacate the gully environment is directly related to perceived vulnerability and financial capability.
Preparedness to vacate residences is very high, especially among those located close to the gully spot. Based on the findings of this study, the following are hereby suggested: The Ministry of Environment should embark on perception mapping. The advantage could be harnessed by decision-makers to make quick and concise decisions. A perception map is a planning tool. Planning does not only involve planning for people; it also involves planning with people. The perception map encompasses the need to understand the insight of people living in areas that are susceptible to risks and to promote and regulate sustainable safety and reduce risks to hazards. In addition, risk perception maps are useful for disaster planning and management.
Risk perception of a natural disaster is one of the measures in disaster reduction. It facilitates healthy preparedness for prospective or looming disasters. It helps with quick decision-making processes during and after a disaster. For instance, detailed information on gully erosion in Benin City can be documented in map format. Information such as rate of expansion in time or periods, direction of expansion, width and depth of the gullies, numbers of landuses (residences) prone to danger or hazards, and the number of people to be evacuated and relocated to safe areas are all embedded in mapping analysis. The capability of maps to summarize and simplify descriptive data in times of crisis should be harnessed to save lives and properties.
The public should be enlightened about the importance of good drainage systems in residential environments. Poor drainage systems have been attributed as the major cause of gully erosion in the study areas. Government should ensure a policy statement to regulate the damage in erosion disasters All residential areas in the study areas have no drainage systems. This was observed as a poor development as access roads in the study areas are exposed to erosion from frequent runoff that usually gathers during and after heavy downpours. Besides, government agencies should conduct a vigorous sensitization program on the hazards and dangers associated with living around disaster-prone areas, such as gully erosion areas. Most seriously, governments should build low-cost housing units to relocate the affected people as a matter of urgency.
REFERENCES
- Aderemi, A. a. (2013). Risk Assessment Analysis of Accelerated Gully Erosion in Ikpoba, Okha Local Government Area of Edo State. Nigeria: . Environment and, Natural Resources Research:, 3(1).
- Areola, O. (2004). Exam focus geography. . Ibadan: University press plc. Ibadan.
- BCCP. (2014). ASEAN GIZ Biodiversity and Climate Change Project BCCP. BCCP.
- Blaikie, P., Cannon, T., Davis, I., & Wisner, B. (1994). AI Risk: Natural Hazards. People’s Vulnerability, and Disaster, 29.
- CCOHS, C. C. (2023, June 13). Hazard and Risk. Hazard and Risk General, p. 1. Retrieved from https://www.ccohs.ca/oshanswers/hsprograms/hazard/hazard_risk.html#section-1-hdr
- Costa, F., & Bacellar, L. d. (2007). Analysis of the influence of gully erosion in the flow pattern of catchment streams, . Catena Journal, 69:230-238.
- Cutter, S. L., Mitchel, J. T., & Scott, M. S. (2000). Revealing the Vulnerability of People and Places: A Case Study of Georgetown County, South Carolina. Annals of the Association of American Geographers., 90(4), 713-737.
- Ehiorobo, J. O., & lzinyon, C. O. (2012). Monitoring of Soil Loss trom Erosion Using Geo informatics and Geo technical Engineering Methods. Faculty of Engineering. Department of Civil Engineering. University of Benin, Benin City. Benin: Faculty of Engineering.
- Eseigbe, J. O., & Gbakeji, J. O. (2014). Evaluating Soil Erosion in the Benin Metropolis. Edo State. Nigeria. International Journal of Physical Sciences, 2(3), 038-045.
- Esiegbe, J. O., Omofonwmam, S. J., & Kadiri, M. A. (2017). Solid Waste Generation and Management in Benin Metropolis. . Conference Journal of Environmental Studies, 2(2), 34-44.
- ESPON Hazards project. (2005). The spatial effects and management of natural and technological hazards in general and in relation to climate change. Final Report. ESPON.
- Jibo, A. A., Laka, S. I., & Ezra, A. (2020, June). The Effects of Gully Erosion on Physical and Socio-Economic activities in Akoko Local Government Area of Gombe State, Nigeria. FUTY Journal of the Environment, 14(2), 43.
- Mamudi, S. F., & Alamry, T. C. (2021, August). Students’ Perception on Instragram to Learn English Vocabulary. sintuwumaroso JET,, Vol. 7, No. 1.
- Mikulas, L. (2013). Amed Forces Academy of General Milan. Rastislav Stefanik. l(8)(EV 2061/08, ISSN 1336-8885), 53-62.
- Odemerho, F. (1992). Limited downstream response of stream channel size to urbanization in a humid tropical basin. Professional Geographer. 44 (3), 322-339.
- Odjugo. P.A.O. (2012). Valuing the cost of environmental degradation in the face of changing climate: Emphasis on flood and erosion in Benin City, Nigeria. African Journal of Environmental Science and Technology, 6(1), 17-27. Retrieved from htp://www.academicjournals.org/AJEST ISSN 1996-0786
- Pallaris, K. (2000). Terrain Modelling for Erosion Risk Assessment in the Cabuyal River Catchment: Comparison of Results with Farmer Perceptions. Cali, Colombia.: International Centre for Tropical Agriculture (CIAT), A.A. 6713, .
- Palm, R. (1998). Urban earthquake hazards: The impacts of culture on perceived risk and response in the USA and Japan. Applied Geography, 18(1), 35-46.
- Perroy, R. L., Book hagen, B., Asner, G. P., & Chadwick, O. A. (2010). Comparision of Gully Erosion Estimates using Air borme and Ground-based LIDAR on Santa Cruz Island. Geo morphology, 118(3-4):, 288-300 June, 2010.
- Public Safety Canada. (2017). An Emergency Management Framework for Canada. (T. Edition, Ed.) Hazard.
- Renn, O. (2008). Risk Governance: Coping with Uncertainty in a Complex World. London: Earthscan.
- Rout, B. K., & Sikdar, B. K. (2017). Hazard Identification, Risk Assessment, and Control Measures as an Effective Tool of Occupational Health Assessment of Hazardous Process in an Iron Ore Pelletizing Industry. Indian J Occup Environ Med., May-Aug; 21(2), 56–76. doi:10.4103/ijoem. IJOEM_19_16
- Royal Society. (1992). Risk Analysis, Perception and Management. . London: The Royal Society, London.
- Sahni, P., Dhameja, A., & Medury, U. (2001). Disaster Mitigation: Experiences and Reflections. (S. D. edition, & U. New York, Eds.) Prentice-Hall India.: Psycholog. Worth Publishers;. doi:ISBN-10: 1429237198: ISBN-13:978-1429237 1 92.
- Slovic, P. (1987). Perception of risk. Science. New series Journal, 236(4799), (April 17, 1987), 280-285. .
- UN-ISDR. (2002). United Nations – International Strategy for Disaster Reduction): Living with risk. A global review of disaster reduction initiatives, United Nations report,. UN-ISDR.
- Valentin, C., Poesen, J., & Young, L. (2005). Gully erosion: impacts. factors and Control. Catena, Vol. 63, 132-153.
- Xiaodong, M., Qiuhua, L., Richard, D., & Xia, X. (2022). A quantitative multi-hazard risk assessment framework for compound flooding considering hazard inter-dependencies and interactions. Journal of Hydrology, 607(694):127477. doi:DOI:10.1016/j.jhydrol.2022.127477