
Willingness to Pay Among Consumers for The Cost of Electronic Waste in Davao City
- Melvin B. Tinio
- 131-167
- Apr 4, 2024
- Information and Communication Technology
Willingness to Pay Among Consumers for The Cost of Electronic Waste in Davao City
Melvin B. Tinio
Researcher
DOI: https://doi.org/10.51244/IJRSI.2024.1103012
Received: 18 February 2024; Revised: 28 February 2024; Accepted: 04 March 2024; Published: 04 April 2024
ABSTRACT
The study aimed to understand the willingness of consumers in Davao City to pay for the environmental cost of electronic waste. Using a cross-sectional survey research design, a questionnaire was administered to 258 consumers selected through stratified random sampling. The study found that most participants were female, aged 41 to 50, held a bachelor’s degree, had 1 to 2 children, earned between 20,000.00-29,999.00, owned a house, and were aware of the health effects of poor waste disposal. They were also satisfied with waste management services and were willing to pay Php 41.67 per sack every month for the environmental costs of electronic waste. The Probit analysis revealed that age, number of children, income, and satisfaction with waste management services significantly influenced their willingness to pay. The study recommends establishing an e-waste recycling policy emphasizing accountability of end users, suppliers, and manufacturers, and the need for cooperation among multiple stakeholders, including the government, producers, consumers, and especially the informal sectors.
INTRODUCTION
Background to the Study
A new report from Blancco Technology Group claims that 53 million tons of e-waste were created during 2019, even before the pandemic struck (Cunningham, 2020). The report states that, since the Covid-19 pandemic began, nearly all enterprises have been forced to refresh their hardware. It is estimated that by 2030, about 400-700 million personal computers will become obsolete in developing countries (Fadilpasic, 2020).
The amount of e-waste generated by the informal sector in developing countries is increasing at a much faster rate than the amount managed by formal recycling systems (Bisschop, 2014; United Nations University, 2017). Often appropriate facilities and infrastructure are not available locally, and as a result, informal recyclers apply sub-standard and often dangerous processes (Yu, et al., 2010; Balde et al., 2017; Balde et al., 2015).
Heavy metals as a form of e-waste are the most persistent pollutants in the environment because of their resistance to decomposition in natural conditions (Ra et al., 2013). When heavy metal levels exceed their permissible limits, they become toxic. Meanwhile, combustion from burning creates fine particulate matter, which is linked to pulmonary and cardiovascular disease (Jin et al., 2015). Particulate matter (PM) is also known as particle pollution and is the key indicator of air pollution. In India, informal recycling activities such as open burning, dismantling, incinerating, ash washing, and acid baths release several toxic or hazardous substances such as Pb, Cd, Ni, Cu, and Zn (Kiddee et al., 2013; Suvarapu & Baek, 2016)
Many companies are refusing to address their impact on the environment and the communities affected by their industry (Dawson, 2016). The average life span of computers has reportedly dropped in recent years by 50% from 4 to 2 years (Perkins et al., 2014). Electronic products contain numerous heavy metals, which could be dangerous for people (Cruz-Sotelo et al., 2017).
The primary reason to operate a recycling scheme is to compensate for or prevent environmental costs caused by the littering of e-waste (Cheng & Chang, 2017). Nonmonetary incentives are associated with lower carbon emissions. Cost savings to firms also often translate into cost savings for customers who purchase products from regulated firms (Eccles et al., 2012).
The informal e-waste recycling sector has become a source of livelihood for many households in the Philippines (International Labour Organization, 2019). E-waste comes from two sources-locally generated and foreign end-of-life products or products that have been disposed of by developed countries and exported Sustainable Recycling Industries, 2018). Waste electrical and electronic equipment (WEEE), which is currently one of the Philippines’ fastest-increasing waste streams, is regulated by RA 6969. According to the Global Environment Report, the country created almost 3.9 kg of e-waste per inhabitant last year. According to an EMB study, the Philippines created a total of 32,664.41 metric tons of WEEE in 2019 (Department of Environment and Natural Resources, 2020).
The challenge in Davao City is to determine how much e-waste is generated. No available model explains the willingness to pay among consumers for the cost of e-waste. Inappropriate treatment of the waste leads to the loss of resources as well as developing severe environmental and economic problems. Hence, securing e-waste properly should be prioritized by local and national agencies so that its harmful effects on the community and environment may be lessened. More importantly, this study is of great importance to the people, end-users, community, and country.
Statement of the Problem
This study aims to determine the willingness to pay among consumers for the environmental cost of electronic waste in Davao City. Specifically, it sought the answers to the following questions:
- What is the socio-demographic profile of the consumers in terms of:
1.1 gender,
1.2 age,
1.3 education,
1.4 number of children in the household,
1.5 monthly income,
1.6 house ownership,
1.7 knowledge of the effect of waste, and
1.8 satisfaction with waste management services?
- How much willing to pay among the consumers in the long run?
- What are the determinants of willingness to pay for the environmental costs of electronic waste?
Significance of the Study
This study opens an opportunity for end-users or teachers to recognize the prime importance of paying the environmental cost of e-waste. This mechanism may benefit the following stakeholders:
Informal Sector. They will be guided or informed on the negative effects of e-waste if not handled properly. Information dissemination will be channeled to these people for them to practice safety in collecting e-waste. They will follow regulations implemented by LGUs or national agencies.
Formal Sector. Proper e-waste disposal will be made. Measures on the disposal of waste will be implemented following environmental compliance so that the environment, community, and people will not be affected by its adverse effects.
School Offices. They will be reminded of their duty to properly segregate or recycle e-waste so that it will not contribute to harming the environment. Also, they will be encouraged to promote proper disposal of e-waste to various stakeholders.
Teachers. They will develop management practices on how to handle e-waste in school. Also, they will encourage their colleagues to recycle e-waste instead of throwing them into garbage bins.
Households. They will be informed on what to do with the materials they have utilized or collected. Some may recycle or resell the materials collected.
Scope and Limitations
This study aims to determine the willingness to pay among consumers for the environmental cost of electronic waste. This study was conducted in Davao City and involved 476 teachers. The study covered from January 2022 to July 2022. A survey questionnaire was utilized in the gathering of data.
This study was limited only to determining the willingness to pay among teachers for the environmental cost of e-waste. Additionally, the collection of data during this pandemic served as another limitation of this study. The difficulties of transacting to various school offices or the gathering or retrieving of data through stringent face-to-face are big obstacles to the success of this study.
Definition of Terms
The terms used in this study are operationally defined:
Age refers to the length of time in years that teachers have lived.
Consumers refer to teachers who utilize and contribute to the volumes of e-waste.
Education refers to the degree obtained by teachers.
E-waste refers to any electronic equipment that has been discarded such as broken mobile phones, mobile phone chargers, power cords, commercial batteries, earphones/earbuds, calculators, printer ink and toner cartridges, small gadgets, computer wiring, TVs, computer monitors, printers, scanners, keyboards, mice, cables, circuit boards, lamps, clocks, flashlight, and calculators.
E-waste management refers to the scheme or mechanisms for handling or managing electronic equipment.
Gender refers to male and female consumers of e-waste.
House Ownership refers to owned or rented houses by teachers.
Knowledge of the Effect of Waste refers to teachers’ awareness or unawareness of teachers on the effect of e-waste.
Monthly Income refers to teachers’ monthly salary.
Number of Children in the Household refers to the number of teachers’ children at home.
Satisfaction with Waste Management Services refers to teachers’ contentment or discontentment with the waste management services.
Teachers refer to the consumers or household individuals who consumed or utilized e-waste.
Willingness to pay means the highest price an e-waste product teacher-consumers will pay for the cost of e-waste
Cost of e-waste refers to the amount of e-waste produced by teacher-consumers of electronic products measured per sack/month
REVIEW OF RELATED LITERATURE AND THEORETICAL FRAMEWORK
E-Waste
E-waste, discarded electrical and electronic equipment (EEE), is a growing global issue due to its environmental impact and potential health risks (Nguyen et al., 2018; Kiddee et al., 2013; Udhayakumar, 2017). It encompasses a wide range of items, from everyday electronics to industrial machinery (Sivaramanan, 2013). E-waste contains over 1000 different substances, some of which are hazardous and can contaminate the environment when improperly disposed of (Barba-Gutiérrez et al., 2008; Wath et al., 2011). Despite the environmental risks, e-waste also contains valuable materials like precious metals, which can be recovered for reuse (Fornalczyk et al., 2013). The management of e-waste presents a significant challenge due to the balance between its environmental and economic value (Widmer et al., 2005; Zhang et al., 2015; Bhat et al., 2012). Improper disposal and recycling techniques can lead to the release of toxic substances into the environment, affecting the air, soil, and water (Rajarao et al., 2014; Taghipour et al., 2014; Barba-Gutiérrez et al., 2008; Sthiannopkao & Wong, 2013; Song et al., 2012).
Improper disposal or recycling of electronic waste (e-waste) can have significant environmental and health impacts (Othman & Kamaruddin, 2015). Landfill technology, often used for e-waste disposal, releases pollutants into the environment (Othman et al., 2017). Studies indicate that while the Malaysian community is aware of e-waste issues, their understanding of e-waste management is unsatisfactory (Rafia et al., 2012; Rulia et al., 2014). Despite high awareness of e-waste, many do not know how to dispose of it properly, even with solid waste separation regulations in place (Junaidah, 2010; Nur et al., 2015). Similarly, a study in China found that young consumers are environmentally conscious but lack awareness about e-waste management practices and regulations (Ramzan et al., 2014).
Management Practices
E-waste management, influenced by infrastructure, support, governance, and consumer awareness, requires economic and social viability, stakeholder coordination, and legal policies for successful implementation (Kumar & Dixit, 2018; Ravi & Shankar, 2014). Developing nations face challenges due to inadequate resources, vague stakeholder roles, and weaknesses in social, economic, legal, financial, knowledge, and technological areas (Marshall & Farahbakhsh, 2013). These nations often become dumping grounds for e-waste due to weak environmental policies and cheap labor (Garlapati, 2016; Wakolbinger et al., 2014; Kumar et al., 2017). Despite the Ministry of Environment and Forest Climate Change (MoEF) providing a framework for e-waste management in India, the country struggles with its implementation due to various challenges (Wang et al., 2012; Garlapati, 2016). Similarly, despite having legislation for e-waste collection and management, Australia sees a significant increase in e-waste disposed of in landfills, with only 4% being recycled (Phil, 2009; DSEWPC, 2011).
Reverse Logistics. Reverse logistics, a sustainable supply chain management strategy involves the efficient flow of materials from consumption to origin for value recapture or proper disposal (Ayvaz et al., 2015; Rogers & Tibben-Lembke, 2011). Interest in reverse logistics has grown due to environmental legislation evolution, consumer pressure, and corporate image benefits (Jayaraman & Luo, 2007; Janse et al., 2009; Lau & Wang, 2009). However, coordinating supply chain players and legislative gaps, such as unclear collection responsibilities in the European Directive for Waste Electric and Electronic Equipment (WEEE), complicate reverse logistics (Rogers & Tibben-Lembke, 2011; Lau & Wang, 2009; Rotter et al., 2011). Other issues include tax structures and a lack of financial incentives (Schluep et al., 2009). Globally, companies are realizing that effective reverse logistics practices can minimize e-waste’s environmental impact and enhance profitability through alternative recovery methods, necessitating sustainable e-waste management practices (Kumar & Dixit, 2018).
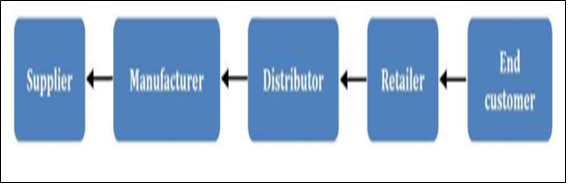
Figure 1. Reverse Logistics Process
Life Cycle Assessment
Life cycle assessment (LCA) is a method used to estimate the environmental impact of e-waste treatment, considering all stages of product creation and activities (Hong et al., 2015; ISO 14040, 2006). Studies in China using LCA have shown that recovery of materials from e-waste can generate environmental benefits, but the impact varies depending on the treatment scenario (Song et al., 2012; Niu et al., 2012). However, these studies did not include direct emissions from e-waste recycling sites and used non-regionalized databases, leading to uncertainties in results (Ecoinvent Centre, 2010; Lin & Liu, 2012). Furthermore, the end-of-life route of e-waste often differs from manufacturers’ assumptions due to variations in human behavior and collection schemes in different countries, complicating the modeling of end-of-life and increasing uncertainties (Moreover et al., 2015; Achachlouei et al., 2015).
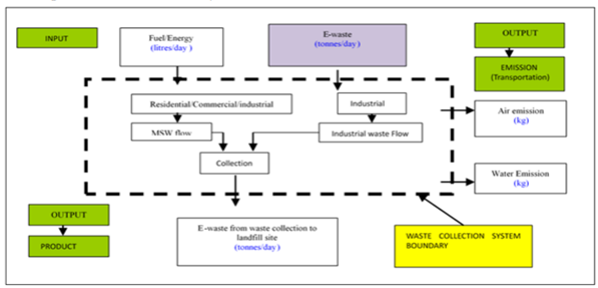
Figure 2. Life Cycle Inventory Model for E-waste Collection
Material Flow Analysis
Material Flow Analysis (MFA) studies the process chains of materials, aiming to capture resource flows in end-of-life vehicles and e-waste (Daniels & Moore, 2001; Daniels, 2002; Modaresi & Müller, 2012; Hatayama et al., 2012; Yano et al., 2014; Richa et al., 2014). Some studies estimate flows of specific materials in e-waste and track international trade of second-hand e-products (Lam et al., 2013; Habuer et al., 2014; Breivik et al., 2014). Methodological aspects for estimating e-waste flows are discussed due to limited data and consumer habits (Araújo et al., 2012; Wang et al., 2013; Li et al., 2015; Lam et al., 2013).
Multiple Criteria Decision Aid (MCDA) analyzes decision problems from different perspectives, not aiming at a single optimal solution (Gomes & Gomes, 2014; Guarnieri, 2015). Approaches include multi-attribute utility methods, outranking methods, and iterative methods, each with unique characteristics (De Almeida, 2013).
Extended Producer Responsibility (EPR) adds environmental costs associated with a product’s life cycle to its market price, driving remanufacturing initiatives and minimizing environmental impact (OECD, 2001; Johnson & McCarthy, 2014). EPR was first introduced in Sweden, emphasizing the manufacturer’s responsibility for the product’s life cycle (Lindhqvist & Lidgren, 1990, Lindhqvist, 1992).
Passing responsibility to producers as polluters is an effective strategy for achieving higher environmental standards in product design (Nakajima & Vanderburg, 2006). Extended Producer Responsibility (EPR) encourages manufacturers to design environmentally friendly products by holding them responsible for end-of-life product management costs, differing from product stewardship which shares responsibility across the product’s chain of custody (Shooshtarian et al., 2021). EPR can take various forms such as reuse, buyback, or recycling programs, and may involve a third-party Producer Responsibility Organization (PRO) paid by the producer for used-product management. This shifts waste management responsibility from the government to private industry, requiring producers, importers, and sellers to internalize waste management costs in their product prices and ensure safe product handling (Hanisch, 2000).
Willingness to Pay
Willingness to Pay (WTP) is the maximum amount an individual is willing to pay for a good or service, indicating the value they place on that commodity (Leszczynska, 2014; Lusk & Hudson, 2004). It forms the basis of payment for environmental services (PES) and varies among stakeholders (Li et al., 2018). Methods to elicit consumers’ WTP include personal interviews, mail surveys, and experimental auctions (Umberger et al., 2002).
Environmental studies often use Net Present Value (NPV) to value project benefits and costs, including economic aspects of ecosystems and their management (Knoke et al., 2020; Naidoo et al., 2006). NPV is used to predict the acceptability of conservation strategies or likely decisions, such as whether prices paid for carbon storage are high enough to incentivize tropical forest conservation (Fisher et al., 2011; Warren-Thomas et al., 2018). However, optimizing with NPV could lead to early resource exploitation, which may not be acceptable for resource users depending on continuous income from using the resource (Hahn et al., 2014; Runting et al., 2019).
Nguyen et al. (2021) found that end users’ willingness to participate in recycling programs, laws and regulations, inconvenience of recycling, and experience significantly contributed to the WTP for recycling e-waste. Most participants preferred the deposit and refund scheme for recycling payment methods.
Research indicates that consumers are willing to pay more for products with perceived environmental benefits (Straub & Thomassin, 2006; Thilmany et al., 2008). Studies have found that environmental considerations influence consumers’ decisions, such as choosing local melons with environmental benefits (Thilmany, Bond, & Bond, 2008), participating in community-supported agricultural programs (Bougherara et al., 2009), and preferring tomatoes produced using environmental management systems (Straub & Thomassin, 2006). However, while there is a positive willingness to pay (WTP) for environmental resources, some studies suggest that the WTP for human benefits is still higher than for environmental benefits (Tully & Winter, 2014).
Gender
Research has shown that willingness to pay (WTP) for improved solid waste management varies significantly based on factors such as gender, occupation, marital status, education level, and income (Adebo & Ajewole, 2012). Women, in particular, are more willing to pay to avoid environmental health risks for their children (Dupont, 2004), although they may be less willing to sacrifice for environmental protection (Swiader et al., 2018). Gender has been found to impact ecological consumer behavior, with females performing more environmentally conscious consumer behavior (ECCB) (Roberts, 1996). However, males have been found to engage more in green-product-related information searches and purchase green products more frequently (Ling-Yee, 1997).
While females are more willing to buy environmentally friendly products (Laroche et al., 2001; Loureirro et al., 2002), the significance of gender diminishes when psychographic variables are included in the analysis (Straughan & Roberts, 1999). Interestingly, female college students were found to be more likely to rate environmental certification as most important when ranking versions of a wood CD rack (Anderson and Hansen, 2004), and females aged 55 to 59 were more than twice as likely as the average consumer to use green products (ICOM Information and Communications, 2008).
In terms of WTP to prevent environmental pollution, male gender, and educational level were positively related to WTP, while age was insignificant (Ercolano et al., 2014). In an Italian subsample, educational level positively affected WTP, while gender and income were insignificant (Cicatiello et al., 2020). A study in Germany found that income and education positively influenced the likelihood of WTP for environmental protection in terms of higher taxes (et al., 2001). These findings highlight the complex interplay of demographic and psychographic factors in influencing environmental behaviors and attitudes.
Age
Age is a significant factor in environmental behaviors and attitudes. Older individuals are often more attracted to ecotourism and show a higher willingness to pay (WTP) for conservation (Baral et al., 2008; Togridou et al., 2006). Age also plays a crucial role in the development of economic reasoning in youth (Brocas & Carrillo, 2018; Sutter et al., 2019). A U.S. survey found that older consumers are more likely to exhibit ecologically conscious consumer behavior (ECCB), although all demographics combined explained only a small portion of the variation in ECCB (Roberts, 1996).
Conversely, younger consumers, particularly in Canada and Hong Kong, are more responsive to environmentally friendly products (Chan, 1996). Age was found to correlate significantly with ECCBs in a study by Straughan and Roberts (1999). Consumers over 55, particularly women aged 55-59, were the most prolific users of green products in the U.S., with men aged 65-69 also more likely than the average American to use such products (ICOM Information & Communications, 2008). A study of Portuguese consumers identified the most environmentally concerned cluster, ‘the green activists’, primarily within the age segments of 25-34 and 45-54 (do Paco et al., 2009).
Education
Education is positively linked with environmental knowledge, fostering higher pro-environmental intentions or behavior, and better-educated individuals exhibit a higher willingness to pay (WTP) for reducing environmental risks and enhancing environmental quality (Kollmuss & Agyeman, 2002; Franzen & Meyer, 2010; McCullough et al., 2016; Veronesi et al., 2014; Ercolano et al., 2014). Education also boosts environmental awareness and influences the demand for environmental quality (Economic and Social Research Council (ESRC), 2011; Movsesyan & Zagheni, 2013). Studies have underscored the importance of education as a determinant of WTP, with a higher level of education being positively associated with WTP due to increased environmental issue awareness (Baral et al., 2008; Bhandari & Heshmati, 2010; Mamat et al., 2013; Brennan et al., 2007). More educated consumers are more likely to respond to environmentally friendly products (Chan, 1996; Roberts, 1996). However, the impact of education on ecological consumer behavior becomes non-significant when attitudinal variables are considered (Roberts, 1996). Those with the highest education levels demonstrated the highest level of environmental concern (do Paco et al., 2009).
Number of Children in the Household
The presence of dependent children in a household is linked to environmental behaviors and attitudes. While it’s associated with a lower willingness to pay more for environmentally friendly products (Economic and Social Research Council (ESRC), 2011), people with children in their households are more likely to exhibit environmentally friendly behaviors (Fisher et al., 2012). Studies have found that married females with at least one child living at home were willing to pay more for environmentally friendly products (Laroche et al., 2001), and females with children under the age of 18 were the most willing to pay more for environmentally friendly apples (Loureirro et al., 2002).
Monthly Income
Income significantly influences an individual’s willingness to pay (WTP) for environmentally friendly products and measures. Studies indicate that income level, satisfaction with management, and environmental awareness positively affect WTP, while recovery price has a negative impact (Orlowski & Wicker, 2019; Preisendörfer, 1999; Han et al., 2011; Schuhmann et al., 2019; Cai et al., 2019). A considerable percentage of respondents are willing to pay for environmental conservation and improved solid waste management. This willingness is influenced by factors such as income, education, environmental awareness, and household size, but not by age, service availability, or marital status (Han et al., 2011; Kalbali et al., 2014; Basiru, 2017; Anjum, 2013; Julius et al., 2017; Nkansha et al., 2015; Naeem et al., 2013). Income level is a significant determinant of WTP for conservation and environmentally friendly products or services. Higher income levels positively impact contributions to biodiversity conservation and the willingness to pay additional taxes for general environmental protection and to pay more for devices that reduce CO2 emissions or fuels that produce less CO2 (Bhandari and Heshmati, 2010; Meyer et al., 2010).
House Ownership
Living in a household restricts people’s behavior regardless of their attitudes, as it requires coordination with other people’s attitudes, and comes with time constraints (Shove, 2010). Pro-environmental behavior of individuals is shaped by their household structure, the size of which hurts pro-environmental behavior (Longhi, 2013) and environmental concerns in general (Johnson et al., 2004), but impacts positively recycling and nature participation (Johnson et al., 2004). As mentioned about the Income factor, households with a higher income are more likely to participate in green electricity programs but a larger number of household members decreases the likelihood of participation (Clark et al., 2003). Additionally, individuals increase emissions (household gas & electricity) with their everyday behavior (Abrahamse & Steg, 2011). Analyzing household structures shows that single women scored highest in pro-environment behavior, followed by couples without children. Couples with children show the lowest pro-environmental behavior (Longhi, 2013).
Knowledge of the Effect of Waste
Environmental knowledge encompasses an individual’s ability to recognize symbols, concepts, and behavioral patterns related to environmental protection. It also involves understanding the impact of environmental issues. In essence, it combines awareness of the problem and its consequences. Possessing such knowledge increases the likelihood of pro-environmental behavior. To influence attitudes toward environmental issues, providing new knowledge is a strategy (Steg & Vlek, 2009). Tailored information about energy use can reduce household energy consumption (Abrahamse et al., 2007). However, simply repeating information about climate change causes does not necessarily lead to reduced carbon consumption (King et al., 2009). An individual’s ecological worldview depends on environmental knowledge and socio-economic factors (Halkos & Matsiori, 2017). People well-versed in greenhouse gas emissions, energy-saving behaviors, and environmental values are more likely to engage in energy-saving practices (Pothitou et al., 2016). Additionally, tourism students’ environmental knowledge positively influences their intention to participate in eco-tourism activities (Fatima et al., 2016). Lack of knowledge and conflicting information can act as barriers to pro-environmental behavior (Lorenzoni et al., 2007).
Satisfaction with Waste Management Services
Solid waste management is an important aspect of citizens’ lifestyles and the country’s economic status (Baud, 2001). According to the United Nations Development Programme in 2008, waste management is a crucial aspect of sustaining national development. Previous studies have identified the organizations or stakeholders that may have concerns about effective and efficient systems of solid waste management. These include authorities of national and local government (Shekdar, 2009); non-governmental organizations, municipal authorities, households (Sujauddin et. al, 2008); Ministry of Health, private contractors (Geng et. al, 2009) and recycling companies (Tai, et al., 2011). Despite the involvement of these stakeholders in the waste management practice, some factors influence the effectiveness of solid waste management.
Factors Affecting E-waste Management
Lack of Efficient Information and Technological SystemsThis is one of the major obstacles in the management of end-of-life electronic products safely and effectively. The lack of efficient information and technological systems poses a challenge to policymakers wishing to design an e-waste management strategy and to the industry wishing to make rational investment decisions (Widmer et al., 2005). It is necessary for effective e-waste management to quantify and characterize the electronic waste stream, identify the major generators, and assess the risk involved. Reliable figures on quantity are crucial to evaluate compliance with regulations set by authorities. Reliable figures are also important for monitoring and further improvement of return schemes (LARRDIS, 2011). The difficulty in inventorization is one of the important barriers to safe e-waste management.
Hazardous Product Composition Problem
E-waste, comprised of a myriad of hazardous substances, poses significant risks to both human health and the environment, necessitating specialized disposal methods to prevent the release of toxins (Khetriwal et al., 2005). Throughout the waste management process, electronics and electrical equipment containing these hazardous materials can generate environmental issues (Babington et al., 2010). The complexity of e-waste, with its diverse material composition including chlorinated and brominated substances, toxic metals, and various other harmful components, presents challenges in recycling efforts (LARRDIS, 2011; Liu et al., 2012). Moreover, the intricate integration of materials within electronic products further complicates recycling procedures, as each product type and even individual items within the same category exhibit variations in material composition.
Lack of Training, Techniques and Recycling Infrastructure
E-waste, laden with hazardous substances, presents significant health and environmental risks, necessitating specialized disposal methods to prevent toxin release (Khetriwal et al., 2005). The waste management process can generate environmental issues due to the hazardous materials in electronics and electrical equipment (Babington et al., 2010). The diverse material composition of e-waste, including toxic metals and other harmful components, complicates recycling efforts (LARRDIS, 2011; Liu et al., 2012). The complex integration of materials in electronic products further complicates recycling, as variations exist even within the same product category.
Lack of Awareness
Effective e-waste management relies heavily on citizens’ attitudes and awareness, with a lack of understanding posing significant challenges in diverting e-waste from municipal waste streams (Joseph, 2007). Public ignorance about the need for an e-waste management system and responsible consumer behavior is a key barrier to safe e-waste handling (Discussion paper, International Telecommunication Union, 2011). Manufacturers must educate consumers about the potential health and environmental risks of their products and promote proper e-waste management protocols. However, consumers often lack the necessary tools and technical support to extend the lifespan of their electronic products (Agarwal, 2007). The lack of consumer awareness is a significant challenge for formal recyclers, necessitating substantial investments in consumer education and capacity-building initiatives (Tanskanen, 2013). Despite these efforts, insufficient consumer awareness about the potential for electronic scrap recycling and its positive environmental impacts remains a major obstacle, highlighting the need for a sustainability-oriented society (Tanskanen).2013).
Financial Constraints
With economic and industrial growth driving an increase in the proportion of e-waste within municipal solid waste, effective management of waste electrical and electronic equipment (WEEE) becomes a pressing concern (Nnorom & Osibanjo, 2008). Recommendations for developed countries include allocating sufficient funds for WEEE collection, storage, recycling, and disposal, with the economies of recycling serving as a primary consideration for financial support to formalize these processes and enhance compliance with environmental, health, and safety standards (Raghupati et al., 2013). Additional measures such as financial aid, access to credit, incentives, subsidies, and insurance schemes may also be necessary to bolster WEEE management efforts (Raghupati et al., 2013). Ensuring financial stability for a producer responsibility system becomes especially critical when disposal costs exceed the recoverable value (Khetriwal et al., 2009).
Lack of Strategic Planning. The rapid changes in technology due to changes in the behaviors of competitors, consumers, suppliers, etc., sound strategic planning is necessitated for the implementation policy and regulation of sustainable e-waste management. It is indicated by experts that the role of a regulator is most significant in ensuring effective implementation of the rule, its responsibility for building a simple but transparent system of reporting and monitoring progress. This can be achieved by strategic planning keeping all the major factors in view (Ravi & Shankar, 2005).
Determinants of Willingness to Pay
Knowledge and Awareness
E-waste knowledge is vital and can be disseminated through communication or action, particularly in educational settings (Azodo et. al, 2017). However, a general lack of awareness about e-waste hazards and poor management approaches contribute to e-waste issues (eStewards, 2013). This unawareness can pose health risks, especially when handling or reusing expired products (Hossain et al., 2010). Studies reveal varying levels of e-waste management knowledge across countries. For example, households in Jordan have low e-waste knowledge (Tarawneh and Saidan, 2013), while in Anambra, Africa, knowledge about government e-waste management rules and the harmful effects of electronic components is alarmingly low (Okoye and Odoh, 2014). In contrast, most respondents in Ningbo, China, have e-waste management knowledge in terms of recycling and are aware of environmental labeling (Huang et. al, 2006). However, when tested thoroughly, most respondents were unable to provide the correct overview and examples (Okoye and Odoh, 2014; Sivathanu, 2016). This suggests that while some knowledge exists, there is still a need for proper awareness and practice concerning waste management (Licy et al., 2013). Furthermore, a study by Kalana (2010) found that while the public in Shah Alam had in-depth knowledge about e-waste, most respondents did not know the correct ways of disposing of it. This is supported by Nur Sumaiyyah et. al (2015), who argued that consumers were not aware of the right way of treating e-waste, despite local authorities in Selangor implementing the separation of solid waste starting on 1st September 2015, by the Solid Waste and Public Cleansing Management Act 2007 (Act 672) (Department of National Solid Waste Management, 2015). This indicates that while some regions have made efforts to manage e-waste, there is still a significant gap in public awareness and knowledge about proper e-waste disposal methods.
Participation in E-Waste Management
Understanding consumers’ recycling behavior can provide insights into the accumulation of e-waste, a crucial factor in estimation that requires further consideration (Islam & Huda, 2019). This is particularly important in emerging economies like India, which has a large consumer electronics market. Consumers are a key component of e-waste recycling schemes, and their active participation and engagement determine the success of a recycling initiative (Kumar, 2019). However, understanding the domestic flow of e-waste towards organized waste management interventions in an urban context is complex due to its dependence on consumer behavior and dispersed generation (Rodrigues et al., 2020). The involvement of multiple stakeholders in the entire process of e-waste generation to recycling and final disposal further complicates the estimation of the flow (Borthakur, 2014). Despite efforts to understand the determinants of consumers’ waste disposal and the motivations and barriers related to their recycling behavior (Casey et al., 2019), there is a lack of understanding in academic literature regarding consumers’ engagement with e-waste management, particularly in emerging economies, and their intention to recycle or sell their e-waste (Kumar, 2019). Therefore, studies in urban metropolises of emerging economies could provide valuable insights into consumers’ perceptions of their obsolete electronic equipment and associated disposal behavior.
Perceptions on E-waste
E-waste, containing hazardous substances such as aluminum, cadmium, mercury, brominated flame retardants, complex plastic blends, and lead, poses significant risks to human health and the environment (Pandit & Dey, 2018). In Tamale, Ghana, major e-waste disposal strategies include selling e-waste to scrap dealers and donating, with respondents’ age, education level, and income influencing these strategies (Owusu-Sekyere et al., 2018). E-waste management can provide successful procurement and assortment through material disposal, turning e-waste into a profitable business opportunity (Jadhav, 2013). However, proper management and e-waste disposal practices are needed, with awareness and adequate education being key factors (Moletsane& Venter, 2018). In India, existing e-waste management processes face various challenges, including insufficient laws, inventory challenges, health risks from informal recycling, lack of knowledge, and corporate reluctance to address crucial concerns (Sahu, 2019). Adequate control of e-waste requires an inventory of end-of-life electronic items and the construction of an environmentally acceptable regulatory system for recycling (Rautela et al., 2021). In the United Arab Emirates, recycling was found to be the most important option in the e-waste processing system, but poor economic and environmental awareness of e-waste among stakeholders means that e-waste management system actions must be accelerated (Alblooshi et al., 2022).
Theory Base
The study uses Ajzen’s (1991) Theory of Planned Behavior, Schwartz’s (1977) Norm Activation Model, the Theory of Public Goods (Oakland, 1987), the Protection Motivation Theory (Rogers, 1975), and the Rational Choice Theory (Blume & Eastley, 2008) to understand e-waste management. It suggests that if individuals believe their actions will lead to specific outcomes, feel supported, and believe they have the ability and resources, they are more likely to engage in e-waste segregation activities and fund environmental costs. The formation of behavior toward a willingness to pay for environmental costs is governed by a person’s awareness of consequences, responsibility, and sense of obligation to understand the harmful effects of improper segregation of electronic wastes. Since dealing with e-waste management is a concern for everyone, people should pay for its environmental cost, and there must be a collaborative effort to strengthen e-waste segregation or disposal. Consumers are likely to demonstrate proactive behaviors and show a willingness to pay for the environmental cost of electronic waste to prevent potential harm to people and the environment. The willingness to pay for the environmental cost of electronic waste largely depends on consumers’ rational decisions.
Conceptual Framework
Figure 3 shows the analytical framework of the study. Herein, it presents the independent and dependent variables of the study. The independent variables are the socio-demographic profile of the consumers and determinants of willingness to pay the environmental cost of e-waste. On the other hand, the dependent variable is willingness to pay an amount for the environmental cost of electronic waste in Davao City. In this context, this paper aims to determine consumers’ willingness to pay for the environmental cost of e-waste based on their socio-demographic profile and willingness to pay determinants.
Independent Variable Dependent Variable
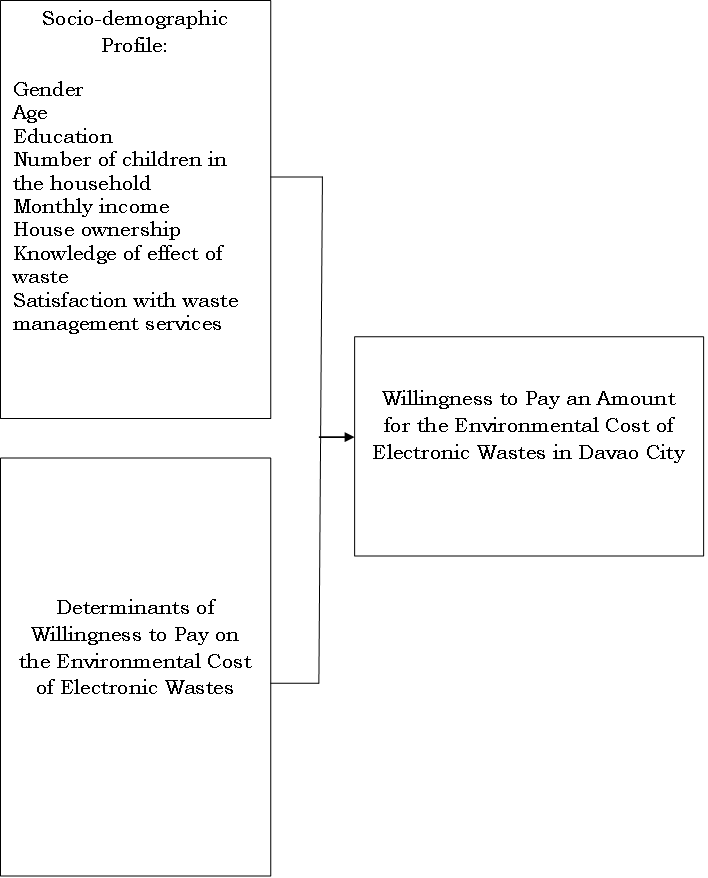
Figure 3. Schematic diagram showing the relationship between the independent and dependent variables.
Null Hypothesis
The null hypothesis of the study was tested at alpha .05 in the level of significance:
H0 1: None of the socio-demographic profiles of the consumers significantly influence their willingness to pay for the environmental cost of e-waste.
METHODOLOGY
This chapter presented the methodology of the study. These comprised of methods used, research locale, sources of data, data gathering instruments, sampling technique, procedure of the study, and statistical treatment.
Methods Used
This study made use of a quantitative approach using a cross-sectional survey research design. Quantitative design is defined as a systematic investigation of phenomena by gathering quantifiable data and performing statistical, mathematical, or computational techniques. Also, it collects information from existing and potential customers using sampling methods and sending out online surveys, online polls, questionnaires, etc., the results of which can be depicted in the form of numerical. After careful understanding of these numbers predict the future of a product or service and make changes accordingly (QuestionPro, 2020).
Specifically, this utilized a cross-sectional survey design. It is a type of research design in which the data are collected from many different individuals at a single point in time (Thomas, 2020). Also, this method is often used to make inferences about possible relationships or to gather preliminary data to support further research and experimentation (Cherry, 2019). In this design, the researcher observed the variables without influencing them. In the context of the study, this design was apt to the study since the data needed required measurement of consumers’ willingness to pay for the environmental cost of e-waste based on their socio-demographic profile and willingness to pay determinants given at one testing period.
Research Locale
This study was conducted in Davao City which is a 1st class highly urbanized city in the island of Mindanao, Philippines. The city has a total land area of 2,443.61 km2 (943.48 sq mi), making it the largest city in the Philippines in terms of land area. It is the third-most populous city in the Philippines after Quezon City and Manila, and the most populous in Mindanao. As of 2020, the city has a total population of 1,825,450. It is geographically situated in the province of Davao del Sur and grouped under the province by the Philippine Statistics Authority, but the city is governed and administered independently from it. The city is divided into three congressional districts, which are subdivided into 11 administrative districts with a total of 182 barangays.
Davao City is the center of Metro Davao, the third-most populous metropolitan area in the Philippines. The city serves as the main trade, commerce, and industry hub of Mindanao, and the regional center of the Davao Region. Davao is home to Mount Apo, the highest mountain in the Philippines. The city is also nicknamed the “Durian Capital of the Philippines”. In the context of the study, the COVID-19 pandemic has increased the presence of e-waste in the city. Certainly, this study was apt to the area since teachers are consuming or contributing to the volume of e-waste. Sufficient data were obtained in the area.
Sources of Data
Primary data were used in this study. Three questionnaires were administered. The knowledge and awareness were composed of 7 items and participation on the E-waste questionnaire registered 4 questions. These questionnaires were adapted from Miner et. al, (2018). In addition, perceptions of e-waste consisted of 8 items. This was taken from Nuwematsiko et al. (2021). The questionnaires were validated and pilot-tested. The data were generated through the administration of a survey questionnaire. Survey questionnaires were distributed to the respondents to fill in the needed data required in the study. Face-to-face administration was done, however, health protocols were implemented to ensure the safety of the respondents and researcher since there was still an ongoing COVID-19 threat.
Data Gathering Instruments
The study utilized a survey questionnaire as a data-gathering instrument of the study. The use of a survey questionnaire involved the collection of information from a sample of individuals through their responses to questions or items. This was designed to provide a snapshot of how things are at a specific time (Denscombe, 1998). The questionnaire contains the demographic profile of the respondents plus the determinants of willingness to pay for e-waste.
Meanwhile, the questionnaires were subjected to content validation by a pool of experts. After the validation, the questionnaires were pilot-tested to check their reliability. The knowledge and awareness questionnaire obtained a Cronbach alpha of 0.967, 0.834 for participation in E-waste management, and perceptions on E-waste registered 0.964. This means that knowledge awareness and perceptions on E-waste questionnaires garnered excellent reliability while participation in E-waste management obtained good reliability. Taber (2018) indicated that Cronbach alpha values of 0.7 or higher indicate acceptable internal consistency. Further, the overall reliability of the questionnaire was 0.906 which was described as excellent.
Sampling Technique
The study used stratified random sampling, dividing the population into smaller sub-groups or strata based on shared attributes such as income or educational attainment (Hayes, 2020). The population of public high school teacher-electronic consumers from 22 clustered schools was used as the basis for sample identification. The sample size was calculated using Slovin’s formula, which allows for sampling a population with the necessary degree of precision (Stephanie, 2003). With a confidence level of 95 percent, as proposed by Kothari (2005), the sample data reflect the actual circumstance of the population within a designated accuracy range. The target population size of the research was 725 teacher-consumers of electronic products with a sampling error of 5%, resulting in a sample size of 258. Proportional allocation was used to make each stratum’s sample size proportional to the number of sampling units in that stratum (Glasgow, 2005). The formula used for proportional allocation is n1 = n N1 / N, where n1 is the number of sample units to be allocated to a stratum, n is the total number of sample units, and N1 is the population of the stratum. N is the overall population of the strata
Given this formula, the samples are computed as shown in Table 1.
Table 1: Distribution of Samples
| High School Teachers in Cluster School | Population | Samples |
| Alambre NHS | 7 | 2 |
| Baracatan NHS | 17 | 6 |
| Bartolome RLHS | 15 | 5 |
| Binugao NHS | 43 | 15 |
| Camansi NHS | 11 | 4 |
| Catigan NHS | 15 | 5 |
| Crossing BNHS | 194 | 69 |
| Dona Carmen NHS | 215 | 77 |
| Don Enrique NHS | 40 | 14 |
| Elias Lopez NHS | 18 | 6 |
| J.V. Ferriols NHS | 39 | 14 |
| Mt. Apo NHS | 6 | 2 |
| Ruperto CNHS | 7 | 2 |
| Sirawan NHS | 29 | 10 |
| Soledad Duterte NHS | 11 | 4 |
| Tibuloy NHS | 7 | 2 |
| Tungkalan NHS | 12 | 4 |
| Bayabas IS | 7 | 2 |
| Baracayo IS | 7 | 2 |
| Gasco & Centina IS | 7 | 2 |
| San Isidro IS | 5 | 2 |
| San Miguel IS | 13 | 5 |
| Total | 725 | 258 |
The Procedure of the Study
This study, several steps were undertaken to make this study successful. These were presented below:
Permission to Conduct the Study. Written communication was submitted to the Office of the Superintendent requesting permission to conduct the study. Another letter was given to the schools where the respondents were teaching.
Administer the Survey Questionnaire. The survey questionnaire was administered face-to-face since the existing policy has allowed it. This was also subjected to validation by a pool of experts. The data were then retrieved or collected.
Analysis and Interpretation of Data. The data were analyzed using appropriate statistical tools.
Statistical Treatment
The following statistical tools were utilized to answer the research questions in this study. These tools are presented below.
Mean and Frequency Counts. These were used to determine the socio-demographic profile of the consumers.
Net Present Value using Discounting Method. Net present value (NPV) is the difference between the present value of cash inflows and the present value of cash outflows over some time (Fernando, 2021). NPV uses discounted cash flows due to the time value of money (TMV). The time value of money is the concept that money you have now is worth more than the identical sum in the future due to its potential earning capacity through investment and other factors such as inflation expectations. In the context of the study, this analyzed how willing were the consumers to pay for the environmental cost of e-waste in the long run.
Probit Regression is a type of regression where the dependent variable can take only two values (willing or not willing). The purpose of the model is to estimate the probability that observation with particular characteristics will fall into a specific one of the categories; moreover, classifying observations based on their predicted probabilities is a type of binary classification model (Agresti, 2015).
PRESENTATION, ANALYSIS, AND INTERPRETATION OF DATA
This chapter presents a discussion of the variables used in the study. The socio‐demographic profile includes gender, age, education, number of children in the household, monthly income, house ownership, knowledge of the effect of waste, and satisfaction with waste management services. Also, the amount that consumers are willing to pay for electronic waste is discussed. Further, the determinants of willingness to pay for the environmental costs of electronic waste are presented last.
Socio‐Demographic Profile of the Consumers
This section highlights the socio‐demographic profile of the consumers. This consists of gender, age, education, number of children in the household, monthly income, house ownership, knowledge of the effect of waste, and satisfaction with waste management services.
Gender
Figure 4 presents data showing the frequency and percentage distribution of consumers of electronic products according to gender. As shown in this figure, there were 60 male consumers of electronic products, or 23%, and 198 female consumers of electronic products, or 77%.
In the final analysis, the majority of the consumers of electronic products were females. This corroborates the findings of Dupont (2004) as cited by Milovantseva (2016) and Swiader et. al (2018) that women are willing to participate more than men to avoid environmental health risks for their children, implying that women are more active in indulging environmental conservation activities.

Figure 4 Frequency and Percentage Distribution of Consumers of Electronic Products by Gender
Age
Presented in Figure 5 where the data on the frequency and percentage distribution of consumers of electronic products according to age. This revealed that there were 59 or 22.90% of consumers of electronic products who belonged to the age category of 21-30, 67, or 26.00% who belonged to age the age group of 31-40, 88 or 34.10% who are in the age bracket of 41-50, 14 or 15.90% who belonged to the age category of 51-60, and 3 or 1.20% who are in the age bracket of 61 and above. This implied that the majority of the household water users were 51 and above years of age.
In the final sense, the majority of the consumers of electronic products belonged to the age category of 41-50. This result confirmed the findings of Baral et al., (2008) and Togridou et al., (2006) that age is most often positively related to the WTP for conservation, this entails that a person’s participation in environmental causes decreases as age increases.
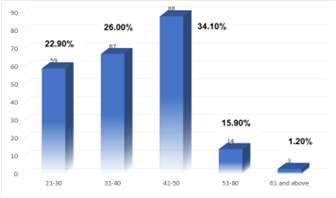
Figure 5 Frequency and Percentage Distribution of Consumers of Electronic Products by their Age Categories
Figure 6 presents data showing the frequency and percentage distribution of education among consumers of electronic products. This table reveals that there were 2 or 0.80% obtained a doctorate, there were 63 consumers, 24.40% earned a master’s degree, and 188, or 72.90% of the consumers acquired a college degree.
In the final inquiry, the majority of consumers of electronic products obtained college degrees. The results of the study affirmed the findings of Kollmuss & Agyeman (2002) that educational background is positively correlated with environmental knowledge, with more time spent in educational institutions resulting in better environmental knowledge and Franzen & Meyer (2010) added that higher education increases environmental concerns.
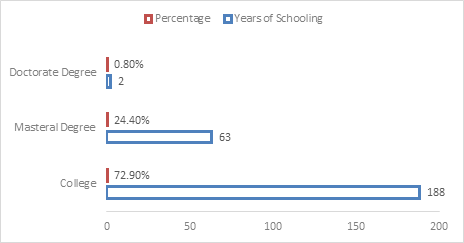
Figure 6 Frequency and Percentage Distribution of Education among Consumers of Electronic Products
Figure 7 presents data showing the frequency and percentage distribution of consumers of e-products in terms of number of children. As shown in this figure, there were 195, or 76.00% of the consumers of electronic products have 0-2 children, 55 or 21.00% of the consumers of electronic products belonged to the 3-4 Number of children category, and 8 or 3.00% of the consumers of electronic products have 5-6 children at home.
In the final inquiry, the majority of the consumers of e-products have 0-2 children at home. These results affirmed the findings of the Economic and Social Research Council (ESRC) (2011) that the presence of dependent children in the household is associated with a lower willingness to pay more for e-waste.
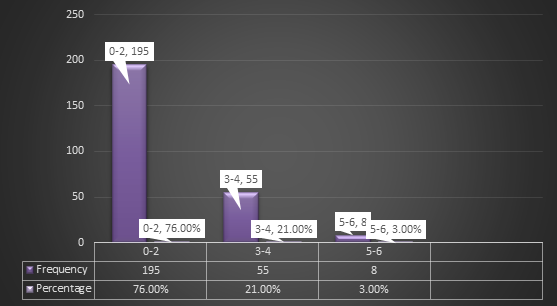
Figure 7 Frequency and Percentage Distribution of Consumers of e-products in terms of Number of Children
Shown in Figure 8 are the frequency and percentage distribution of consumers of electronic products in terms of income in pesos. It appeared in this figure, that there were 210, or 81.40% of the consumers of electronic products belonged to the income bracket of 20,000.00-29,999.00, 41 or 15.90% of the consumers of electronic products belonged to the income group of 30,000.00-39,999.00, 6 or 2.30% and 8 of the consumers were within the income group of 40,000.00-49,999.00, and 1 or 0.40% of the consumers of electronic products belonged to the income bracket of 50,000.00and above bracket.
In the final sense, the majority of the consumers of electronics belonged income bracket of 20,000.00-29,999.00. These results support the findings of Preisendörfer (1999) and Han et. Al (2011) that the income of households significantly affects participation in environmental activities, in addition, the higher the income of the family the greater the environmental involvement.
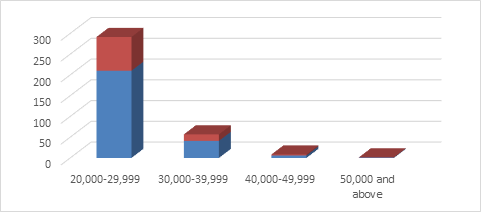
Figure 8 Frequency and Percentage Distribution of Consumers of Electronic Products in Terms of Income in Pesos
Shown in Figure 9 were the frequency and percentage distribution of consumers of electronic products in terms of house ownership. This figure shows that there were 30 or 11.60% of the consumers of electronic products rented their house, and 228, or 88.40% of the consumers of electronic products owned their houses.
In the final inquiry, the majority of the consumers of electronics owned their houses. These results support the findings of Shove (2010) that home ownership is a very necessary factor that affects involvement in environmental activities. Further, the pro-environmental behavior of individuals is shaped by their household structure, the size of which hurts pro-environmental behavior (Longhi, 2013) and environmental concerns in general (Johnson et al., 2004).
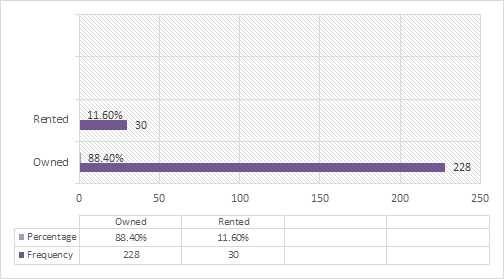
Figure 9 Frequency and Percentage Distribution of Consumers of Electronic Products in Terms of House Ownership
Shown in Figure 10 were the frequency and percentage distribution of consumers of electronic products in terms of awareness of the health effects of poor disposal of waste. As displayed in the figure, there were 249, or 96.50% of the consumers of electronic products were aware of the health effects of poor waste disposal, and 9, or 3.50% of the consumers were unaware of the health effects of poor waste disposal.
In the final sense, the majority of the consumers of electronic products were aware of the health effects of poor waste disposal. These results support the findings of Okoye and Odoh (2014) and Delhi by Kwatra, Pandey, and Sharma (2014) that knowledge about e-waste management and the harmful effects of electronic components on the health of the population is very important in today’s situation.
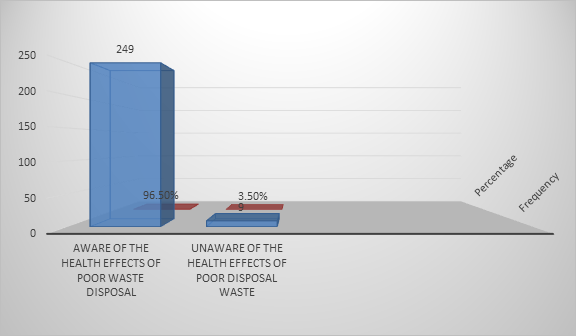
Figure 10 Frequency and Percentage Distribution of Consumers of Electronic Products in Terms of Awareness of the Health Effects of Poor Disposal of Waste
Figure 11 shows the frequency and percentage distribution of consumers of electronic products in terms of in terms of satisfaction with waste management services. It can be gleaned from the figure that there were 139 or 54.00% of the consumers of electronic products were satisfied with the waste management of the local government unit, and 119, or 46.00% of the consumers were not satisfied with the waste management of the local government unit.
In the final analysis, the majority of the consumers of electronic products were satisfied with the waste management of the local government unit. These results are supported by the findings of Baud (2001) that solid waste management is an important aspect of citizens’ lifestyles and the country’s economic status. United Nations Development Programme in 2008, collaborates further, that waste management is a crucial aspect of sustaining the national development.
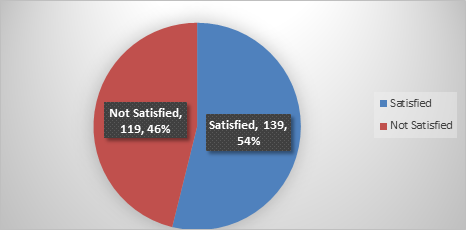
Figure 11 Frequency and Percentage Distribution of Consumers of Electronic Products in Terms of Satisfaction with Waste Management Services
Presented in Figure 12 were the frequency and percentage distribution of consumers of electronic products in terms of the amount of willingness to pay for the cost of e-waste. It appeared in the figure that there were 195 or 75.60% of the consumers belonged to the bracket amount of 25.00-50.00, 49 or 19.00% of the consumers belonged to the willingness category of 75.00-100.00 pesos, 9, or 3.50% were within the range of 125.00-150.00 pesos, and 5 or 2.00% of the consumers of electronic products were in the category of 225.00-250.00 amount of willingness to pay.
In perusal, the majority of the consumers of electronic products were within the bracket of 25.00-50.00 pesos willing to pay for the cost of e-waste. These results are consonance with the findings of Straub & Thomassin (2006) and Thilmany, Bond, & Bond, (2008) that consumers are willing to pay more for products perceived to have positive effects on the environment.
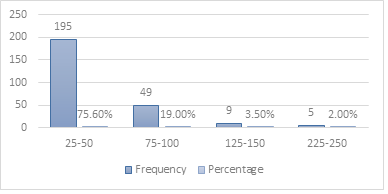
Figure 12 Frequency and Percentage Distribution of Consumers of Electronic Products in Terms Willingness to Pay for the Cost of E-waste
Figure 13 presents the frequency and percentage distribution of consumers of electronic products in terms of knowledge and awareness of e-waste. The figure shows that there were 6 or 2.326% of the consumers belonged to the transmuted grade bracket of 74 and below, 6 or 2.326% of the consumers belonged to the transmuted grade bracket of 75-79, 34 or 13.178% of the consumers fell within 80-84, 24 or 9.302% of the consumers belonged to 85-89 grade bracket, and 188 or 72.868% of the consumers were within the grade bracket of 90-100in terms of knowledge and awareness of e-waste.
In the final sense, the majority of the consumers of electronic products were within the grade bracket of 90-100 in terms of knowledge and awareness cost of e-waste. These results support the statement of Hossain et al., (2010) that a lack of awareness and cautionary information on effective and appropriate management operations associated with e-waste may pose health hazards to humans.
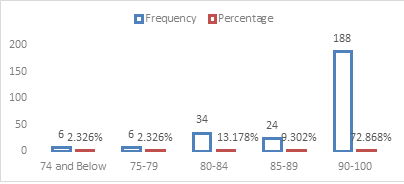
Figure 13 Frequency and Percentage Distribution of Consumers of Electronic Products in Terms of Knowledge and Awareness of E-waste
Figure 14 presents the frequency and percentage distribution of consumers of electronic products in terms of perception of e-waste. The figure shows that there were 9 or 3.000% of the consumers belonged to the transmuted grade bracket of 74 and below, 7 or 3.000% of the consumers belonged to the transmuted grade bracket of 75-79, 52 or 20.000% of the consumers fall within 80-84, 41 or 16.000% of the consumers belonged to 85-89 grade bracket, and 149 or 58.000% of the consumers were within the grade bracket of 90-100 in terms of knowledge and awareness of e-waste.
In the final analysis, the majority of the consumers of electronic products were within the grade bracket of 90-100 in terms of perception of e-waste. These results collaborate with the conclusions of Pandit & Dey (2018) that low perception or awareness of e-waste could bring serious risk to human health and the environment as it typically comes from hardware comprised of aluminum, cadmium, mercury, brominated flame retardants, complex plastic blends, and lead.
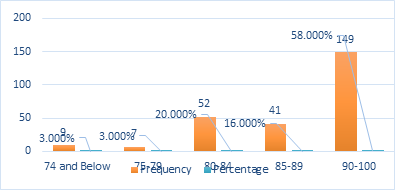
Figure 14 Frequency and Percentage Distribution of Consumers of Electronic Products in Terms of Perception of E-waste
Figure 15 presents the frequency and percentage distribution of consumers of electronic products in terms of participation in e-waste management. The figure shows that there were 9 or 3.500% of the consumers belonged to the transmuted grade bracket of 74 and below, 2, or 0.780% of the consumers belonging to the transmuted grade bracket of 75-79, 57, or 22.090% of the consumers fall within 80-84, 23 or 8.900% of the consumers belonged to 85-89 grade bracket, and 167 or 64.730% of the consumers were within the grade bracket of 90-100 in terms of knowledge and awareness of e-waste.
In the final sense, the majority of the consumers of electronic products were within the grade bracket of 90-100 in terms of knowledge and awareness cost of e-waste. These results are supported by the findings of Rodrigues et al. (2020) that the consumers, as important stakeholders, decide the success of a recycling initiative through their active participation and engagement. Further, it is imperative to understand the domestic flow of E-waste toward well-organized waste management interventions owing to its reliance on consumer behavior.
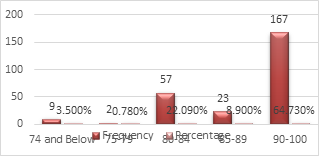
Figure 15 Frequency and Percentage Distribution of Consumers of Electronic Products in Terms of Participation in E-waste Management
Figure 16 presents the frequency and percentage distribution of consumers of electronic products in terms of willingness to pay for the cost of e-waste. The figures reveal that there were 64 or 24.80% of the consumers manifested their willingness to pay for the cost of e-waste, and 194, or 75.20% of the consumers showed their unwillingness to pay for the cost of e-waste.
In the final analysis, the majority of the consumers of electronic products were unwilling to pay for the cost of e-waste. These results support the findings of Li, Chen, Zhou, Beattie, & He, (2018) that the payment for environmental services (PES) varies according to different stakeholders, likewise Ramzan et al., (2019) have observed that consumers’ unwillingness to take part in formal recycling practices is a great challenge to successful environmentally sound E-waste management.
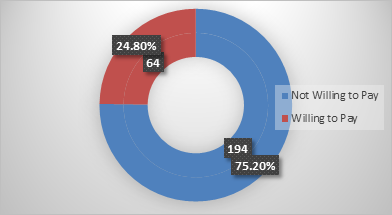
Figure 16 Frequency and Percentage Distribution of Consumers of Electronic Products in Terms of Willingness to Pay for the Cost of E-waste
Amount of the Willingness to Pay among the Consumers on the Environmental Costs of Electronic Waste in the Long Run
This section utilized the Net Present Value formula in determining how much consumers will pay for the environmental costs of electronic waste. The NPV formula is reflected below:
NPV =Total Present Value of Cash Inflows – Cost of E-waste (Investment Cost)
In this context, the researcher estimated the willingness to pay using Net Present Value (NPV) this methodology is a widely used tool for investment decisions. It is considered theoretically sound and normatively suggested in many corporate finance textbooks (Magni, 2005). This was done by obtaining the average of the willingness to pay of the consumers amounting to Php. 41.67 per kilogram/month and assumed a discounted rate of 10 percent for five years. This was calculated and presented below.
Table 2. Consumers on the Environmental Costs of Electronic Waste in the Long Run
| Year | Cash Flow | Discounting Factor | Present Value |
| 0 | Php. 41.67 | 1 | Php. 41.67 |
| 1 | 41.67 | 0.909 | 37.88 |
| 2 | 41.67 | 0.826 | 34.92 |
| 3 | 41.67 | 0.751 | 31.29 |
| 4 | 41.67 | 0.683 | 28.46 |
| 5 | 41.67 | 0.621 | 25.88 |
| Total Present Value | Php. 158.43 | ||
NPV= Total Present Value of Cash Inflows – Cost of E-waste (Investment Cost)
=Php. 158.43 – 41.67
=Php. 116.76
It can be gleaned that the Net Present Value or the amount of willingness to pay among consumers on the environmental costs of electronic waste, in the long run, is Php. 116.76.
Determinants of Willingness to Pay on the Environmental Costs of Electronic Wastes
Table 3 presents the determinants of willingness to pay for the costs of electronic waste. The determinants include gender, age, education, number of children, monthly income, house ownership, knowledge of the effect of e-waste, satisfaction with waste management services, knowledge and awareness, participation in electronic waste, and perceptions of electronic waste.
Among the determinants age, number of children, monthly income, and satisfaction with waste management services significantly influence consumers’ willingness to pay for the costs of electronic waste. Age got a p-value of 0.043, a number of children registered a p-value of 0.000, monthly income obtained a p-value of .036 and .000 for satisfaction with waste management services. This indicates that the null hypothesis is rejected.
Further, a year increase in age the more likely the consumers to pay for the environmental cost of e-waste by .031. Meanwhile, as the number of children per household increases, the less likely consumers to pay for the cost of electronic waste by 0.904. In addition, as monthly income increases, the more likely consumers to pay for the cost of electronic waste by 0.051. Moreover, as the satisfaction with waste management services of the local government decreases, the less likely the consumers to pay for the environmental cost of electronic waste by 2.154.
Moreover, the Likelihood Chi-Square value of 133.668 with a p-value of .000 indicated that the model as a whole is statistically significant, that is, it fits significantly better than a model with no predictors.
The findings above agree with the results of Adebo and Ajewole (2012) showed that WTP for waste disposal was significantly affected by gender; nature of the primary occupation, marital status, level of education, and average monthly income.
Moreover, the Economic and Social Research Council (ESRC), (2011) indicated the presence of dependent children in the household is associated with a lower willingness to pay more for environmentally friendly products. Also, Fisher, Bashyal, and Bachman (2012) noted that the presence of children in the household was used as a demographic variable. The study found that people with children in their households were more likely to exhibit environmentally friendly behaviors. Further, Laroche et al., (2001) studied consumers located in neighborhoods in a large North American city where recycling programs were available and advertised. They used five questions measuring behaviors toward the environment, including recycling and buying environmentally unfriendly products. They reported that married females with at least one child living at home were willing to pay more for environmentally friendly products.
Additionally, Loureirro et al., (2002) interviewed consumers who buy apples at two grocery stores in the Portland, Oregon area. They measured willingness to pay more for apples labeled as environmentally friendly using certification by the Food Alliance through a bidding process. Their findings indicated that females with children under the age of 18 were the most willing to pay more for environmentally friendly apples.
Meanwhile, Rodrigues et al., (2020) indicated that consumers, as important stakeholders, decide the success of a recycling initiative through their active participation and engagement. In an urban context, it is imperative to understand the domestic flow of E-waste toward well-organized waste management interventions although situating this flow is complicated owing to its reliance on consumer behavior and dispersed generation. Further, the fact that many stakeholders are involved in the entire process of e-waste generation to its recycling plus the final disposal estimates the flow even more complex (Borthakur, 2014).
Table 3. Determinants of Willingness to Pay for the Costs of Electronic Wastes
| Variables | Estimate | SE | 95% CI | ||
| LL | UL | p | |||
| Intercepts | 8.305 | 3.919 | .624 | 15.985 | .034 |
| Gender | .264 | .284 | -.292 | .821 | .351 |
| Age | .031 | .015 | .001 | .060 | .043 |
| Education | .011 | .073 | -.132 | .153 | .884 |
| Number of Children | -.904 | .242 | -1.378 | -.430 | .000 |
| Monthly Income | .051 | .040 | 1.805 | .001 | .036 |
| Home Ownership | .109 | .332 | -.541 | .759 | .742 |
| Knowledge of the Effects of E-Waste | -.156 | .454 | -1.047 | .734 | .731 |
| Satisfaction with Waste Management | -2.514 | .390 | -3.277 | -1.750 | .000 |
| Knowledge and Awareness of E-Waste | .016 | .020 | -.023 | .054 | .422 |
| Perception of E-Waste | -.015 | .019 | -.053 | .023 | .439 |
| Participation in Waste Management | .034 | .020 | -.004 | .073 | .079 |
| Chi-Square
p-value |
133.668
.000 |
||||
SUMMARY, CONCLUSION AND RECOMMENDATION
This chapter presents the summary of the findings of the study. Also, conclusions that are based on the results of the study are generated. Further, from the results and conclusions generated, recommendations are formulated.
Summary of Findings
The study found that the majority of the participants were female (77%), aged 41 to 50 (34.10%), and held a bachelor’s degree (72.90%). Most participants had 0 to 2 children (76.00%) and owned a house. The majority of the participants earned a monthly income of 20,000 to 29,999, while the least earned 50,000 and above. Most participants were aware of the health effects of poor waste disposal and were satisfied with waste management services. When it came to e-waste, most were willing to pay within the bracket of 25.00-50.00. Using the Net Present Value through the Discounting Method with the average monthly amount of Php 41.67 per sack with a 10 percent discount for five years, the consumer’s willingness to pay on environmental costs of electronic wastes is Php 116.76
The result of Probit analysis revealed that age registered a p- p-value of 0.043, number of children obtained a p-value of .000, income obtained a p-value of 0.036, and .000 p-value for satisfaction with waste management services and participation in electronic waste. This indicates that the null hypothesis was rejected. Further, age, number of children, income, and satisfaction with waste management services were significant determinants of willingness to pay among consumers for environmental costs of electronic waste.
Conclusions
Based on the findings of the study, the following conclusions were drawn:
- The profile of the consumers showed a higher number of females, most of them were under the age bracket of 41 to 50, with bachelor’s degree, with 1 to 2 children, having an income between 20,000.00-29,999.00 bracket, owned a house, aware of the health effect of poor disposal waste disposal and satisfied with waste management services.
- The amount of willingness to pay consumers on environmental costs of electronic waste was Php 41.67 per sack per month.
- Probit analysis result revealed that age, number of children, income, and satisfaction with waste management services were significant determinants of willingness to pay on environmental costs of electronic wastes.
Recommendations
From the significant findings generated, the following are recommended:
- Establish an e-waste recycling policy that will place an emphasis on end users’, suppliers’, and manufacturers’ accountability and the necessity of having a system for cooperation among multiple stakeholders, including the government, producers, consumers, and especially the informal sectors.
- Integrate sustainable recycling of e-waste that benefits entrepreneurs, suppliers, end-users, the society at large, and the environment through implanting a rewards system.
- For a sustainable environment, it is important to educate young adults and cultivate an e-waste recycling habit among the general public while also taking into account their unwillingness to sacrifice their time and money
- Conduct further research to assess the integration of a reward system for sustainable management of e-waste in the locality as part of the legislative initiative.
REFERENCES
- Abrahamse, W., Steg, L., Vlek, C., & Rothengatter, T. (2007). The effect of tailored information, goal setting, and tailored feedback on household energy use, energy-related behaviors, and behavioral antecedents. Journal of Environmental Psychology, 27(4), 265–276.
- Achachlouei, M. A., Moberg, Å., & Hochschorner, E. (2015). LCA of a magazine- Part 1: Tablet edition in emerging and mature states. Journal of Industrial Ecology, 19(4), 575)589.
- Adebo, G. M., & Ajewole, O. C. (2012). Gender and the urban environment: Analysis of willingness to pay for waste management disposal in Ekiti-State, Nigeria. American International Journal of Contemporary Research, 2(5), 228–236.
- Afroz, R., Hanaki, K., & Hasegawa-Kurisu, K. (2009). Willingness to pay for waste management improvement in Dhaka city, Bangladesh. Journal of Environmental Management, 90(1), 492-503.
- Agarwal, R. (2007). E-waste law: New paradigm or business as usual? Toxic links, http://www.toxiclinks.org
- Agresti, A. (2015). Foundations of linear and generalized linear models. New York: Wiley. pp. 183-186.
- Ahmad Faisal, A., Mohd Bakri, I., Siti Nur Awanis, M. Z., & Rusamah, A. J. (2014). E-waste management: An emerging global crisis and the Malaysian scenario. International Journal of Environmental Sciences, 4(4), 444–457.
- Ajzen, I. (1985). From intentions to actions: A theory of planned behavior. In Action Control: From Cognition to Behavior; Kuhl, J., Beckmann, J., Eds.; Springer Berlin Heidelberg: Berlin/Heidelberg, Germany, pp. 11-39.
- Ajzen, I. (1991). The theory of planned behavior. Organizational Behavior and Human Decision Processes, 50(2), 179-211.
- Alam, Z. (2016). The assessment of the of E-waste management generated from cellular phones, laptops, and personal computers in the Philippines. Manila Journal of Science, 9, 27-42.
- Alegre, A. G., & Borcena, P. G. (2010). Philippines- Foundation for media Alternatives. http://www.giswatch.org/sites/default/files/gisw 2010 country philippines en.pdf
- Anderson, R. C., & Hansen, E. N. (2004). Impact of environmental certification on preferences for wood furniture: A conjoint analysis approach. Forest Products Journal, 54(3), 42-50.
- Anjum, R. (2013). Willingness to pay for solid waste management services: A case study of Islamabad. Pakistan Institute of Development Economics.
- Araújo, M. G., Magrini, A., Mahler, C. F., & Bilitewski, B. (2012). A model for estimation of potential generation of waste electrical and electronic equipment in Brazil. Waste Management, 32(2), 335–342.
- Ayvaz, B., Bolat, B., & Aydin, N. (2015). Stochastic reverse logistics network design for waste of electrical and electronic equipment. Resour. Conserv. Recycl., 104, 391–404.
- Awasthi, K. A., Zeng, X., & Li, L. (2016). Environmental pollution of electronic waste recycling in India: A critical review. Environ. Pollut., 211, 259-270.
- Babington, J. C., Siwar, C., Farijm, A., & Rawshan, A. B. (2010). Bridging the gaps: An e-waste management and recycling assessment of material recycling faciities in Selangor and Penag. International Journal of Environmental Sciences, vol. 1.
- Baldé, C. P., Forti, V., Gray, V., Kuehr, R., & Stegmann, P. (2017). The global e-waste monitor 2017: Quantities, flows, and resources. UnitedNations University: Bonn, Germany; Geneva, Switzerland; Vienna, Austria.
- Balde, C. P., Wang, F., Kuehr, R., & Huisman, J. (2015). The global e-waste monitor 2014: Quantities, flows and resources. United Nations University, UNU-IAS Institute for the Advanced Study Sustainability: Bonn, Germany, 1-74.
- Balmford, A., Bruner, A., Cooper, P., Costanza, R., Farber, S., Green, R.
- E., Jenkins, M., Jefferiss, P., Jessamy, V., Madden, J., Munro, K., Myers, N., Naeem, S., Paavola, J., Rayment, M., Rosendo, S., Roughgarden, J., Trumper, K., & Turner, R. K. (2002). Economic reasons for conserving wild nature. Science, 297, 950-953.
- Baral, N., Stern, M. J., & Bhattarai, R. (2008). Contingent valuation of
- ecotourism in Annapurna conservation area, Nepal: Implications for sustainable park finance and local development. Ecological Economics, 66(2-3), 218–227.
- Barba-Gutiérrez, Y., Adenso-Díaz, B., & Hopp, M. (2008). An analysis of some environmental consequences of European electrical and electronic waste regulation. Resour. Conserv. Recycl., 52(3), 481-495.
- Basiru, H. A. (2017). Economic value and determinants of effective household solid waste collection services in Kano, Nigeria. Universiti Putra Malaysia.
- Bhandari, A. K., & Heshmati, A. (2010). Willingness to Pay for Biodiversity Conservation. Journal of Travel and Tourism Marketing, 27(6), 612–623.
- Bisschop, L. (2014). How e-waste challenges environmental governance. Int. J. Crime, Justice Soc. Democr., 3(2), 81-85.
- Blume, L., & Easley, D. (2008). Rationality, The New Palgrave Dictionary of Economics (2nd Edition). http://www.dictionaryofeconomics.com/article?
- Bogale, A., & Urgessa, B. (2012). Households’ willingness to pay for improved rural water service provision: Application of contingent valuation method in eastern Ethiopia. Journal of Human Ecology, 38(2), 145–154.
- Bougherara, D., Grolleau, G., & Mzoughi, N. (2009). Buy local, pollute less: What drives households to join a community supported farm? Ecological Economics, 68(5), 1488–1498.
- Breivik, K., Armitage, J. M., Wania, F., & Jones, K. C. (2014). Tracking the global generation and exports of e-waste. Do existing estimates add up? Environmental Science and Technology, 48(15), 8735–8743.
- Brennan, D., Tapsuwan, S., & Ingram, G. (2007). The welfare costs of
- urban outdoor water restrictions. Australian Journal of Agricultural and Resource Economics, 51, 243-261.
- Brocas, I., & Carrillo, J. (2018). The determinants of strategic thinking inpreschool children. PLOS ONE, 13(5), 1-14.
- Bruderer-Enzler, H., & Diekmann, A. (2015). Environmental impact and pro-environmental behavior: Correlations to income and environmental concern. ETH Zurich Sociology Working Papers, No. 9.
- Bubeck, P., Botzen, W. J. W., & Aerts, J. C. J. H. (2012). A review of risk perceptions and other factors that influence flood mitigation behavior. Risk Anal., 32, 1481-1495.
- Cai, K., Song, Q., Peng, S., Yuan, W., Liang, Y., & Li, J. (2019). Uncovering residents’ behaviors, attitudes, and WTP for recycling e-waste: A case study of Zhuhai City, China. Environmental Science and Pollution Research, 27, 2386-2399.
- Carisma, B. (2009). Drivers of and barriers to e-waste management in the Philippines (Master’s thesis, Lund University, Sweden). http://lup.ub.lu.se/studentpapers/record/1511085/file/1511091.pdf
- Chan, T. S. (1996). Concerns for environmental issues and consumer purchase preferences: A two-country study. Journal of International Consumer Marketing, 9(1), 43-55.
- Cheng, C.-P., & Chang, T.-C. (2017). The development and prospects of the waste electrical and electronic equipment recycling system in Taiwan. J. Mater. Cycles Waste Manag., 20, 667-677.
- Cherry, K. (2019). How does the cross-sectional research method work?. https://www.verywellmind.com/what-is-a-cross-sectional-study-2794978
- Cicatiello, L., Ercolano, S., Gaeta, G. L., & Pinto, M. (2020). Willingness to pay for environmental protection and the importance of pollutant industries in the regional economy. Evidence from Italy. Ecol. Econ., 177, 106774.
- Clark, C. F., Kotchen, M. J., & Moore, M. R. (2003). Internal and external influences on pro-environmental behavior: Participation in a green electricity program. Journal of Environmental Psychology, 23(3), 237-246.
- Cruz-Sotelo, S. E., Ojeda-Benítez, S., & Sesma, J. J. (2017). E-waste supply chain in Mexico: Challenges and opportunities for sustainable management. Sustainability, 9, 503.
- Cunningham, K. (2020). New study highlights the rise in e-waste during global pandemic https://www.recyclingtoday.com/article/study-highlights-pandemic-drives-increase-e-waste/
- Daniels, P. (2002). Approaches for quantifying the metabolism of physical economies– Part II review of individual approaches. Journal of Industrial Ecology, 6(1), 65-88.
- Daniels, P., & Moore, S. (2001). Approaches for quantifying the metabolism of physical economies– Part I methodological overview. Journal of Industrial Ecology, 5(4), 69-93.
- Dawson, K. E. (2916). The ethical issues of dumping electronic waste in India. Ethics Essay Contest. http://digitalcommons.augustana.ed u/ethicscontest/7
- De Almeida, A. T. (2013). Decision making process in organizations: Building multicriteria decision models. https://integrada.minhabibLioteca.com.br/#/books/9788522481491
- Denscombe, M. (1998). The good research guide: For small-scale social research projects. Buckingham: Open University Press.
- Discussion Paper, International Telecommunication Union (2011). GSR. www.itu.int/08 e-waste, do Paco, A., Raposo, M., & Walter, F. L. (2009). Identifying the green
- consumer: A segmentation study. Journal of Targeting, Measurement and Analysis for Marketing, 17(1), 17-25
- Duan, H., Miller, T. R., Gregory, J., Kirchain, R., & Linnell, J. (2013). Quantitative characterization of domestic and transboundary flows of used electronics. MIT Materials Systems Laboratory: Cambridge, MA, USA.
- Eccles, R., Ioannou, I., Li, S. X., & Serafeim, G. (2012). Pay for Environmental Performance: The Effect of Incentive Provision on Carbon Emissions. https://dash.harvard.edu/bitstream/handle/1/10018989/13-043.pdf?sequence=1&isAllowed=y
- Ecoinvent Centre (2010). Ecoinvent database v2.2. Swiss center for life cycle inventories. Economic and Social Research Council (2011). When it comes to the environment, education affects our actions. https://www.sciencedaily.com/releases/2011/03/110321093843.htm
- EPA (2021). Economic incentives. https://www.epa.gov/environmental-economics/economic-incentives
- Ercolano, S., Gaeta, G. L., & Romano, O. (2014). Environmental tax reform and individual preferences: An empirical analysis on European micro data. J. Behav. Exp. Econ., 51, 1-11.
- Fadilpasic, S. (2020). E-waste has become critical concern during the pandemic. https://www.itproportal.com/news/e-waste-has-become-critical-concern-during-pandemic/
- Fatihah, S., Rakmi, A. R., Arij, Y., & Mohd Shahbudin, M. (2014). E-waste management scenarios in Malaysia. Journal of Waste Management, 1, 1-7.
- Fatima, J. K., Khan, H. Z., & Goh, E. (2016). Environmental knowledge and behavioural outcomes of tourism students in Australia: Towards testing a range of mediation and moderated mediation effects. Environmental Education Research, 22(5), 747-764.
- Fernando, J. (2021). Net present value. https://www.investopedia.com/terms/n/npv.asp
- Fisher, C., Bashyal, S., & Bachman, B. (2012). Demographic impacts on environmentally friendly purchase behaviors. Journal of Targeting, Measurement and Analysis for Marketing, 20(3/4), 172-184.
- Fisher, B., Edwards, D. P., Giam, X., Wilcove, D. S. (2011). The high costs of conserving Southeast Asia’s lowland rainforests. Front. Ecol. Environ., 9, 329-334.
- Fornalczyk, A., Willner, J., Francuz, K., & Cebulski, J. (2013). E-waste as a source of valuable metals. Arch. Mater. Sci. Eng.
- Franzen, A., & Meyer, R. (2010). Environmental attitudes in cross-national perspective: A multilevel analysis of the ISSP 1993 and 2000. Eur. Sociol. Rev., 26, 219-234.
- Furlow, N. E., & Knott, C. (2009). Who’s reading the label? Millennials ’use of environmental product labels. The Journal of Applied Business and Economics, 10(3), 1-12.
- Garlapati, V. K. (2016). E-waste in India and developed countries: Management, recycling, business and biotechnological initiatives. Renewable Sustainable Energy Rev., 54, 874-881.
- Gomes, L. F. A. M., & Gomes, C. F. S. (2014). Managerial decision making: Multi-criteria approach (5th ed.), Atlas: São Paulo, Brazil.
- Grant, R., & Oteng-ababio, M. (2012). Mapping the invisible and real African economy: Urban e-waste circuitry. Urban Geography, 33(1), 1–21.
- Guarnieri, P. (2015). Synthesis of key criteria, methods and subproblems of multicriteria supplier selection. Rev. Adm. Contemp., 19, 1-25.
- Gutierrez, R. (2010). New age trade agreements and their possible contribution to toxic trade vol. 2, Environmental Law Network International, p. 46.
- Gutierrez, R., & Agarrado, G. (2011). The vanishing e-wastes of the Philippines. http://bantoxics.org/download/The % 20 Vanishing % 20 e-waste % 20 of % 20 the %20 Philippines.pdf
- Habuer, L., Nakatani, J., & Moriguchi, Y. (2014). Time-series product and substance flow analyses of end-of-life electrical and electronic equipment in China. Waste Management, 34(02), 489-497.
- Hahn, W. A., Härtl, F., Irland, L. C., Kohler, C., Moshammer, R., & Knoke, T. (2014). Financially optimized management planning under risk aversion results in even-flow sustained timber yield. Forest Policy Econ., 42, 30-41.
- Halkos, G., & Matsiori, S. (2017). Environmental attitude, motivations and values for marine biodiversity protection. Journal of Behavioral and Experimental Economics.
- Han, H. (2015). Travelers’ pro-environmental behavior in a green lodging context: Converging value-belief-norm theory and the theory of planned behavior. Tourism Management, 47, 164-177.
- Han, F., Yang, Z., Wang, H., & Xu, X. (2011). Estimating willingness to pay for environment conservation: A contingent valuation study of Kanas Nature Reserve, Xinjiang, China. Environmental Monitoring and Assessment, 180(1), 451-459.
- Hanisch, C. (2000). Is extended producer responsibility effective?. Environ Sci Technol., 34(7), 170-175.
- Hatayama, H., Daigo, I., Matsuno, Y., & Adachi, Y. (2012). Evolution of aluminum recycling initiated by the introduction of next-generation vehicles and scrap sorting technology. Resources, Conservation and Recycling, 66, 8–14.
- Hayes, A. (2020). Stratified random sampling. https://www.investopedia.com/terms/stratified random sampling.as
- He, K., Sun, Z., Hu, Y., Zeng, X., Yu, Z., & Cheng, H. (2017). Comparison of soil heavy metal pollution caused by e-waste recycling activities and traditional industrial operations. Environ. Sci. Pollut. Res., 24, 9387-9398.
- Honda, S., Khetriwal, D., & Kuehr, R. (2016). Regional e-waste monitor: East and Southeast Asia; United Nations University ViE-SCYCLE: Bonn, Germany.
- Hong, J., Shi, W., Wang, Y., Chen, W., & Li, X. (2015). Life cycle assessment of electronic waste treatment. Waste Management, 38, 357-565.
- ICOM Information & Communication (2008). Environmental leader. Older Demographics Biggest Users of Green Products. http://www.environmentalleader.com/2008/09/06/olderdemographics-biggest-users-of-green-products/
- ILO (2019). Decent work in the management of electrical and electronic waste (e-waste). https://www.ilo.org/wcmsp5/groups/public-ed_dialogue/-sector/documents/publication/wcms_673662.pdf
- ISO (International Organization for Standardization) (2006). Environmental management-life cycle assessment-general principles and framework. ISO 14040, Geneva, Switzerland.
- Janse, B., Schuur, P., & Brito, M. P. (2009). A reverse logistics diagnostic tool: The case of the consumer electronics industry. The International Journal of Advanced Manufacturing Technology, 47, 495-513.
- Jayaraman, V., & Luo, Y. (2007). Creating competitive advantages through new value creation: E- reverse logistics perspective. Academy Management Perspective, 1(2), 56-73.
- Jin, C. L., Qiu, J., Zhang, Y., Qiu, W., He, X., Wang, Y., Sun, Q., Li, M., Zhao, N., Cui, H., Liu, S., Tang, Z., Chen, Y., Li Yue Da, Z., Xu, X., Huang, H., Liu, Q., Bell, m. L., & Zhang, Y. (2015). Ambient air pollution and congenital heart disease in Lanzhou Environ. Res. Lett., 111, 435-441.
- Johnson, C. Y., Bowker, J. M., & Cordell, H. K. (2004). Ethnic variation in environmental belief and behavior: An examination of the new ecological paradigm in a social psychological context. Environment and Behavior, 36(2), 157-186.
- Johnson, M. R., & McCarthy, I. P. (2014). Product recovery decisions within the context of Extended Producer Responsibility. Journal of Engineering and Technology Management. Engineering and Technology Management for Sustainable Business Development. 34, 9-28.
- Joseph, K. (2007). Electronic waste management in India-Issues and strategies. Eleventh International Waste Management and Landfill Symposium. Sardinia.
- Julius, M., Charles, N., & Shylet, M. (2017). Determinants of willingness to pay for solid waste management in Gweru City, Zimbabwe. Alanya Academic Review Journal, 1(3), 15-21.
- Junaidah, A. K. (2010). Electrical and electronic waste management practice by households in Shah Alam, Selangor, Malaysia. International Journal of Environmental Science, 1(2), 132-144.
- Kalbali, E., Borazjani, M. A., Kavand, H., & Soltani, S. (2014). Factors affecting the willingness to pay of Ghorogh Forest Park visitors in Iran. International Journal of Plant, Animal and Environmental Sciences, 4(3), 368–373.
- Kang, H.-Y., & Schoenung, J. (2005). Electronic waste recycling: Areview of U.S infrastructure and technology options. Resource Conservation and Recycling, 45, 368-400.
- Kasaye, B. (2015). Farmers willingness to pay for improved soil conservation practices on communal lands in Ethiopia. JBEM/NBL
- Keller, R. P., Lodge, D. M., & Finnoff, D. C. (2007). Risk assessment for invasive species produces net bioeconomic benefits. Proc. Natl. Acad. Sci. USA, 104, 203-207.
- Khetriwal, D. S., Kraeuchi, P., & Widmer, R. (2009). Producer responsibility for e-waste management. Journal of Environmental Management, 90, 153-165.
- Khetriwal, D. S., Kraeuchi, P., & Schwaninger, M. (2005). A comparison of electronic waste recycling in Switzerland and in India. Environmental Impact Assessment Review, 25, 492-504.
- Kiddee, P., Naidu, R., & Wong, M. (2013). Electronic waste management approaches: An overview. Waste Management, 33(5), 1237-1250.
- King, S., Dyball, M., Webster, T., Sharpe, A., Worley, A., DeWitt, J.,
- Marsden, G., Harwatt, H., Kimble, M., & Jopson, A. (2009). Exploring public attitudes to climate change and travel choices: Deliberative research. Final Report for Department for Transport.
- Knoke, T., Gosling, E., & Paul, C. (2020) Use and misuse of the net present value in environmental studies. Ecological Economics, 174, 106664.
- Kollmuss, A., & Agyeman, J. (2002). Mind the gap: Why do people act environmentally and what are the barriers to pro-environmental behavior? Environ. Educ. Res., 8, 239-260.
- Kumar, A., & Dixit, G. (2018). An analysis of barriers affecting the implementation of e-waste management practices in India: A novel ISM-DEMATEL approach. Sustainable Production and Consumption, 14, 36-52.
- Kumar, A., Holuszko, M., Espinosa, D. C. R. (2017). E-waste: An overview on generation, collection, legislation and recycling practices. Resour. Conserv. Recycl., 122, 32-42.
- Lam, C. W., Lim, S.-R., & Schoenung, J. M. (2013). Linking material flow analysis with environmental impact potential–Dynamic technology transition effects on projected e-waste in the United States. Journal of Industrial Ecology, 17(2), 299–309.
- Laroche, M., Bergeron, J., & Barbaro-Forleo, G. (2001). Targeting consumers who are willing to pay more for environmentally friendly products. J. Consum. Mark., 18, 503-520.
- LARRDIS (2011). E-waste in India. New Delhi: Rajya Sabha Secretariat, Research Unit.
- Lau, K. H., & Wang, Y. (2009). Reverse logistics in the electronic industry of China: A case study. Supply Chain Management: An International Journal, 14(6), 447-465.
- Leszczynska, A. (2014). Willingness to pay for green products vs. ecological value system. International Journal of Synergy and Research, 3, 67-77.
- Li, P., Chen, M.-H., Zhou, Y., Beattie, M., & He, L. (2018). Factors affecting Inn operators’ willingness to pay resource protection fees: A case of Erhai lake in China. Sustainability, 10, 4049.
- Li, J., Lin, M., & Liu, L. (2011). Producer Responsibility Extension System and Electronic Waste Recycling. In 2011 Circular Economy and Energy Saving Carbon Reduction; CTCI Foundation: Taipei, Taiwan, pp. 71-86.
- Li, B., Yang, J., Lu, B., & Song, X. (2015). Estimation of retired mobile phones generation in China: A comparative study on methodology. Waste Management, 35, 247–254.
- Lin, W., & Liu, Y. (2012). Present status of e-waste disposal and recycling in China. Proc. Environ. Sci., 16, 506–514.
- Lindhqvist, T., & Lidgren, K. (1990). Models for Extended Producer Responsibility in Sweden.
- Lindhqvist, T. (1992). Towards an [EPR]- analysis of experiences and proposals.
- Lindhqvist, T. (2000). Extended producer responsibility in cleaner production: Policy principle to promote environmental improvements of product systems (Doctoral dissertation). Accessed from the International Institute for Industrial Environmental Economics dissertations.
- Ling-Yee, L. (1997). Effect of collectivist orientation and ecological attitude on actual environmental commitment: The moderating role of consumer demographics and product involvement. Journal of International Consumer Marketing, 9(4), 31–53.
- Liu, S. K., Zeng, H., & Liu, Y. (2012). The status and progress of resource utilization technology of e-waste pollution in China. International Conference on Waste Management and Technology, Procedia Environmental Sciences, 16, 515-521.
- Longhi, S. (2013). Individual pro-environmental behaviour in the household context. Technical report, ISER Working Paper Series.
- Lorenzoni, I., Nicholson-Cole, S., & Whitmarsh, L. (2007). Barriers perceived to engaging with climate change among the uk public and their policy implications. Global Environmental Change, 17(3), 445-459.
- Loureirro, M. L., McCluskey, J. J., & Mittlehammer, R. C. (2002). Will consumers pay a premium for eco-labeled apples? Journal of Consumer Affairs, 36(2), 203-219.
- Lusk, J. L., & Hudson, D. (2004). Willingness-to-pay estimates and their relevance to agribusiness decision making. Review of Agricultural Economics, 26(2), 152-169.
- Magni, Carlo Alberto, Reasoning the ‘Net-Present-Value’ Way: SomeBiases and How to Use Psychology for Falsifying Decision Models (2005). Available at SSRN: https://ssrn.com/abstract=1673371 or http://dx.doi.org/10.2139/ssrn.1673371
- Mahat, H., Hashim, M., Saleh, Y., Nayan, N., & Norkhaidi, S. B. (2017). Confirmation of e-waste sustainable management instrument in the community. International Journal of Academic Research in Economics and Management Sciences, 6(4), 41-56.
- Mamat, M. P., Yacob, M. R., Radam, A., Noor, a. G. A., Ghani, A., & Fui, H. (2013). Willingness to pay for protecting natural environments in Pulau Redang Marine Park, Malaysia, 7(25), 2420–2426.
- Marshall, R. E., & Farahbakhsh, K. (2013). Systems approaches to integrated solid waste management in developing countries. Waste Management, 33(4), 988-1003.
- Mateo, J. (2019). Phone discarded yearly by 2021. https://onenews.ph/phl-s-e-waste-problem-over-24-m-phones-discarded-yearly-by-2021
- McCullough, B. P., Pfahl, M. E., & Nguyen, S. N. (2016). The green waves of environmental sustainability in sport. Sport Soc., 19, 1040-1065.
- Meyer, R., & Liebe, U. (2010). Are the affluent prepared to pay for the planet? Explaining willingness to pay for public and quasi-private environmental goods in Switzerland. Population and Environment, 32(1), 42-65.
- Milovantseva, N. (2016). Are American households willing to pay a premium for greening consumption of information and communication technologies? J. Clean. Prod., 127, 282–288.
- Modaresi, R., & Muller, D. B. (2012). The role of automobiles for the future of aluminum recycling. Environmental Science and Technology, 46(16), 8587–8594.
- Morren, M., & Grinstein, A. (2016). Explaining environmental behavior across borders: A meta-analysis. Journal of Environmental Psychology, 47, 91-106.
- Movsesyan, G., & Zagheni, E. (2013). How do demographic factors Influence environmental attitudes? https://paa2014.princeton.edu/papers/143239
- Naeem, U., Khattack, R., & Amin, S. (2013). Willingness to pay for the treatment of environmental hazards: A case Study Peshawar. Asian Economic and Financial Review, 3(7), 831-842.
- Naidoo, R., Balmford, A., Ferraro, P. J., Polasky, S., Ricketts, T. H., & Rouget, M., 2006. Integrating economic costs into conservation planning. Trends Ecol. Evol., 21, 681-687.
- Nakajima, N., & Vanderburg, W. H. (2006). A description and analysis of the German packaging take-back system. Bulletin of Science, Technology, and Society, 6(6).
- Nguyen, H. T. T., Lee, C.-H., & Hung, R.-J. (2021). Willingness of end users to pay for e-waste recycling. Global J. Environ. Sci. Manage., 7(1), 47-58.
- Nguyen, H. T. T., Hung, R.-J., Lee, C.-H., & Nguyen, H. T. T. (2018). Determinants of residents’ e-waste recycling behavioral intention: A case study from Vietnam. Sustainability, 11, 164.
- Nguyen, D. Q., Ha, V. H., Eiji, Y., & Huynh, T. H. (2017). Material flows from electronic waste: Understanding the shortages for extended producer responsibility implementation in Vietnam. Procedia CIRP, 61, 651-656.
- Niringiye, A. (2010). Determinants of willingness to pay for solid waste management in Kampala City. Current Research Journal of Economic Theory, 2(3), 119-122.
- Niu, R., Wang, Z., Song, Q., & Li, J. (2012). LCA of scrap CRT display at various scenarios of treatment. Proc. Environ. Sci., 16, 576-584.
- Nkansha, E., Dafor, N, K., & Essel-Gaisey, F. (2015). Willingness to pay for improved solid waste disposal in Tema Metropolis. UDS International Journal of Development, 2(9).
- Nnorom, I. C., & Osibanjo, O. (2008). Overview of electronic waste (e-waste) practices and their applications in the developing countries. Resource, Conservation and Recycling, 52, 843-858.
- Nur Sumaiyyah, S., Gautam, L. S., & Mohd Badruddin, M. Y. (2015). Current waste generation of E-waste and challenges in developing countries. An overview. Malaysian Journal of Civil Engineering, 27(1), 110–120.
- Oakland, W. H. (1987). Theory of public goods. In Handbook of public conomics, Vol. 2, pp. 485-535.
- OECD (2001). Extended producer responsibility: A guidance manual for governments. Paris, France.
- Okoye, A., & Odoh, C. (2014). Assessment of the level of awareness of E-Waste management and concern for the environment amongs the populace in Onitsha, Soustheastern Nigeria. Journal of Environmental Protection, 1, 120-134.
- Orlowski, J., & Wicker, P. (2019). Willingness to pay in sports. In The SAGE Handbook of Sports Economics; Downward, P., Humphreys, B.R., Frick, B., Pawlowski, T., Ruseski, J.E., Soebbing, B.P., Eds.; Sage: Thousand Oaks, CA, USA, pp. 415–427.
- Othman, N., Osman, N. A., Chelliapan, S., & Mohammad, R. (2017). Life cycle assessment: A comparison study on the various electronic waste management option. International Journal of Civil Engineering and Technology, 8(8), 1177-1185.
- Othman, N., & Kamaruddin, R. M. A. (2015). Prediction of electronic waste disposals. Journal of Technology, 10, 1–6.
- Pek, C. K., & Othman, J. (2010). Household demand for solid waste disposal options in Malaysia. Munich Personal RePEC Archive.
- Perkins, D., Drisse, M.-N. B., Nxele, T., & Sly, P. (2014). E-waste: A global hazard. Annals of Global Health, 80(4), 286-295.
- Pothitou, M., Hanna, R. F., & Chalvatzis, K. J. (2016). Environmental knowledge, pro-environmental behaviour and energy savings in households: An empirical study. Applied Energy, 184, 1217-1229.
- Preisendörfer, P. (1999). Environmental attitudes and pro-environmental behavior in Germany; Leske and Budrich: Leverkusen, Germany.
- QuestionPro (2020). Quantitative research. https://www.questionpro.comblog/quantitative-research/
- Ra, K., Kim, E. S., Kim, K. T., Kim, J. K., & Lee, J. M. (2013). Assessment of heavy metal contamination and its ecological risk in the surface sediments along the coast of Korea. J. Coast. Res., 65, 105-110.
- Rafia, A., Muhammad Mehedi, M., Rulia, A., & Jarita, D. (2012). Public environmental awareness and performance in Kuala Lumpur city, Malaysia: A case study on household electrical and electronic equipment. Environment and Urbanization Asia, 3(2), 385-396.
- Raghupati, L., Kruger, C., Chaturvedi, A., Arora, R., & Henzler, M. (2013). E-waste recycling in India-Bridging the gap between the informal and formal sector. https://mait,gtz,Adelphi.
- Rajarao, R., Sahajwalla, V., Cayumil, R., Park, M., & Khanna, R. (2014). Novel approach for processing hazardous electronic waste. Procedia Environ. Sci., 21, 33-41.
- Ramzan, S., Liu, C., Munir, H., & Xu, Y. (2019). Assessing young consumers’ awareness and participation in sustainable e-waste management practices: A survey study in Northwest China. Environmental Science and Pollution Research, 26, 20003–20013.
- Ravi, V., & Shankar, R. (2014). Reverse logistics: Insights from sectoral analysis of Indian manufacturing industries. International Journal of System Management, 17(2), 234-259.
- Ravi, V., & Shankar, R. (2005). Analysis of interactions among barriers of reverse logistics. Technological Forecasting and Social Change, 72, 1011-1029.
- Realff, M., Raymond, M., Jane, C., & Ammons, J. (2004). E-waste an opportunity. Materials Today, 7, 40-45.
- Richa, K., Babbitt, C. W., Gaustad, G., & Wang, X. (2014). A future perspective on lithium-ion battery waste flows from electric vehicles. Resources, Conservation and Recycling, 83, 63–76.
- Roberts, J. A. (1996). Green consumers in the 1990s: Profile and implications for advertising. Journal of Business Research, 36(3), 217-231.
- Rogers, R. W. (1975). A protection motivation theory of fear appeals and attitude change. J. Psychol., 91, 93-114.
- Rogers, R. W. (1983). Cognitive and physiological processes in fear appeals and attitude change: A revised theory of protection motivation. In Social Psychophysiology: A Sourcebook; Cacioppo, B.L., Petty, R.E., Eds.; Guilford Press: London, UK.
- Rogers, D. S., & Tibben-Lembke, R. S. (2011). Going backwards: Reverse logistics trends and practices. University of Nevada e-Reverse Logistics Executive Council. Reno. Disponível em: <http://www.rlec.org/reverse.pdf>. Acesso em: 19 mai. 2011.
- Rotter, V. S., Chancerel, P., & Schill, W. P. (2011). Practicalities of individual producer responsibility under the WEEE directive: experiences in Germany. Waste Management and Research, 29(9), 931-944.
- Rulia, A., Mehedi, Muhammad, M., & Rafia, A. (2014). Household perception and recycling behaviour on electronic waste management: A case study of Kuala Lumpur, Malaysia. Malaysian Journal of Science, 33(1), 32-41.
- Runting, R. K., Ruslandi, Griscom, B. W., Struebig, M. J., Satar, M., Meijaard, E., Burivalova, Z., Cheyne, S. M., Deere, N. J., Game, E. T., Putz, F. E., Wells, J. A., Wilting, A., Ancrenaz, M., Ellis, P., Khan, F. A. A., Leavitt, S. M., Marshall, A. J., Possingham, H. P., Watson, J. E. M., & Venter, O. (2019). Larger gains from improved management over sparing–sharing for tropical forests. Nat. Sust., 2, 53-61.
- Schluep, M. (2009). Recycling from e-waste to resources: Sustainable innovation and technology transfer industrial sector studies. Bonn: UNEP-UNU, Solving the E-waste Problem (StEP), 2009. Disponível em:<http://www.unep.org/PDF/PressReleases/E-waste publicatio n screen FINALVERSION-sml.pdf
- Schuhmann, P. W., Skeete, R., Waite, R., Lorde, T., Bangwayo-Skeete, P., Oxenford, H. A., & Spencer, F. (2019). Visitors’ willingness to pay marine conservation fees in Barbados. Tour. Manag., 71, 315-326.
- Schwartz, S. H. (1977). Normative influences on altruism, in advances in experimental social psychology (Vol. 10), L. Berkowitz (ed.), Academic Press, New York, pp. 221-279.
- Shooshtarian, S., Maqsood, T., Wong, P., Khalfan, M., & Yang, R. J. (2021). Extended Producer Responsibility in the Australian Construction Industry. Sustainability, 13(2), 620.
- Shove, E. (2010). Beyond the abc: climate change policy and theories of social change. Environment and Planning A, 42(6), 1273-1285.
- Sivaramanan, S. (2013). E-waste management, disposal and its impacts on the environment. https://www.researchgate.net/publication/267217916
- Soares-Filho, B., Moutinho, P., Nepstad, D., Anderson, A., Rodrigues, H., Garcia, R., Dietzsch, L., Merry, F., Bowman, M., Hissa, L., Silvestrini, R., & Maretti, C. (2010). Role of Brazilian Amazon protected areas in climate change mitigation. Proc. Natl. Acad. Sci. USA, 107, 10821-10826.
- Song, Q., Wang, Z., Li, J., & Zeng, X. (2012). Life cycle assessment of TV sets in China: a case study of the impacts of CRT monitors. Waste Manag., 32(10), 1926-36.
- SRI (2018). From worst to good practices in secondary metals recovery. https://www.sustainablerecycling.org/wpcontent/uploads/2018/07/worst-practices-web-25.7.18.pdf
- Steg, L., & Vlek, C. (2009). Encouraging pro-environmental behaviour: An integrative review and research agenda. Journal of Environmental Psychology, 29(3), 309–317.
- Stevens, J. (1996). Applied multivariate statistics for the social sciences.(3rd ed.). Mahwah, NJ: Lawrence Erlbaum. Chapter 11.
- Sthiannopkao, S., & Wong, M. H. (2013). Handling e-waste in developed and developing countries: Initiatives, practices, and consequences. Sci. Total Environ.
- Straub, M. O., & Thomassin, P. J. (2006). Product attributes and consumer willingness to pay for Environmental Management Systems in Agriculture: Using the choice modeling technique. Paper presented at the American Agricultural Economics Association Annual Meeting, Long Beach, CA.
- Straughan, R. D., & Roberts, J. A. (1999). Environmental segmentation alternatives: A look at green consumer behavior in the new millennium. Journal of Consumer Marketing, 16(6), 558-575.
- Suckling, J., & Lee, J. (2015). Redefining scope: The true environmental impact of smartphones? International Journal of Life Cycle Assessment, 20(8), 1181–1196.
- Sutter, M., Zoller, C., & Glatzle-Rutzler, D. (2019). Economic behavior of children and adolescents: A first survey of experimental economics results. European Economic Review, 111, 98-121.
- Suvarapu, L. N., & Baek, S. O. (2016). Determination of heavy metals in the ambient atmosphere. Toxicol. Ind. Indus. Heal., 33(1).
- Swiader, M., Szewranski, S. Z., & Kazak, J. (2018). Foodshed as an example of preliminary research for conducting environmental carrying capacity analysis. Sustainability, 10, 882.
- Tabachnick, B. G., & Fidell, L. S. (2007). Using multivariate statistics. (5th ed.). Boston, MA: Allyn & Bacon.
- Taghipour, H., Amjad, Z., Jafarabadi, M. A., Gholampour, A., & Norouz, P. (2014). Determining heavy metals in spent compact fluorescent lamps (CFLs) and their waste management challenges: Some strategies for improving current conditions. Waste Management.
- Tanskanen, P. (2013). Management and recycling of electronic waste. Acta Materialia, 61, 1001-1011.
- Tassie, K., & Endalew, B. (2020). Willingness to pay for improved solid waste management services and associated factors among urban households: One and one half bounded contingent valuation study in Bahir Dar City, Ethiopia. Cogent Environmental Science, 6(1), 1807275.DOI:10.1080/23311843.2020.1807275
- Tawawneh, A., & Saidan, M. (2013). Household’s awareness, behaviors and willingness to participate in e-waste management in Jordan. International Journal of Ecosystem, 3(5), 124-131.
- Thilmany, D., Bond, C. A., & Bond, J. K. (2008). Going local: Exploring consumer behavior and motivations for direct food purchases. American Journal of Agricultural Economics, 90(5), 1303-1309.
- Thomas, L. (2020). What is a cross-sectional study. https://www.scribbr.com/methodology/cross-sectional-study/
- Togridou, A., Hovardas, T., & Pantis, J. D. (2006). Determinants of visitors’ willingness to pay for the National Marine Park of Zakynthos, Greece. Ecological Economics, 60, 308–319.
- Tully, S. M., & Winter, R. S. (2014). The role of the beneficiary in willingness to pay for socially responsible products: A meta-analysis. J. Retail., 90, 255-274.
- Udhayakumar, T. (2017). Disposal methods of e-waste in India Survey conducted in Chennai. Int. J. Appl. Environ. Sci., 12(3), 505-512.
- Umberger, W. J., Feuz, D. M., Calkins, C. R., & Killinger, K. (2002). U.S. consumer preference and willingness-to-pay for domestic corn-fed beef versus international grass-fed beef measured through an experimental auction. Agribusiness, 18, 491–504.
- Veronesi, M., Chawla, F., Maurer, M., & Lienert, J. (2014). Climate change and the willingness to pay to reduce ecological and health risks from wastewater flooding in urban centers and the environment. Ecol. Econ., 98, 1-10.
- Wakolbinger, T., Toyasaki, F., Nowak, T., & Nagurney, A. (2014). When and for whom would e-waste be a treasure trove? Insights from a network equilibrium model of e-waste flows. J. Prod. Econ., 154, 263-273.
- Wang, F., Huisman, J., Stevels, A., & Balde, C. P. (2013). Enhancing e-waste estimates: Improving data quality by multivariate input-output analysis. Waste Management, 33(11), 2397–2407.
- Wang, W. C., Lin, Y. H., Lin, C. L., Chung, C. H., & Lee, M. T. (2012). DEMATEL-based model to improve the performance in a matrix organization. Expert Syst. Appl., 39(5), 4978-4986.
- Warren-Thomas, E. M., Edwards, D. P., Bebber, D. P., Chhang, P., Diment, A. N., Evans, T. D., Lambrick, F. H., Maxwell, J. F., Nut, M., O’Kelly, H. J., Theilade, I., & Dolman, P. M. (2018). Protecting tropical forests from the rapid expansion of rubber using carbon payments. Nat. Commun., 9, 911.
- Wath, S. B., Vaidya, A. N., Dutt, P. S., & Chakrabarti, T. (2010). A roadmap for development of sustainable e-waste management system in India. Sci. Total Environ., 409(1), 19-32.
- Wath, S. B., Dutt, P. S., & Chakrabarti, T. (2011). E-waste scenario in India, its management and implications. Environ. Monit. Assess.
- Widmer, R., Oswald-Krapf, H., Sinha-Khetriwal, D., Schnellmann, M., & Böni, H. (2005). Global perspectives on e-waste. Environmental Impact Assessment Review.
- Widmer, R., Krapf, H. O., Khetriwal, D. S., Schnemann, M., & Boni, H. (2005). Global perspective on e-waste. Environmental Impact Assessment Review, 25, 436-458.
- Witzke, H. P., & Urfei, G. (2001). Willingness to pay for environmental protection in Germany: Coping with the regional dimension. Reg. Stud., 35, 207-214.
- Yano, J., Hirai, Y., Okamoto, K., & Sakai, S. (2014). Dynamic flow analysis of current and future end-of-life vehicles generation and lead content in automobile shredder residue. Journal of Material Cycles and Waste Management, 16, 52-61.
- Yu, J., Williams, E., Ju, M., & Yang, Y. (2010). Forecasting global generation of obsolete personal, computers. Environmental Science and Technology, 44(9), 3232-3237.
- Zhang, K., Wu, Y., Wang, W., Li, B., Zhang, Y., & Zuo, T. (2015). Resources, conservation and recycling Indium from waste LCDs: A review. Resources, Conserv. Recycl., 104(100), 276–290.