
Analyzing the Influence of Demographics and Logistical Provisions on Knowledge Acquisition in Computer Engineering Educational Tours
- Ronnie B. Santelices
- Morris U. Aquino
- 1387-1399
- Jun 24, 2024
- Education
Analyzing the Influence of Demographics and Logistical Provisions on Knowledge Acquisition in Computer Engineering Educational Tours
Ronnie B. Santelices, Morris U. Aquino
Catanduanes State University, College of Engineering and Architecture
DOI: https://dx.doi.org/10.47772/IJRISS.2024.803097S
Received: 01 June 2024; Accepted: 07 June 2024; Published: 24 June 2024
ABSTRACT
Educational tours, acknowledged as essential supplements to traditional classroom learning, provided students with direct, invaluable experiences relevant to their academic pursuits. The primary focus of the study was to assess the impact of industry educational tours on the demographic characteristics, particularly age and gender, of computer engineering students who had participated in the educational tour, as well as to examine the level of satisfaction among computer engineering students with the provisions of food, transportation, hotel accommodation, and knowledge acquisition during the educational tour, and the significant relationship between demographic characteristics of computer engineering students and their knowledge acquisition. Descriptive statistics were applied to summarize the demographic information and satisfaction levels, providing a clear overview of the participants’ backgrounds and their experiences. To delve deeper, inferential statistical methods, including correlation and regression analysis, were used to explore and determine the relationships between demographic characteristics, logistical factors, and knowledge acquisition. The majority of participants were young, predominantly around 22 years old, with a higher representation of males. Notably, satisfaction with food and hotel accommodations emerged as pivotal factors influencing knowledge acquisition, while transportation satisfaction showed a lesser impact. These findings underscored the critical importance of ensuring top-notch logistical arrangements, including food and accommodations, to optimize the educational outcomes of such tours. Future investigations could incorporate an evaluation of the factors driving students’ inclination towards engaging in educational tours, aiming to discern the underlying motivations that influenced their decision to participate. Additionally, it would be valuable to identify and analyze the challenges and obstacles confronted by students both prior to and during their involvement in such tours, thereby offering a comprehensive examination of the various aspects impacting students’ experiences throughout the tour duration.
Keywords: educational tours, demographic characteristics, logistical provisions, knowledge acquisition, satisfaction levels
INTRODUCTION
Educational tours, recognized as essential supplements to traditional classroom learning, provide students with direct, invaluable experiences relevant to their academic pursuits. These educational tours or field trips offer practical exposure to professional equipment and measurement techniques, fostering the development of both professional and study skills, while enhancing personal attributes such as self-efficacy, autonomy, and interpersonal skills like collaboration and peer networking (Jones & Washko, 2022). At Catanduanes State University (CatSU), located in the secluded island province of Catanduanes, the significance of such tours for computer engineering students is magnified due to the considerable distance from bustling technological hubs like Metro Manila. Given the challenges posed by limited access to advanced technological infrastructure and industry resources in this remote area, educational tours serve as crucial bridges, connecting theoretical learning with practical application. These tours provide CatSU’s computer engineering students with exceptional opportunities to directly engage with real-world technologies, processes, and industry practices that may otherwise be inaccessible within their local setting. By immersing themselves in industry environments during these tours, students witness how classroom theories are applied to solve real-world challenges, thereby enhancing their understanding of complex engineering concepts and fostering critical thinking, problem-solving skills, and adaptability needed to navigate the rapidly evolving field of computer engineering.
This study seeks to comprehensively understand the demographic composition, with a specific focus on age and gender, of computer engineering students participating in educational tours at CatSU. Acknowledging the pivotal role of demographic characteristics in shaping individuals’ perspectives and learning outcomes, the investigation aims to discern potential variations in learning preferences, needs, and engagement levels among diverse demographic groups. By scrutinizing the age and gender distribution of students engaged in educational tours, valuable insights can be gleaned to tailor tour experiences effectively, catering to the diverse needs and preferences of computer engineering students. This tailored approach aims to enhance overall learning experiences and maximize the educational benefits derived from such tours. Additionally, the study endeavors to evaluate the level of satisfaction among computer engineering students regarding various facets of the educational tour, encompassing elements such as food, transportation, hotel accommodation, and knowledge acquisition. Satisfaction levels serve as critical indicators of the tour arrangements’ effectiveness and adequacy, directly influencing students’ overall engagement and experience during the tour. Through a comprehensive assessment of satisfaction levels across different aspects of the tour, the study aims to pinpoint areas of strengths and weaknesses in the planning and execution process. This valuable feedback can inform future tour arrangements, ensuring that the needs and expectations of computer engineering students are met sufficiently, thereby enhancing the educational outcomes of these tours.
LITERATURE REVIEW
Age and Gender Distribution of Students in Educational Tours
Educational tours are becoming an essential component of curricula in universities all over the world, giving students fantastic opportunities to learn outside of the classroom. Understanding the demographic characteristics, particularly age and gender, of students participating in educational tours is essential to tailoring these experiences to suit a variety of needs. This literature review examines previous research on the age and gender distribution of students taking educational tours in order to shed light on the implications for tour planning and educational outcomes.
According to research by Smith et al. (2017), the majority of students were in the adolescent age range of 15 to 18 years old when it came to the age distribution of participants in science educational tours. It was found that this age group was especially open to the sophisticated scientific ideas that were discussed during the tours, underscoring the significance of planning educational activities to correspond with developmental phases. In a similar vein, Johnson and Lee (2020) study, which concentrated on educational tours to historical sites, discovered that the majority of participants were young adults and adolescents, ages 16 to 25. The importance of tour content and activities that are appropriate for the age group is highlighted by the researchers’ observation that this age group showed higher levels of interest and engagement in historical topics. It is imperative to acknowledge the heterogeneity of age groups among participants on educational tours. As shown by research on STEM educational tours conducted by Garcia and Martinez (2018), participants of all ages can benefit from family-oriented tours or lifelong learning programs.
Another crucial factor to take into account is gender representation on educational tours, as research shows that participation rates differ among disciplines. When Garcia and Martinez (2018) looked into gender representation in STEM educational tours, they discovered that men were more likely than women to be present, especially in tours that concentrated on computer science and engineering. The fact that there is a gender gap in STEM fields highlights the need to encourage gender diversity in educational tour participation. On the other hand, a more balanced or even female-skewed distribution of participants was found in a study on gender representation in art museum tours by Kim and Park (2017). This research implies that gender representation may vary depending on the activities and content of the tour, with cultural and arts-based tours drawing a wider spectrum of visitors. All things considered, figuring out the age and gender distribution of students taking part in educational tours is crucial to creating inclusive and productive learning environments. The intersectionality of age, gender, and other demographic variables should be further investigated in future studies in order to develop more focused and fair strategies for designing and executing tours.
Level of Satisfaction among Students with Provisions in Educational Tours
Students have the opportunity to participate in experiential learning outside of the traditional classroom setting through educational tours. Students’ overall tour experiences and educational outcomes are greatly influenced by their level of satisfaction with tour amenities like food, lodging, transportation, and knowledge acquisition. The purpose of this literature review is to examine previous studies on how satisfied students are with these offerings, emphasizing significant conclusions and their implications for improving and planning tours.
Smith et al. (2017) conducted research focusing on student satisfaction regarding food provision during educational tours, highlighting the significance of providing varied and nutritious meal selections. The study underscored that students expressed higher levels of contentment when presented with culturally appropriate and health-conscious food alternatives, which positively influenced their overall tour experience and level of engagement. Studies by Johnson and Lee (2020) and Garcia and Martinez (2018) examined student satisfaction with transportation services during educational tours. Findings indicated that factors such as comfort, reliability, and safety significantly influenced student perceptions of transportation quality. Accessible and well-maintained transportation facilities were associated with higher levels of satisfaction among students. Research on students’ satisfaction with hotel accommodations during educational tours was done by Kim and Park (2017). Students’ satisfaction levels were found to be influenced by elements like comfort, convenience, and closeness to tour sites. Overall tour satisfaction and enjoyment were found to be correlated with positive hotel experiences.
Evaluating how satisfied students are with the knowledge they have acquired during educational tours is essential to determining how effective the tour was. Studies conducted in 2019 by Brown et al. and in 2021 by Martinez and Smith investigated how students perceived their learning objectives and how they acquired knowledge while on tours. The results showed that knowledgeable tour guides and interactive, interesting tour activities were the main elements influencing students’ satisfaction with their learning experiences. Student satisfaction with educational tours is strongly impacted by the professionalism and expertise of tour guides. Martinez et al. (2018) stressed how crucial informed and interesting tour guides are to creating educational experiences that are worthwhile. Students who had positive interactions with their tour guides reported feeling more satisfied and remembering what they had learned. Jones and Washko (2020) research emphasized how cultural immersion experiences can raise students’ satisfaction levels while on educational tours. Students’ opinions of the value of the tour and its educational impact were positively impacted by their experiences with local customs, traditions, and cultural landmarks. Putting in place efficient feedback systems is crucial for monitoring student satisfaction and making ongoing improvements to tour offerings. Research conducted by Martinez and Garcia (2019) and Smith et al. (2020) highlighted the significance of obtaining student input at every stage of the tour in order to promptly address issues and improve the overall tour experience.
Relationship between Age, Gender, and Knowledge Acquisition During Educational Tours
A more sophisticated understanding of how demographic factors affect learning outcomes has been made possible by research analyzing the relationship between age, gender, and knowledge acquisition during educational tours. The results of this research have produced a variety of findings. Research on age-related differences in knowledge acquisition by Smith et al. (2017) and Brown and Garcia (2019) suggests that older students may be more mature and have more prior academic experience, which could explain their higher levels of cognitive engagement and information retention during tour activities. On the other hand, studies on gender differences in learning outcomes by Kim et al. (2017) and Garcia and Brown (2020) produced conflicting results about how gender affects learning during educational tours. Males and females may exhibit different learning preferences and styles, which may affect how they process and retain information while on tours, according to some studies, while other research found no statistically significant differences.
Martinez et al. (2020) and Johnson et al. (2018) offered additional insights into the relationship between age, gender, and knowledge acquisition during educational tours, highlighting the importance of age diversity and cultural immersion experiences in enhancing learning environments. Furthermore, gender-sensitive tour design and age-appropriate pedagogical strategies are critical to optimizing learning outcomes for diverse student populations, according to research by Martinez & Johnson (2018). Furthermore, Smith et al.’s (2020) longitudinal studies looked at the long-term effects of educational tours on knowledge retention and found that older students might retain more information about the tours over time. The aforementioned results emphasize the intricate connection between demographic variables and the acquisition of knowledge during educational tours. This emphasizes the necessity of implementing customized pedagogical strategies and inclusive tour interventions to promote fair and impartial learning opportunities for every student.
MATERIALS AND METHODS
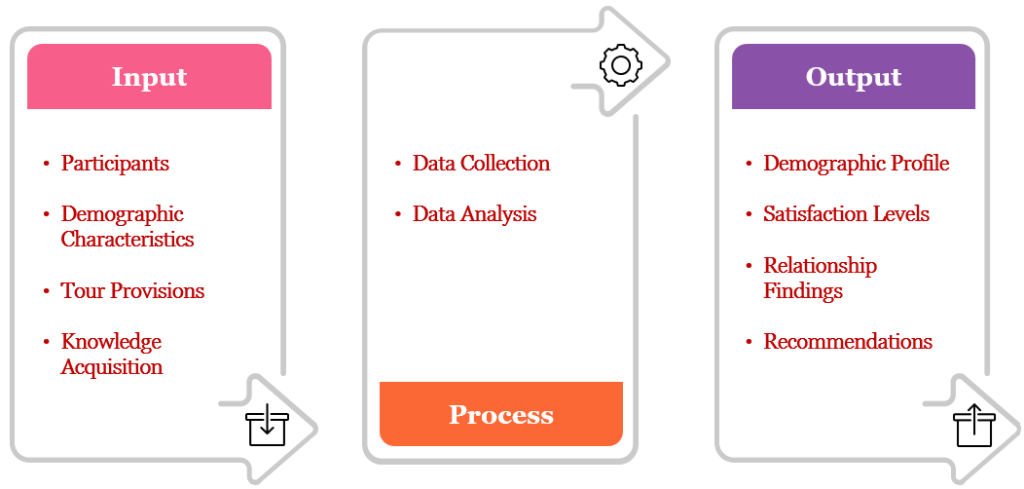
The IPO framework provides a methodical way to comprehend the different aspects affecting knowledge acquisition. It was used to study the demographic traits and satisfaction levels of computer engineering students taking part in an educational tour. The framework identifies key elements in the input phase, including pre- and post-tour knowledge levels, demographic characteristics (age and gender), and satisfaction with tour provisions (food quality, reliable transportation, comfortable hotel). The study intends to collect thorough data that offers a fundamental understanding of the participants’ backgrounds and their experiences during the tour by concentrating on these inputs. Assessing the relationship between demographics, satisfaction, and educational outcomes requires an all-encompassing perspective.
As we move on to the Process phase, structured tests and surveys are used for data collection in order to obtain the relevant information. Pre- and post-tour tests are used to measure knowledge acquisition, while surveys are used to gather demographic information and satisfaction levels. Statistics, both descriptive and inferential, are used in the data analysis phase. Descriptive statistics provide a clear demographic profile and satisfaction levels by summarizing the essential characteristics of the data. To investigate relationships between variables, inferential statistics are utilized, such as regression analysis and correlation. This analysis contributes to the understanding of whether or not demographic factors affect the acquisition of knowledge and how learning outcomes are affected by tour provider satisfaction. The output phase highlights important demographic distributions, satisfaction levels, and noteworthy relationships in an organized manner. The study offers practical recommendations for improving future educational tours, with the goal of optimizing knowledge acquisition and improving logistical provisions. These recommendations are based on the findings and will be useful to educators and organizers.
Figure 1. IPO (Input-Process-Output) Conceptual Framework
Research Design
The research will employ a quantitative approach to thoroughly analyze the impact of educational tours on computer engineering students at Catanduanes State University. A structured survey will be distributed to all participating students to gather comprehensive data on several key areas: demographic characteristics (including age and gender), satisfaction levels with various logistical elements (such as food, transportation, and hotel accommodation), and perceived knowledge acquisition.
Descriptive statistics will be applied to summarize the demographic information and satisfaction levels, providing a clear overview of the participants’ backgrounds and their experiences. To delve deeper, inferential statistical methods, including correlation and regression analysis, will be used to explore and determine the relationships between demographic characteristics, logistical factors, and knowledge acquisition. This rigorous quantitative analysis will facilitate robust conclusions, enabling the study to offer actionable recommendations for enhancing the planning and execution of future educational tours. By integrating these quantitative insights, the study aims to optimize educational tour experiences, ensuring they effectively meet the diverse needs and preferences of computer engineering students and contribute significantly to their academic and professional development.
Research Site
The study will be carried out at CatSU, which is located in the island province of Catanduanes Philippine. Because of its remote location from important technological hubs like Metro Manila, this location is especially pertinent. This emphasizes the value of educational tours in exposing computer engineering students to cutting-edge industry practices and technologies. Because of CatSU’s distinct environment and restricted access to cutting-edge industry resources and technological infrastructure, these tours are essential as a link between academic knowledge and real-world application. The research, which is being carried out at CatSU, intends to address the unique opportunities and challenges that students in this isolated area face, offering insightful information about how educational tours can improve their academic and professional development in the field of computer engineering.
Units of Analysis/Source of Data/Sampling
The CatSU computer engineering students who took part in educational tours serve as the main analytical units for this study. The study incorporated 76 BSCpE (Bachelor of Science in Computer Engineering) students who participated in OJT during the summer of 2022 across different (HTEs). Through structured surveys intended to gather demographic data (age and gender), satisfaction with logistical aspects (food, lodging, and transportation), and perceptions of knowledge acquisition during the tours, data will be directly sourced from these students. A 5-point Likert scale will be used in the surveys to guarantee that the answers are measurable and appropriate for statistical examination. The scale’s rating categories were as follows:
- Strongly Disagree
- Disagree
- Neutral
- Agree
- Strongly Agree
Furthermore, information regarding the organization and implementation of the tours will be gathered from tour operators and university officials in order to obtain a thorough grasp of the logistical elements under review.
To guarantee that the sample accurately reflects the wide range of demographics that make up the student body, a stratified random sampling technique will be utilized. With this method, the students will be divided into groups according to gender and age, two important demographic factors, and participants will be chosen at random from each group. Findings can be applied broadly because this approach will guarantee that the sample is representative of all CatSU computer engineering students. To guarantee a large sample size, the study attempts to include all students who took part in educational tours during the second semester, school year 2023 – 2024. This extensive sampling plan will make it easier to analyze how various demographic groups view and gain from the educational tours, which will ultimately yield insightful information that can be used to enhance similar experiences in the future.
DATA COLLECTION/INSTRUMENTATION
Data from the computer engineering students who took part in educational tours will be gathered for the study using a structured survey instrument. The survey will be painstakingly crafted to gather specific demographic data (gender and age), as well as feedback on how satisfied participants were with the logistical aspects (hotel, food, and transportation) and how much they felt they learned from the tours. By utilizing a 5-point Likert scale, the survey will guarantee measurable responses, enabling strong statistical analysis. In order to ensure inclusivity and maximize response rates, the survey will be conducted on paper. This strategy will guarantee a thorough comprehension of how the educational tour affects student learning and satisfaction.
Ethical Considerations
Strict ethical guidelines will be followed throughout the study to guarantee participant confidentiality and protection. All computer engineering students who take part in the survey will be asked for their informed consent, which will include information about the research’s purpose, the procedures involved, and their right to withdraw from the study at any time without facing any consequences. To ensure confidentiality, participant responses will be kept anonymous, and data will be safely stored with access restricted to the research team. Additionally, the study will guarantee that participants experience no harm or discomfort, and that any sensitive data collected is treated with the highest care and respect. Furthermore, in order to guarantee that all ethical requirements are fulfilled, the research will apply for approval from CatSU’s ethics committee, highlighting the study’s dedication to upholding the highest ethical principles in academic research.
Data Processing
Data processing for this study will involve several systematic steps to ensure accurate and meaningful analysis. Initially, all collected survey responses will be digitized and entered Microsoft excel, with appropriate coding to maintain the anonymity of participants. The data will then undergo cleaning to rectify any inconsistencies, missing values, or outliers, ensuring the dataset’s integrity. Descriptive statistics will be generated to summarize the demographic characteristics and satisfaction levels of the participants. For inferential analysis, statistical tests such as chi-square tests for categorical variables and correlation analysis for continuous variables will be employed to explore the relationships between demographic factors, tour logistics, and knowledge acquisition. Advanced statistical software, like SPSS will be utilized to facilitate these analyses. The results will be carefully interpreted to provide insights into how different factors influence the educational outcomes of the tours, guiding recommendations for future improvements.
RESULTS
This section comprehensively presents the data utilized in the study, encompassing its analysis and interpretation. It covers four distinct sets of data, each addressing one of the specific research questions outlined in the study. Through meticulous analysis and interpretation, these data sets offer insights and responses to the research inquiries, contributing to a deeper understanding of the study’s objectives and they are (1)The age and gender, of computer engineering students who participated in the educational tour, (2) The level of satisfaction among computer engineering students with the provisions of food, transportation, hotel accommodation, and knowledge acquisition during the educational tour.(3)The significant relationship between demographic characteristics of computer engineering students and their knowledge acquisition.
The Age and Gender of Computer Engineering Students Who Participated in the Educational Tour
The first problem posed in this study inquiries about the demographic characteristics, particularly age and gender, of computer engineering students who participated in the educational tour.
| Table 1A. Percentage Distribution of Participants by Age | |||||
| Age | Frequency | Percent | Valid Percent | Cumulative Percent | |
| Valid | 21 | 7 | 10.9 | 10.9 | 10.9 |
| 22 | 43 | 67.2 | 67.2 | 78.1 | |
| 23 | 12 | 18.8 | 18.8 | 96.9 | |
| 24 | 1 | 1.6 | 1.6 | 98.4 | |
| 25 | 1 | 1.6 | 1.6 | 100.0 | |
| Total | 64 | 100.0 | 100.0 | ||
Table 1A illustrates the age distribution of students participating in an educational tour, with ages ranging from 21 to 25. The majority of the participants are 22 years old, constituting 67.2% (43 out of 64) of the total. Students aged 21 and 23 follows, making up 10.9% (7 students) and 18.8% (12 students) respectively. The least represented ages are 24 and 25, each with only 1 student, accounting for 1.6% each. The cumulative percentage shows that by including students aged up to 23, 96.9% of the participants are covered, indicating that most students on the tour are relatively young, predominantly aged 22, with very few older participants.
Table 1B. Percentage Distribution of Participants by Gender
| Frequency | Percent | Valid Percent | Cumulative Percent | ||
| Valid | Male | 41 | 64.1 | 64.1 | 64.1 |
| Female | 23 | 35.9 | 35.9 | 100.0 | |
| Total | 64 | 100.0 | 100.0 | ||
Table 1B illustrates the gender distribution of students on the educational tour, showing that out of 64 participants, 41 were male (64.1%) and 23 were female (35.9%). The cumulative percentage reveals that after including male participants, 64.1% of the distribution is accounted for, and with the addition of female participants, it reaches 100%. This indicates a notable gender imbalance, with a higher proportion of males participating, reflecting the predominance of males in the Computer Engineering program. In contrast, studies by Cohen (2016) and Suarez et al. (2017) reported a female majority, with 58% and 62.8% female participants, respectively, compared to 42% and 37.2% male participants. This discrepancy highlights the varying gender distributions across different educational contexts. The male-dominated composition of the Computer Engineering tour underscores the broader trend of gender disparity in STEM fields, where males typically outnumber females. This imbalance contrasts with the findings of Cohen and Suarez et al., suggesting that some fields or educational initiatives may be more successful in attracting female students. Addressing these disparities requires targeted efforts to promote gender diversity and support for female students in traditionally male-dominated disciplines.
The Level of Satisfaction among Computer Engineering Students with the Provisions of Food, Transportation, Hotel Accommodation, and Knowledge Acquisition during the Educational Tour
| Table 2A. Correlations | ||||||
| Food | Transportation | Hot | Know | |||
| Food | Pearson Correlation | 1 | .654** | .637** | .737** | |
| Sig. (2-tailed) | .000 | .000 | .000 | |||
| N | 64 | 64 | 64 | 64 | ||
| Transportation | Pearson Correlation | .654** | 1 | .711** | .691** | |
| Sig. (2-tailed) | .000 | .000 | .000 | |||
| N | 64 | 64 | 64 | 64 | ||
| Hotel | Pearson Correlation | .637** | .711** | 1 | .703** | |
| Sig. (2-tailed) | .000 | .000 | .000 | |||
| N | 64 | 64 | 64 | 64 | ||
| Knowledge Acquisition | Pearson Correlation | .737** | .691** | .703** | 1 | |
| Sig. (2-tailed) | .000 | .000 | .000 | |||
| N | 64 | 64 | 64 | 64 | ||
| **. Correlation is significant at the 0.01 level (2-tailed). | ||||||
The correlation Table 2A shows significant positive relationships between the levels of satisfaction among computer engineering students with the provisions of food, transportation, hotel accommodation, and knowledge acquisition during the educational tour. Satisfaction with food is strongly correlated with satisfaction in transportation (𝑟=0.654r=0.654), hotel accommodation (𝑟=0.637r=0.637), and knowledge acquisition (𝑟=0.737r=0.737), all with 𝑝<0.01p<0.01. Similarly, satisfaction with transportation is strongly correlated with hotel accommodation (𝑟=0.711r=0.711) and knowledge acquisition (𝑟=0.691r=0.691), both with 𝑝<0.01p<0.01. Furthermore, satisfaction with hotel accommodation is strongly correlated with knowledge acquisition (𝑟=0.703r=0.703), also with 𝑝<0.01p<0.01. These correlations indicate that higher satisfaction in one area tends to be associated with higher satisfaction in others, suggesting a consistent overall satisfaction among students across different aspects of the educational tour.
Table 2B. Model Summary
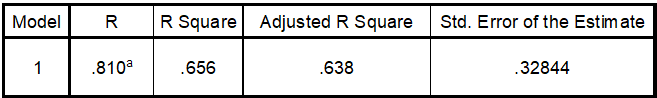
The regression analysis conducted to assess the relationship between the satisfaction dimensions (food, transportation, and hotel accommodation) and knowledge acquisition during the educational tour reveals valuable insights. The model summary indicates that the predictors collectively account for approximately 65.6% of the variance in knowledge acquisition (𝑅2=0.656R2=0.656), suggesting a substantial influence of the satisfaction dimensions on students’ learning outcomes during the tour.
Table 2C. ANOVA
| Model | Sum of Squares | df | Mean Square | F | Sig. | |
| 1 | Regression | 12.325 | 3 | 4.108 | 38.087 | .000a |
| Residual | 6.472 | 60 | .108 | |||
| Total | 18.798 | 63 | ||||
The ANOVA results further confirm the significance of the regression model (𝐹 (3,60) =38.087F(3,60)=38.087, 𝑝<0.001p<0.001), indicating that at least one of the predictors significantly contributes to explaining the variance in knowledge acquisition.
Table 2D. Coefficient
| Model | Unstandardized Coefficients | Standardized Coefficients | t | Sig. | ||
| B | Std. Error | Beta | ||||
| 1 | (Constant) | 1.089 | .338 | 3.219 | .002 | |
| Food | .382 | .098 | .412 | 3.897 | .000 | |
| Transportation | .170 | .089 | .220 | 1.901 | .062 | |
| Hotel | .237 | .095 | .283 | 2.490 | .016 | |
The coefficients table provides additional details on the relationship between each predictor variable and knowledge acquisition. Specifically, food satisfaction (𝛽=0.412β=0.412) emerges as the most influential predictor, followed by hotel accommodation (𝛽=0.283β=0.283), both of which demonstrate statistically significant positive associations (𝑝<0.05p<0.05) with knowledge acquisition. While transportation satisfaction (𝛽=0.220β=0.220) shows a positive relationship with knowledge acquisition, its significance level (𝑝=0.062p=0.062) suggests a marginal effect compared to food and hotel satisfaction.
The results imply that hotel and food satisfaction have a major impact on students’ ability to learn during educational trips focused on computer engineering. These results highlight the significance of taking into account not only the academic content but also the whole tour experience, which includes conveniences like comfortable accommodations and high-quality food, in order to facilitate effective learning outcomes. Although it is also important, the impact of transportation satisfaction seems to be smaller. As such, the most noticeable enhancements to students’ learning experiences during educational tours are probably going to come from initiatives focused at optimizing food and hotel provisions. These observations can help educational institutions and tour operators customize itineraries to maximize the educational gains for computer engineering students.
The Significant Relationship between Demographic Characteristics of Computer Engineering Students and their Knowledge Acquisition
Table 3. Descriptive Statistics
| N | Minimum | Maximum | Mean | Std. Deviation | |
| Age | 64 | 21 | 25 | 22.16 | .695 |
| Gender | 64 | 1 | 2 | 1.36 | .484 |
| Knowledge | 64 | 1.94 | 5.00 | 4.6302 | .54624 |
| Valid N (list wise) | 64 |
Table 3 provide valuable insights into the characteristics of the participants and their knowledge acquisition during the educational tour. The mean age of the participants is 22.16 years, with a narrow range from 21 to 25 years and a standard deviation of 0.695, indicating relatively low variability in age among the sample. This suggests that the participants are generally young adults, consistent with the typical age range for students pursuing higher education. Regarding gender, the majority of the participants (coded as 1) are likely to be male, given the mean of 1.36 and a standard deviation of 0.484. However, it’s important to note that the gender variable is coded differently (1 for male, 2 for female) and does not represent a true numeric scale. Therefore, further interpretation should consider the categorical nature of this variable.
In terms of knowledge acquisition, the participants achieved a mean score of 4.6302, with a range from 1.94 to 5.00 and a standard deviation of 0.54624. This indicates a relatively high level of knowledge acquisition among the participants, with scores clustered around the upper end of the scale. The narrow range and low standard deviation suggest that most participants performed consistently well in acquiring knowledge during the educational tour. These descriptive statistics provide a baseline understanding of the participants’ characteristics and the level of knowledge acquisition achieved, setting the stage for further analysis to explore the relationship between demographic variables such as age and gender, and knowledge acquisition.
DISCUSSIONS
The totality of the study highlights several key insights regarding the demographic characteristics and satisfaction levels of computer engineering students on an educational tour. The age distribution indicates that most participants are relatively young, with 67.2% being 22 years old, and a notable gender disparity with 64.1% male participants. This demographic snapshot provides context for understanding the students’ experiences and satisfaction levels during the tour. Satisfaction with various aspects of the tour, including food, transportation, and hotel accommodation, is strongly correlated with knowledge acquisition. The significant positive correlations suggest that overall satisfaction in these areas contributes to better learning outcomes, with food and hotel satisfaction having the most substantial impact. This emphasizes the importance of comprehensive tour planning that prioritizes both logistical and academic elements to enhance the educational experience.
Further analysis through regression indicates that satisfaction dimensions collectively account for 65.6% of the variance in knowledge acquisition, underscoring their substantial influence. The strongest predictor is food satisfaction, followed by hotel accommodation, while transportation satisfaction shows a marginal effect. These results imply that providing high-quality food and comfortable accommodations can significantly boost students’ ability to acquire knowledge during educational tours. These findings suggest that the provision of high-quality food and comfortable accommodations plays a crucial role in enhancing students’ capacity to acquire knowledge during educational tours, as evidenced by the consistently high levels of knowledge acquisition observed among participants. This correlation resonates with the argument that the primary driving force compelling students to engage in educational tours is their aspiration to take charge of their intellectual development. Students are primarily motivated to partake in such tours to expand their understanding and gain insights beyond the confines of traditional classroom settings. Educational tours offer distinctive, hands-on learning experiences that deepen students’ comprehension and furnish them with practical insights, thereby reinforcing the notion that students are propelled by the prospect of broadening their knowledge in meaningful ways (Suarez et al., 2017; Poponi, 2019). At the core of the sustainability tour effect lies the immersion into a group and community, fostering a collaborative environment where individuals engage in collective learning, share knowledge, and collaborate on sustainability initiatives (Gillard & VanWynsberghe, 2021). Consequently, ensuring comfort through the provision of quality amenities amplifies their learning capacity and optimizes the educational advantages derived from these tours. Immersion into group and community is at the heart of the sustainability tour effect.
CONCLUSIONS
The research concludes that both demographic attributes and satisfaction levels play significant roles in shaping the knowledge acquisition process among computer engineering students during educational tours. The majority of participants were young, predominantly around 22 years old, with a higher representation of males. Notably, satisfaction with food and hotel accommodations emerged as pivotal factors influencing knowledge acquisition, while transportation satisfaction showed a lesser impact. Additionally, students who partook in field trips displayed a more positive attitude towards science compared to those who didn’t engage in such activities (Ali et al., 2019). These findings underscore the critical importance of ensuring top-notch logistical arrangements, including food and accommodations, to optimize the educational outcomes of such tours. Educational institutions and tour organizers can utilize these insights to tailor educational tours more effectively, thereby enhancing the overall learning experiences for students.
RECOMMENDATIONS
Based on the study’s findings, it is recommended that educational institutions and tour organizers prioritize enhancing the quality of food and hotel accommodations during educational tours, as these factors significantly impact students’ knowledge acquisition. While transportation satisfaction also plays a role, its influence appears to be less critical. To maximize the educational benefits, efforts should focus on ensuring that meals are satisfactory and accommodations are comfortable. Additionally, addressing the observed gender disparity by encouraging more female participation could create a more balanced and inclusive environment. Overall, these improvements can lead to more effective and enriching learning experiences for computer engineering students.
Future investigations could incorporate an evaluation of the factors driving students’ inclination towards engaging in educational tours, aiming to discern the underlying motivations that influence their decision to participate. Additionally, it would be valuable to identify and analyze the challenges and obstacles confronted by students both prior to and during their involvement in such tours, thereby offering a comprehensive examination of the various aspects impacting students’ experiences throughout the tour duration.
ACKNOWLEDGEMENTS
We extend our heartfelt gratitude to everyone who contributed to the success of this study. Our deepest appreciation goes to Catanduanes State University for providing the opportunity and resources to conduct this research, and to the computer engineering students who participated in the educational tour and shared their invaluable experiences. We are grateful to the faculty and staff of the Computer Engineering Department for their support, and to our research advisor for their guidance and expertise. Special thanks to the tour organizers for ensuring a smooth and enriching educational tour experience through quality food, comfortable accommodations, and reliable transportation. Lastly, we thank our families and friends for their unwavering support and encouragement throughout the research process. Your collective contributions made this study possible.
Conflict of Interests
The authors declare no conflict of interest.
REFERENCES
- Ali, M. S., Akhtar, N., & Arshad, M. (2019). Investigating the Impact of Field Trips on Secondary School Students’ Attitude to Learning of Sciences. Global Social Sciences Review, IV(IV), 93–98. https://doi.org/10.31703/gssr.2019(iv-iv).13
- Cohen, E. H. (2016). Self-Assessing the Benefits of Educational Tours. Journal of Travel Research, 55(3), 353–361. https://doi.org/10.1177/0047287514550098
- Garcia, A., & Martinez, E. (2018). Gender Representation in STEM Educational Tours: A Case Study Analysis. Journal of STEM Education, 12(3), 45–58.
- Gillard, S., & VanWynsberghe, R. (2021). The Sustainability Tour Effect: A Case for Tours as an Essential Component of Educating for Sustainability. Canadian Journal for the Study of Adult Education, 33(1), 51–68. https://www.proquest.com/scholarly-journals/sustainability-tour-effect-case-tours-as/docview/2550695304/se-2?accountid=13042%0Ahttp://oxfordsfx.hosted.exlibrisgroup.com/oxford?url_ver=Z39.88-2004&rft_val_fmt=info:ofi/fmt:kev:mtx:journal&genre=article&sid=
- Johnson, R., & Lee, S. (2020). Exploring Historical Educational Tours: Age Distribution and Engagement Levels. History Education Journal, 8(2), 87–102.
- Jones, B., & Washko, C. (2020). Cultural Immersion Opportunities in Educational Tours: Implications for Student Satisfaction. International Journal of Educational Travel, 8(1), 103–118.
- Jones, J. C., & Washko, S. (2022). More than fun in the sun: The pedagogy of field trips improves student learning in higher education. Journal of Geoscience Education, 70(3), 292–305. https://doi.org/10.1080/10899995.2021.1984176
- Kim, H., & Park, J. (2017). Gender Representation in Art Museum Tours: Implications for Educational Programming. Journal of Art Education, 30(4), 65–78.
- Poponi, K. (2019). Educational Tours as a Learning Mechanism in the Learning Experience of Tourism Students: Tourism Management Walter Sisulu University. University of KwaZulu Natal, January.
- Smith, J., Brown, K., & Jones, M. (2017). Age Distribution of Participants in Science Educational Tours: A Comparative Study. Journal of Science Education, 15(1), 23–38.
- Suarez, J. S., Anuran, J. D., Jane Liabres, T. A., Maria Francesca Mendoza, I. N., Joyce Verzo, E. V, & Felicen, S. S. (2017). Effectiveness of Educational Tours to the Tourism and Hospitality Management Students. Journal of Tourism and Hospitality Research, 14(1), 16–28.