
Assessment of Socio-economic Characteristics of Ruminant Livestock Producers in Ushongo Local Government Area of Benue State, Nigeria
- Fanafa, J. D.
- Unongo, E. A.
- Barnabas, T. M.
- 1814-1825
- Jul 12, 2024
- Socioeconomic
Assessment of Socio-economic Characteristics of Ruminant Livestock Producers in Ushongo Local Government Area of Benue State, Nigeria
Fanafa, J. D1, Unongo, E. A.*2, and Barnabas, T. M.3
1Department of Agricultural Extension and Communication, Joseph Sarwuan Tarka University, Makurdi Benue State, Nigeria
2Department of Agricultural Extension and Communication, Joseph Sarwuan Tarka University Makurdi, Benue State, Nigeria
3Department of Agricultural Extension and Rural Sociology, Faculty of Agriculture University of Abuja, Nigeria
*Correspondence Author
DOI: https://dx.doi.org/10.47772/IJRISS.2024.806137
Received: 10 August 2021; Revised: 03 June 2024; Accepted: 06 June 2024; Published: 12 July 2024
ABSTRACT
The study assessed the socio-economic and effects of livestock production on the livelihood of rural households in Ushongo Local Government area of Benue State, Nigeria. Does not tally with the title above. Multi-stage sampling procedure was used to sample respondents for the study, data was collected using structural questionnaire administered to the respondents. Data was collected from 120 respondents as the population for the study. It was evident from the study that the age category 31-40 years (37.50%) were more actively involved in ruminant production and majority (53.33%) were found to be males while majority (72.50%) were married. Most of the respondents (57.50%) were found to be farmers and majority (45.00%) attained secondary education with 60.83% of them with household size of 6-10 members. Majority (39.17%) have 11-20 ruminants, their membership of formal organization was found to be 75.83% while 99.17% of them produce goats, most of them (58.33%) had annual income of 0-100,000 naira and have low access to production technologies (51.67%). Majority (51.70%) farming experience of 6-10 years. The study concluded that some socio-economic characteristics have significant effects on ruminants’ production on the respondents in the study area (This was not measured). It was recommended that: government through extension agents educate ruminants farmers on modern production technologies; ruminant production farmers should be accessed formal credit in form of loans by government and commercial banks for effective production; ruminant production farmers should also pool their financial resource to enable them remain in production; and ruminant production farmers should engage in formal association to gain more knowledge based on the interaction with others.
Keywords: ruminants, technologies, production, livelihood, rural households.
INTRODUCTION
Livestock is an important and integral component of agriculture which is one of the pillars of the Nigerian economy and it is believed to have the largest livestock population in Africa.
Nigeria is endowed with natural resources in diverse agro-ecological zones suitable for livestock production (Ezenwaka and Abere, 2010). Livestock production plays an important role to small-holder farmers and the national economy of Nigeria in generating income to farmers, creating job opportunities, ensuring food security, providing services, contributing to assets acquisition, provide social, cultural values and improve households income for an improved general livelihood of producers (Boron et al., 2010; Begbulem et al., 2011; and Agutu et al., 2011).
Small ruminants are among the major economically important livestock in Nigeria, playing important roles in the livelihood of resource-poor farmers and are the integral part of their livelihood sources for sustenance (Aruwayo et al., 2015). Mixed crop and livestock production practices are common production systems in Nigeria across different agro-ecological zones which depends on indigenous breed of ruminant available. Ruminant livestock include; sheep, goat, cattle, horses &/and donkeys that have digestive system naturally endowed with digestive system capable to ferment feedstuff particularly, herbs and provide precursors for energy for the animals (Jackson 2008; and Balakrishnan, 2010; Harris, 2011; Aphunu, 2011; and Ajala and Adesehinwa, 2008).
PROBLEM STATEMENT
Despite the large number of ruminants animals and their contribution to the livelihood of the farmers and the national economy, their productivity is low in Nigeria due to numerous factors which include; poor breed; weak agricultural extension system for educating farmers on good breed and management techniques; poor veterinary attention to ruminants; inadequate finance for production; poor credit incentives; poor policy issues regarding livestock production. Others are market and institutional problems; seasonal availability of pasture in some regions; poor nutritive value of feed and the prevalence of different diseases and parasites.
The agro-ecological condition of Ushongo LGA in particular is highly suitable for ruminant production since the area is endowed with various species of vegetation dominated by mixture of perennial and woody plants, shrubs and grasses which constitute a favorable pasture ground for ruminant production. Though, knowledge gap exist empirically on the social-economics characteristics of ruminant production farmers as well as the effects of the ruminant production on the livelihood of households that engaged in ruminant production. In depth study into the afore-mentioned will immensely close the existing research gaps empirically.
OBJECTIVES OF THE STUDY
The broad objective of the study is to assess the socio-economic characteristics of the ruminant producers and the ruminant production activities on the livelihood of rural farmers in the study area. Specifically, the study was designed to:
1. describe the socio-economic characteristics of ruminant production farmers;
2. identify various ruminant production activities practices/d by ruminant farmers;
3. find out the major ruminants produced by the respondents in the study area.
Socio-economic and effects of livestock production on the livelihood of rural households are not captured for instance, Socio-economic factors that affect livestock production, and on livelihood. For instance:
1. Determine socio-economic factors that affect ruminant production in the study area,
2. Identify the effects of ruminant production activities on the livelihood of rural farmers in the study area.
METHODOLOGY
The study was carried out in Ushongo Local Government area of Benue State, Nigeria. The population for the study comprised ruminant production farmers in the study area. A multi stage sampling procedure, purposeful and simple random sampling techniques were used to sample population for the study. Structured questionnaire were used for data collection from the respondents. During the first stage, Ushongo LGA was purposefully selected due to availability of ruminant production farmers in the area. In the second stage, six council wards namely; Mbakuha; Mbayegh; Mbagwaza; Mbaivende; Mbagba; and Mbaaka were randomly selected using simple random sampling technique.
During the third stage, six communities, one from each of the 6 council wards were selected randomly using simple random sampling technique giving a total of six communities. In the fourth stage, one household was selected from each of the six communities randomly using simple random sampling technique to get a total of six households for the study. Finally, a proportional allocation of 10% was used to draw a sample of 120 respondents from the population from the six households in the six communities from the six council wards as the eligible respondents for the study. Descriptive statistics such as frequency percentage, mean, were used to analyze the objectives.
Table 1: Population Sampling Procedure Summary
| Council Wards | Communities | Households | Population | Sample |
| Mbakuha | Mbaade | Tyongi | 200 | 20 |
| Mbayegh | Mbakyurav | Adugh | 290 | 29 |
| Mbagwaza | Mbatiev | Tyozenda | 230 | 23 |
| Mbaivende | Mbaikyobo | Kusange | 110 | 11 |
| Mbagba | Mbaswa | Tyohemba | 160 | 16 |
| Mbaaka | Mbatiam | Tarbunde | 210 | 21 |
| Total | 6 | 6 | 1200 | 120 |
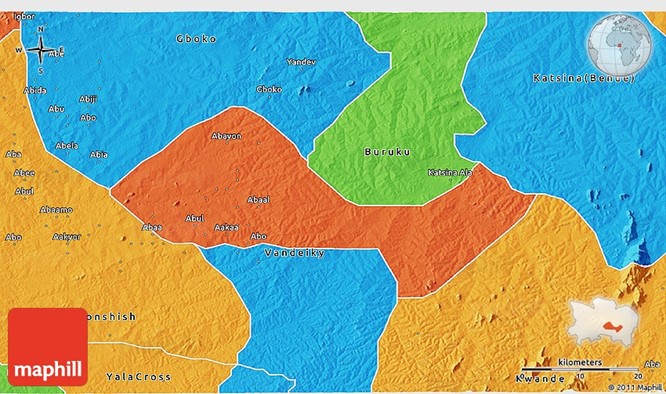
Fig 1, Map of Ushongo Local Government Area of Benue State, Nigeria which is the study area.
The Study Area
Sampling Techniques
Analytical Techniques should be discussed separately.
Appropriate statistical tools should be used to measure the objectives.
Socio-economic and effects of livestock production on the livelihood of rural households are not captured for instance, Socio-economic factors that affect livestock production, and on livelihood. For instance,
1. describe the socio-economic characteristics of ruminant production farmers;
2. identify various ruminant production activities practices/d by ruminant farmers;
3. find out the major ruminants produced by the respondents in the study area.
4. Determine socio-economic factors that affect ruminant production in the study area,
5. Identify the effects of ruminant production activities on the livelihood of rural farmers in the study area.
Objectives: I-V Descriptive statistics,
Objective: IV Regression or Tobit analysis, and
Objective: V Principal Component Analysis.
RESULTS AND DISCUSSION
Socio-Economic Characteristics of the Respondents
Age
The results presented in Table 2 show the distribution of the respondents by their age. About 37.50% of the farmers were between 31-40 years of age, 22.50% were between 21-30 years, 20.83% were between 41-50 years, 7.50% were above 60 years and 5.0% were from 0-20 years respectively. This implies that the farmers were made up of relatively young people, young farmers tend to be stronger, more capable of making good production decisions and have more potential for greater productivity than old farmers. Hence, are likely to be more efficient in the use of production inputs than older farmers (Adeola, 2010). Age has a significant influence on the decision-making process of farmers with respect to risk aversion and adoption of improved agricultural technologies. Younger farmers adopt agricultural innovations more readily than old ones (Dasgupta and Maler, 2012). Budy et al. (2008) observed that in most developing countries, males have access to production resources and always take lead of production ahead of females.
Table 2: Distribution of respondents according to age
| Age of Respondent | Frequency | Percentage |
| 0-20 | 6 | 5 |
| 21-30 | 27 | 22.5 |
| 31-40 | 45 | 37.5 |
| 41-50 | 25 | 20.83 |
| 51-60 | 8 | 6.67 |
| Above 60 | 9 | 7.5 |
| Total | 120 | 100 |
Sex
The distribution of respondents according to sex is presented in Table 3. The table shows that 53.33% of the respondents were males and 46.67% of the respondents were females. It implies that male respondents are naturally endowed with the strength to embark on farming and are bread winners of the family. Budy et al. (2008) observed that in most developing countries, males have access to production resources and always take lead of production ahead of females.
Table 3: Distribution of respondents according to sex
| Sex of respondent | Frequency | Percentage |
| Female | 56 | 46.67 |
| Male | 64 | 53.33 |
| Total | 120 | 100.00 |
Occupation
Data in Table 4 shows that 57.50% were farmers, 32.50% of the respondents were traders, 9.17% of the respondents were civil servants and 0.83 % of the respondents were artisans. This implies that majority of the respondent in the study area are farmers, while some engaged in non-farm activities such as trading. Brockington (2008); Barbier (2008); and Falconer and Arnold (2010) similarly views that farming is the major occupation widely embraced by rural households particularly in the developing nations as a source of livelihood.
Table 4: Distribution of respondents according to occupation
| Occupation | Frequency | Percentage |
| Civil service | 11 | 9.17 |
| Farming | 69 | 57.50 |
| Trading | 39 | 32.50 |
| Artisans | 1 | 0.83 |
| Total | 120 | 100 |
Educational Level
The distribution of respondents by their educational level in Table 5 indicates that 45.0 % had had secondary education, 20.83% had primary education, 16.87% had no formal Education, 11.67% had tertiary education and 5.83% had adult education. It implies that majority of the respondents were educated to some extent. Literacy is believed to have a positive implication on efficient use of productive resources, adoption of farm innovation and income diversification. The level of education determines the level of opportunities available to improve livelihood strategies, enhance food security, and reduce the level of poverty. It affects the level of exposure to new ideas and managerial capacity in production and the perception of the household members on how to adopt and integrate innovations into the household’s survival strategies. This is also in agreement with the views of Manza (2014) who similarly opined that educational level of a farmer is important as it helps widened farmers’ scope of managerial capacity as well as expose him to new ideas and subsequent adoption better.
Table 5: Distribution of respondents according to level of education
| Level of Education | Frequency | Percentage |
| No formal education | 20 | 16.67 |
| Primary | 25 | 20.83 |
| Secondary | 54 | 45.00 |
| Tertiary | 14 | 11.67 |
| Adult education | 7 | 5.83 |
| Total | 120 | 100.00 |
Household Size
The results presented in Table 6 show the distribution of household size of farmers. About 60.83% of the respondents had 6-10 household size, 35.83 % of the respondents had household size that ranged from 11-15 persons, 1.67% of the respondents had household size that ranged from 0-5 persons, 0.83 % of the respondents had household size that ranged from 16-20 persons, 0.83 % of the respondents had household size were above 20 persons in their family. Size of the household may enhance labour availability that can be used for different agricultural activities (Bwalya, 2011). The significance of household size in agriculture hinges on the fact that the availability of labour for farm production, the total area cultivated for different crop enterprises, the amount of farm produce retained for domestic consumption and the marketable surplus are all determined by the size of the farm household. However, Food and Agricultural Organization (FAO) (2014) argued that large household size is associated with increased household consumption expenditure which reduces the money that could be used for production purposes.
Table 6: Distribution of respondents according to household size
| Household (person) | Frequency | Percentage |
| 0-5 | 2 | 1.67 |
| 6-10 | 73 | 60.83 |
| 11-15 | 43 | 35.83 |
| 16-20 | 1 | 0.83 |
| Above 20 | 1 | 0.83 |
| Total | 120 | 100 |
Number of animals
Data in Table 7 indicated that, 39.17% of the respondent had a number of animals range between 11-20, 33.33% of the respondent had a number of animals range between 21-30, 13.33% of the respondent had a number of animals range between 31-40, 10.0% of the respondent had a number of animals above 50, 3.33% of the respondent had a number of animals range between 0-10, 0.83% of the respondent had a number of animals range between 41-50. It is clear from the result in table 7 that the number of ruminants raised by majority of the respondent ranges from 11-20 animals. This implies that the income level of the farmers in the study area is not enough to sustain large herd, more so, majority of farmers in most rural areas give more attention to crops farming than livestock production. Godoy and Bawa (2011) stressed that in most rural areas, priority is always given to crops farming leading to near abandonment of livestock production.
Table 7: Distribution of respondents according to number of animals what?
| Number of Animals | Frequency | Percentage |
| 0-10 | 4 | 3.33 |
| 11-20 | 47 | 39.17 |
| 21-30 | 40 | 33.33 |
| 31-40 | 16 | 13.33 |
| 41-50 | 1 | 0.83 |
| Above 50 | 12 | 10 |
| Total | 120 | 100 |
Farming Experience
The result presented in Table 8 shows the distribution of farming experience of the household that are involved. Result revealed that 51.67% of the respondents were between 6-10 year, 25.83% of the respondents were 11-15 years, 12.50% of the respondents had above 15 years of experience and 10.0% of the respondents were between 0-5 years. This result implies that farmers in the study area have sufficient experience in farm production. Unongo (2006) stated that farming experience of a farmer determines his ability to make effective farm management decisions, not only adhering to agronomic practices but also with respect to input combination or resource allocation. Farming experience is expected to influence farm production efficiencies because of accumulation of skills.
Table 8: Distribution of respondents according to farming experience
| Farming Experience (years) | Frequency | Percentage |
| 0-5 | 12 | 10 |
| 06-10 | 62 | 51.67 |
| 11-15 | 31 | 25.83 |
| Above 15 | 15 | 12.5 |
| Total | 120 | 100 |
Marital Status
From the results in Table 9 revealed that 16.67% of the respondents were widow/widower, 7.50% of the respondents were married, 7.50 % were single and 3.33% of the respondents were divorce. This implies that there is the possibility of the farmers having sufficient labour to send to work on the farm. The implication of the results in Table 9 is that majority of the respondents are married with large families that warrant production of ruminant to compliment income from crops farms to improve their households living standards. Atongo (2013) stated that rural households usually engaged in off-farm income activities in order to compliment income from farm for improved standard of living.
Table 9: Distribution of respondents according to marital status
| Marital Status | Frequency | Percentage |
| Single | 9 | 7.50 |
| Married | 87 | 72.50 |
| Widow/Widower | 20 | 16.67 |
| Divorce | 4 | 3.33 |
| Total | 120 | 100.00 |
Household Farm Income
The distribution of respondents according to household farm income is presented in Table 10 The table shows that 58.33% of household had annual income in the class interval of 0-100,000, 29.17% of household had annual income in the class interval of 101,000-200,000, 11.67% of household had annual income in the class interval of 201,000-300,000, 0.83% of household had annual income in the class interval of 401,000-500,000. This implies that majority of the respondent (58.33%) earnings from ruminant produced per annum is not much. This is usually to support income from crops farm for improved livelihood. Baland (2004) and Atongo (2013) stressed those rural households engaged in so many sources of raising income to sustain themselves other then crops farming. This usually gives them the opportunity of falling on the safe side when crops harvest in a year fails.
Table 10: Distribution of respondents according to annual income
| Annual Income (Naira) | Frequency | Percentage |
| 0-100,000 | 70 | 58.33 |
| 101,000-200,000 | 35 | 29.17 |
| 201,000-300,000 | 14 | 11.67 |
| 401,000-500,000 | 1 | 0.83 |
| Total | 120 | 100.00 |
Membership of Organization
The results in Table 11 indicated 75.83% of respondents were members of formal organizations, while 24.17% did not belong to any organization. This implies that membership of cooperative organization provides means of interaction among farmers which can enhance innovation diffusion easily among them. According to Idiong et al., (2007), membership of cooperatives affords the farmers the opportunities of sharing information on modern farm practices. According to Bwalya (2011), membership of cooperatives can also enhance the accessibility of farmers to information on improved technologies and to credit facilities for the purchase of inputs and payment of hired labour as well as serve as a medium for exchange of ideas that can improve their farm activities.
Table 11. Distribution of respondents according to membership of organization
| Membership of Organization | Frequency | Percentage |
| Not a member | 29 | 24.17 |
| Member | 91 | 75.83 |
| Total | 120 | 100.00 |
Access to Modern Production Technologies
The results in table 12 reveal that 51.67% did not have access to modern production technologies while 48.33 % have access to modern production technologies. This implies that majority (51.67%) of the respondents who do not have access to modern production technologies produce at a low and unimproved level, thereby, affecting their ruminant production income level. Falconer and Arnold (2010) emphasized that poor access to production technologies derails the real intent of the farmers and limit them to a subsistence production level with low income.
Table 12: Distribution of respondents according to modern production technologies
| Access to Modern Production Technologies | Frequency | Percentage |
| No access | 62 | 51.67 |
| Access | 58 | 48.33 |
| Total | 120 | 100.00 |
Ruminants Produced
From the result obtained, majority of the respondents agreed that rearing of goat is the major ruminant produced in the study area, followed by sheep, cattle, horse and other ruminant animal. Rearing of donkey according the respondent has not been carried in the study area. This implies that, the type of ruminant produced were mostly goat, sheep and cattle. According to Ezenwaka and Abere, (2010) observed that majority of the rural farmers intentionally produce small ruminants such as goats from crops harvest in case of yield failure. He further stated that due to the fact that small ruminants are easy to rear, farmers prefer to engage in their production in face of low technological requirement.
Table 13: Distribution of respondents according to ruminant produced
| Ruminant produced | Yes | No | ||
| Frequency | Percentage | Frequency | Percentage | |
| Rearing of Goat | 109 | 90.83 | 11 | 9.17 |
| Rearing of Sheep | 74 | 61.67 | 46 | 38.33 |
| Rearing of Cattle | 36 | 30 | 84 | 70 |
| Rearing of Horse | 1 | 0.83 | 119 | 99.17 |
| Rearing of Donkey | 0 | 0 | 120 | 100 |
*Multiple response
Ruminant Activities Practiced
It is evident in Table 14 that the most respondents practiced ruminant productions. Activity is keeping of does which has the highest mean =3.85. Others are raising kids, raising whether fattening of ruminants and raising of buck with the mean of: 3.73, 3.52, 3.43 and 3.36 respectively. This implies that keeping of does is more profitable to the respondents in the study area. Cambell et al. (2010) and Dasgupta (2011) observed that ruminant production activities in a particular area are promoted and well embraced by farmers based on their profitability level.
Table 14: Distribution of respondents according to ruminant activities practiced
| Ruminant Activities Practiced | Little Extent | Some Extent | Great Extent | Very Great Extent | Total | Mean |
| Keeping of Does | – | 4 | 10 | 106 | 120 | 3.85 |
| Raising kids | – | 7 | 19 | 94 | 120 | 3.73 |
| Raising Wether | 1 | 5 | 45 | 69 | 120 | 3.52 |
| Fattening of Ruminant | 1 | 5 | 55 | 59 | 120 | 3.43 |
| Raising of Buck | 1 | 10 | 54 | 55 | 120 | 3.36 |
CONCLUSION AND RECOMMENDATION
The study concluded that socio-economic characteristics have great effects on ruminant production in the study area and the major ruminants produced were goats, sheep and cattle. It was recommended based on the study that: extension agents from government extension agencies and other institutions should adequately educate ruminant farmers on improved technologies and innovations capable of enhancing their production capacity; ruminant production farmers should be accessed credit in form of loans by government and commercial banks to promote their ruminant production; ruminant farmers should also pool their financial resources to enable them remain in ruminant production; and ruminant farmers should actively engage in formal associations to broaden their knowledge on ruminant production through interaction with other members.
REFERENCES
- Adeola, S. S. (2010). Economic of Insecticide Usage among Cowpea Farmers in Kaduna State, Nigeria. Unpublished M.Sc. Thesis, Department of Agricultural Economics and Rural Sociology, Ahmadu Bello University Zaria, Nigeria: 312.
- Ajala, M.K. and Adesehinwa, A.O.K. (2008). Analysis of pig marketing in ZangoKataf Local Government Area of Kaduna State, Nigeria. Tropicultura, 26:229-239.
- Aphunu, A.O. and Okojie, D.U. (2011). Small ruminant production constraints among farmers in Ika North-east Local Government Area of Delta State, Nigeria. Arch. Appl. Sci. Res. 3:370-376.
- Aruwayo, A., Tiri, G.D., Yahaya, M.A. and Akinyemi, M. (2015). An empirical analysis of ruminant production in Dutsinma Local Government Area Katsina State, Nigera. Int. J. Innov. Agric & Bio. Res., 3(2):34-40.
- Atongo, D. (2013). Assessment of the Socio-economic Impact of Off-farm Income Activities as a Livelihood Strategy among Farm Households in Katsina- Ala Local Government Area of Benue State, Nigeria. B. Agriculture project presented to the Department of Agricultural Economics and Extension, University of Agriculture, Makurdi, Nigeria: 79.
- Baland, J. M. and Francois, P. (2010). Commonas insurance and the welfare impact of privatization. Journal of Public Economics, 173:200-210.
- Barbier. E. (2008). Links between economics liberalization and rural resource degradation in the developing countries. Agricultural Economics, 23: 300-315.
- Brockington, D. (2008). Womens’ income and the livelihood strategies of dispossessed pastoralist near the Mkomazi Game Reserve, Tanzania. Human Ecology, 29 (3): 48-52.
- Budy, P. R.; Ida, A. P. R.; Wijayono, S. and Nina, S. L. (2008). Socio-economic conflicts in Idonesia’s mining industry. In: Richard, C. and A. Pandya (eds.). Exploiting Natural Resources: Growth, Instability and Conflict in the Middle East and Asia The Henry Stimson Centre, Washington DC: 33-46.
- Bwalya, M. S. (2011). Households’ Dependence on Forest Income in Selected Rural Communities in Zambia. United Nations Development Programme (UNDP) Addis Ababa, Ethiopia: 67-85.
- Balakrishnan, P. (2010). An education programme and establishment of a citizen scientist network to reduce killing of non-venomous snakes in Malappuram district, Kerala, India. Conserv. Evid., 17:9-15.
- Barona E, Ramankutty N, Hyman G, Coomes OT (2010) The role of pasture and soy- bean in deforestation of the Brazilian Amazon. Environ Res Lett 5:024002.
- Ebegbulem, V.N., Ibe, S.N., Ozung, P.O. and Ubua, J.A. (2011). Morphometric trait characteristics of west African dwarf goats in Abia State South East Nigeria. Contin. J. Agric. Sci., 5:1-6.
- Campbell, B., Jeffrey, S., Kozanayi, W. and Lukert, M. (2010). Household Livelihood in Semi-arid Regions: Options and Constraints. Jakarta, Indonesia, Centre for International Forestry Research (CIFOR): 120-143.
- Dasgupta, P. (2011). An Enquiring into Well-being and Destitution. London: Oxford University Press. 326.
- Dasgupta, P. and Maler, K. G. (2012). Poverty institutions and the environmental resources base. In: Berhman J., Srivassan,T.N. (eds.): Handbook of Development Economics. Elsevier, Amsterdan: 156.
- Ezenwaka, J. and Abere, S. A. (2010). Community Participation in Natural Resources Management in the Niger Delta, Nigeria. Case study of Bonny Island, Rivers State; being a paper presented at the International Conference on Sustainable Development, Ebiumi Banigo Auditorium, University of Port-Harcourt 9-12th February: 16-21.
- Falconer, J. and Arnold, J. M. E. (2010). Household Food Security and Forest: Analysis of Socio-economic Issues Rome: Food and Agricultural Organization (FAO): 205.
- Food and Agricultural Organization (FAO) (2014). Livelihood Approach. Retrieved from www. Fao.org/../page β–Livelihoods htmlon 24/04/2014.
- Godoy, R. and Bawa, K. S. (2011). The economics value and sustainable harvest of plants and animals from the Tropical Forest: Assumptions, Hypothesizes and Methods. Economic Botany, 47: 217 – 219.
- Harris E (2011). Project Definition is Critical for Success-5key Elements you ignore at your own peril. Practical Business Process and Performance Improvement Information for Today’s Business Operating Environment. Available at http://blog.ssqi.com/2011/08/12/project- definition-project-charters.
- Idiong, C. I., Onyenweaku, E.C., Domian, I. A. and Susan, B. O. (2007) A Stochastic Frontier Analysis of Technical Efficiency in Swamp and Upland Rice Production System in Cross River State Nigeria. Medwell Agricultural Journal. 2(2): 299 – 305.
- Jackson, M.G. (2008). Treating straw for animal feeding. Animal production and health. Technical Report, FAO, Rome, 5(3): 25-42.
- Manza, E. A. G. (2014). Impact of Promoting Sustainable Agriculture on Food Security, Farm Income and Rural Livelihoods in Southern Borno State, Nigeria. Ph. D Dissertation submitted in the Department of Agricultural Economics and Rural Sociology, Faculty of Agriculture, Ahmadu Bello University Zaria, Nigeria: 197.
- Ogutu, J.O., Owen-Smith, N., Piepho, H.P. and Said, M.Y. (2011). Continuing wildlife population declines and range contraction in the Mara region of Kenya during 1977–2009. Journal of Ecology and Natural Environment, 6(3): 13-26.
- Unongo, A. (2006). Evaluation of the Cooperative Extension Centre, University of Agriculture, Makurdi, Benue State, Nigeria. An M Sc thesis Submitted to the Department of Agricultural Extension, University of Nigeria, Nuskka: 73.