
Assessment of Solid Waste Management Practices in Higher Educational Institutions in Makurdi Metropolis Benue State, Nigeria
- Thomas Ekwo Onyilokwu
- Jonathan Ali Ogwuche
- Terwase Shabu
- Patricia Ali
- Monday Akpegi Onah
- 1848-1867
- Apr 14, 2024
- Education
Assessment of Solid Waste Management Practices in Higher Educational Institutions in Makurdi Metropolis Benue State, Nigeria
Thomas Ekwo Onyilokwu, Jonathan Ali Ogwuche, Terwase Shabu, Patricia Ali, and Monday Akpegi Onah
Department of Geography, Benue State University, Makurdi
DOI: https://dx.doi.org/10.47772/IJRISS.2024.803131
Received: 14 February 2024; Accepted: 07 March 2024; Published: 14 April 2024
ABSTRACT
This study examined solid waste management practices in higher educational institutions within the Makurdi Metropolis, Benue State, Nigeria. The study was conducted in three higher institutions, namely: Joseph Saawuan Tarkaa University, Makurdi; Benue State University, Makurdi; and Alfred Akawe Torkula Polytechnic, Makurdi. The study sampled 395 respondents covering all the solid waste generators (students, staff and school mini-market operators) using simple random and purposive sampling procedures. Descriptive statistical method such as frequency count, percentage, mean, standard deviation, skewness and kurtosis were employed in data analysis. The result revealed that the majority of respondents were male (69.9%), falling predominantly within the 18-40 age bracket (82.0%), and unmarried (70.7%). A substantial portion of respondents had educational backgrounds of NCE/ND or secondary school certificates (39.4% and 31.5% respectively), with 70.7% still actively pursuing their education and 71.0% earning less than or equal to N30,000.00 per month on average. Solid waste generating entities were identified, with school mini-markets (labour markets) being the primary contributors (37.7%), followed by offices/lecture halls (34.7%), students’ hostels (28.6%), and general school premises (26.8%). The dominant types of solid waste generated included organic waste such as food remnants (81.2%), papers (67.1%), and plastic waste (64.6%). The municipal waste management authority, BENSESA, was found to be directly responsible for managing 58.5% of the solid waste in the study area, while 20.07% and 17.1% indicated that solid waste was managed by contractors hired by the selected institutions and institutions’ waste management departments/units respectively. Regarding waste storage and collection facilities, 46.0% of respondents reported that their institutions lacked such facilities, and 61.0% mentioned waste being dumped at open temporary dumpsites. Waste collection and disposal services were also found to be lacking, with 35.1% indicating that their institutions did not have these services. The most prevalent methods of solid waste disposal were open dumping (75.3%) and burning (61.3%), indicating suboptimal waste management practices. Inadequate service coverage from BENSESA was identified as a major challenge with a mean score of 4.30. In conclusion, this study highlights the inadequate solid waste management practices in higher educational institutions in Makurdi Metropolis, resulting in uncollected and improperly disposed waste. This poses significant health and environmental risks to residents of these campuses. The study recommends several measures to address these issues, including the establishment and enforcement of waste segregation programmes, improving waste collection and disposal services, conducting awareness campaigns, enforcing waste management policies, and investing in waste disposal infrastructure.
Key Words: Solid Waste, Management, High Institutions, Campuses
INTRODUCTION
Solid waste management has continued to be an intractable environmental challenge in most urban centers in Nigeria. This is usually evident in the mountains of indiscriminately disposed heaps of uncovered solid wastes and illegal dumpsites along major roads and at street corners in cities and urban areas (Aladejebi, Adeyeye, and Olatunji, 2015). The problem of solid waste generation and poor waste management are further compounded by rapid urbanization and population growth, leading to generation of enormous quantities of solid waste which are often discarded by open dumping (Aladejebi, Adeyeye, and Olatunji, 2015; Abdel-shafy and Mansour, 2018; Almasi, Mohammadi, Azizi, Berizi, Shamsi, Shahbazi and Mosavi, 2019). According to Reyes (2020), urban areas generated 1.3 billion tons of solid waste per year, and is expected to rise to 2.2 billion tons by 2025 (Reyes, 2020; Rodzi, Nopiah and Basri, 2019). Other studies reported a footprint of 1.2 kilograms of solid waste per person per day (Gusti, 2016; Omar, Hossain and Parvin, 2019; Rodzi, Nopiah and Basri, 2019; Adenuga, Mpofu and Modise, 2020). As solid waste generation increase, the environmental risk caused by waste materials including human health risks and environmental degradation (Rugatiri, Abidin and Ismail, 2021) equally escalates.
Educational institutions are important sources of solid waste generation within urban or rural areas where they are located. Hence, solid waste generation and management are becoming a growing concern in most the higher educational institutions (Rugatiri, Abidin and Ismail 2021) including Nigeria. Increasing population of students and residents of these higher institutions’ communities has no doubt led to a corresponding increase in the quantity of waste generated with attendant burden of management. While studies such as Ishi, Tyavyar, Nomkpev (2022); Gajalakshmi and Manivannan (2020); Alhassan, Kwakwa and Owusu-Sekyere (2020) and host of others have focused on municipal solid waste management generated from sources such as commercial, industrial and households, little attention has been given to waste generated form institutions such as higher institutions of learning inspite of the enormous waste generated from this source and its health implications on students and the residents as well as the campus environment. Meanwhile, effective management of solid waste on campuses is crucial for maintaining a healthy physical environment conducive to teaching, learning, and research activities.
Makurdi as a local government area play host to a number of higher institutions with most of the locating within the metropolis. They include Benue State University, National Open University, Makurdi Campus, Joseph Saawuan Tarkaa University of Agriculture, Makurdi, Alfred Akawe Torkula Polytechnic Makurdi, Nigeria Army School of Military Engineering (NASME), University of Mkar Makurdi Study Centre among others. These higher educational institutions represent the most viable industries in Makurdi and indeed Benue State which suggests that they are likely to contribute substantially to waste generation and management burden wherever they are located. Within these campuses, various activities are conducted, encompassing not only academic pursuits but also other operations that facilitate the smooth functioning of academic activities. These supportive activities, which generate considerable waste, comprise commercial ventures such as the campus mini-market (Labour market), hawking, construction, and accommodation (hostels and staff residential quarters).
Like other areas within the metropolis, a casual survey of these campuses shows clear evidence of indiscriminate dumping of solid waste for days, weeks and even months which suggests that campuses of higher institutions face similar waste management challenges. Therefore, an understanding of the sources, composition/characteristics, quantity and the existing management practices is critical to designing policy and programme that would ensure loveable and sustainable environment in these higher educational institutions. Since such information is not available, this study is aimed at assessing solid waste management practices in higher educational institutions in Makurdi metropolis.
MATERIALS AND METHODS
Study Area
The study area is higher educational institutions located within Makurdi metropolis. Makurdi is the capital of Benue State and doubles as the Headquarters of Makurdi Local Government Area. The town is located at the bank of River Benue in the plain of Benue trough of middle belt region of Nigeria. The area is found between latitude 7o 43′ 50″ N and longitude 8o 32′ 10″ E. (Figure 1).
Figure 1: Makurdi LGA showing Study Locations
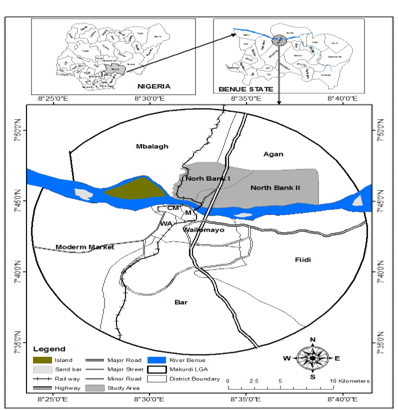
Cartography Studio, Department of Geography, Benue State University, Makurdi 2021
The higher educational institutions that studied were Benue State University, Makurdi; Joseph Saawuan Tarkaa University, Makurdi; and Alfred Torkula Polytechnic Makurdi. Benue State University is a state-owned university established in 1992. The University is located at Km 1, Gboko Road, Makurdi. Joseph Saawuan Tarkaa University, Makurdi was established in 1988, following the recommendations of a 1987 federal government White Paper on Higher Education curriculum and development in Nigeria. The University is located at North-Bank Makurdi. Alfred Torkula Polytechnic Makurdi has undergone enormous transformation since inception. It started as School of Basic Studies (SBS), then transformed to School of Remedial Studies and to College of Advanced and Professional Studies (CAPS) and its present status as a polytechnic. It is located at North-Bank Makurdi.
Though these institutions may have created their unique microclimate, it is however important to understand the general prevail climatic conditions over Makurdi where there are located. The area lies in the wet and dry savannah climate (Aw). Ayoade (2004) classified the area under the savannah rainfall region. This implies that the climate of Makurdi is basically the tropical wet and dry climate. The area experiences a mean temperature of 28oc while mean monthly temperature values indicate that the coolest and hottest months are December (260C) and March (310C) respectively (Tyubee, 2008). Its relative humidity fluctuates with seasons, reaching its means monthly peak of about 92% in the rainy season, which begins in April, reaches its peak in August and decreases to end in October. The dry season on the other hand last for five (5) months (November – March). Rainfall, which is dominantly originated from southwest monsoon and synoptic disturbances, has mean annual rainfall total of 1190mm and annual rainfall total ranging between 775mm and 1792mm. The highest monthly mean total of 262mm occurs in September. The vegetation of Makurdi is savannah type made of trees and grasses, however, urbanization has significantly changed the vegetation cover though natural vegetation can still be found at the out sketches of the town and few areas within the town. The study area is underlain by sedimentary rocks, which cover the whole of Benue trough, specifically; it is underlain by sandstone. The study area is situated entirely in the river Benue plain where the relief is generally low. However, the elevation of the city rises from 12m (234ft) at the river banks to 153m (500ft) northwards and southwards of the respective flanks. River Benue is the major drainage system in the region. It bisects the city into northern and southern banks. (Tyubee, 2008).
Besides educational function of these institutions, agriculture, fishing and commerce are the other prominent economic activities carried out within the campuses of these institutions. Subsistence farming is widely practiced together with market gardening mostly at the river bank adjoining these institutions. Crops such as rice, yam, cassava, maize, guinea corn and sweet potatoes are grown. Others include vegetable such as spinach, pumpkin, okro and garden egg.
METHODS
The study population comprise of school management, waste management contractors, students, staff, residents of the campuses and school mini-market operators in all the higher educational institutions of learning in Makurdi metropolis. The exact population of these entities could not be ascertained, however, the population of the three (Joseph Sarwuan Tarka University – 75,000; Benue State University – 34,999; and Alfred Torkula Polytechnic- 2000) higher institutions was estimated to be 111,999 persons (https://www.4icu.org/reviews/10732).
The 400 simple size was determined using Taro Yamane 1967 formula (Udofia, 2011). The study adopted multi-stage sampling procedure. At different stages of sampling, suitable sampling technique was used. The first stage involved that purposeful selection of higher educational institutions to include Joseph Sarwuan Tarka University, Makurdi; Benue State University, Makurdi; and Alfred Torkula Polytechnic, Makurdi. At the second stage, the 400-sample size was proportionately distributed among the three (3) selected institutions in the study area based on their estimated population. Stage three selected the identified waste generating entities such as households living on campus, students living in the hostels, staff and mini-market operators. They were selected using random and purposive method as deemed appropriate. Stage four: For the purpose of quantification of solid waste which entails separating and measuring all the components of waste generated, three (3) largest/major dumpsite in each of the campuses were identified where daily wastes dumped were collected, separated and weighed using weighting scale (Plate 2) for a period of five (5) days.
Structured questionnaire was used in generating information on the profile of the waste generating entities, and methods of waste management. While the physical inspection of the nature of the solid waste dump was carried out during field survey. Observation and photographs formed part of data collection tools for this study. In the same vein, freshly deposited solid wastes at the selected dumpsites were collected in polythene bags, sorted and measured using suspended weighing scale. Simple descriptive statistical methods were employed in data analysis. They include tables, percentages and graphs. The study also employed standard deviation and arithmetic mean to analyse data on daily quantity of solid wastes generated.
RESULTS AND DISCUSSIONS
Demographic and Socioeconomic Characteristics of Respondents
The result of demographic and socioeconomic characteristics of respondents is presented in Table 1.
Table 1: Demographic and Socioeconomic Characteristics of Respondents
| Entities/Variable | Frequency | Percentage | ||||||
| JSTU | BSU | ATP | Total | JSTU | BSU | ATP | Total | |
| Sex | ||||||||
| Male | 166 | 101 | 9 | 276 | 86.0 | 54.3 | 56.3 | 69.9 |
| Female | 27 | 85 | 7 | 119 | 14.0 | 45.7 | 43.7 | 30.1 |
| Age | ||||||||
| 18 – 40 | 167 | 144 | 13 | 324 | 86.4 | 77.3 | 84.2 | 82.0 |
| 41 – 63 | 26 | 42 | 2 | 70 | 13.6 | 22.7 | 10.5 | 17.8 |
| 64 – 86 | 0 | 0 | 1 | 1 | 0.0 | 0.0 | 5.3 | 0.2 |
| Marital Status | ||||||||
| Single | 123 | 144 | 13 | 279 | 63.6 | 77.3 | 78.9 | 70.7 |
| Married | 53 | 42 | 3 | 97 | 27.3 | 22.7 | 15.8 | 24.7 |
| Divorced/Separated | 18 | 0 | 1 | 18 | 9.1 | 0.0 | 5.3 | 4.7 |
| Education Level | ||||||||
| Non-Formal Education | 0 | 0 | 1 | 1 | 0.0 | 0.0 | 5.0 | 0.2 |
| FSLC | 35 | 0 | 1 | 36 | 18.2 | 0.0 | 5.0 | 9.1 |
| Secondary School Certificate | 26 | 85 | 14 | 124 | 13.6 | 45.5 | 85.0 | 31.5 |
| ND/NCE | 70 | 85 | 1 | 156 | 36.4 | 45.5 | 5.0 | 39.4 |
| Graduate/Postgraduate | 61 | 17 | 0 | 78 | 31.8 | 9.0 | 0.0 | 19.8 |
| Occupation | ||||||||
| Civil/Public Service | 25 | 20 | 2 | 47 | 13.0 | 11.0 | 12.0 | 12.0 |
| Farming | 6 | 13 | 1 | 20 | 3.0 | 7.0 | 5.0 | 5.0 |
| Fishing | 0 | 0 | 1 | 1 | 0.0 | 0.0 | 5.0 | 0.2 |
| Schooling | 137 | 132 | 11 | 280 | 71.0 | 71.2 | 68.0 | 70.9 |
| Artisanship/trading | 25 | 20 | 2 | 47 | 13.0 | 11.0 | 10.0 | 11.9 |
Source: Field Survey, 2023 N=395
JSTU = Joseph Sarwuan Tarka University, Makurdi (Federal University of Agriculture, Makurdi); BSU = Benue State University, Makurdi; ATP = Alfred Torkula Polytechnic, Makurdi
The result shows that male accounted the majority with 69.9% of the total respondents, while female accounted for only 30.1%. At the institutional level, male respondents were consistently the majority, accounting for 86.0%, 54.3% and 56.3% at Joseph Sarwuan Tarka University Makurdi, Benue State University Makurdi and Alfred Torkula Polytechnic, Makurdi respectively. The result of age distribution of respondents shows that 82.0% of the total respondents fall within 18-40 years age bracket, while 17.8% and 0.2% fall within 41-63% and 64-86 years respectively. The nature of age distribution in favour of youthful age group in the study area can be attributed to the fact that, the study locations are academic environment dominated by young persons within higher school age. At the various institutions, the result indicates that 18- 40 years age bracket consistently had the higher percentage with 86.4%, 77.3% and 84.2% at Joseph Sarwuan Tarka University, Makurdi; Benue State University, Makurdi; and Alfred Torkula Polytechnic, Makurdi respectively.
The result of marital status shows that 70.7% of the total respondents are single, while married and divorced/separated accounted for 24.7% and 47.0% respectively. At the various institutions, the result indicates that singles accounted 63.6%, 77.3% and 78.9% at Joseph Sarwuan Tarka University, Makurdi; Benue State University, Makurdi; and Alfred Torkula Polytechnic, Makurdi respectively. In a regular community, marital status can influence the quantity of solid waste in a higher institution setup because married individuals often generate more waste due to larger households and increased consumption. The composition of solid waste may also differ, with families typically producing more organic waste, such as food scraps, while single individuals may generate more non-organic waste, like packaging materials. However, in an academic environment such as the study area, this may not apply since majority of the sampled married persons do not reside on campus.
On the educational attainment, the result shows that only 9.1% had first school leaving certificate, while the majority of the total respondents (39.4% and 31.5%) had either NCE/ND or secondary school certificate. At the various institutions, the result indicates that 36.4% of the respondents at Joseph Sarwuan Tarka University, Makurdi had either NCE or ND, while 31.8% had either first degree or postgraduate degree. The result is slightly different at Benue State University, Makurdi, where 45.5% had secondary school certificate, with the same percentage (45.5%) obtaining NCE or ND. At Alfred Torkula Polytechnic, 85.0% had secondary school certificate, which suggests that majority of the respondents enrolled for their IJMBE or Diploma programme. Educational attainment can play a crucial role in shaping waste management practices in high institutions of learning. The relatively high educational attainment as found in this study can promote awareness, responsible behavior, innovation, and leadership, all of which can lead to more sustainable and environmentally friendly waste management systems from waste generation to final disposal. Moreover, educated individuals are more likely to be conscious of their waste-producing habits and may generate less waste overall.
The result of occupational distribution shows that schooling accounted for 70.7% of the total respondents which is the highest. This clearly suggests that majority of the respondents were students. This is followed by public/civil service and artisanship trading with 12.0% and 11.9% respectively. The result further shows that schooling accounted for 71.0%, 71.2% and 68.0% at Joseph Sarwuan Tarka University, Benue State University, Makurdi and Alfred Torkula Polytechnic, Makurdi respectively. Conversely, civil/public servants represent 13.0%, 11.0%, and 12.0%, while artisanship/trading accounted for 13.0%, 11.0% and 10.0% respectively. The occupation status of individuals in a high institution of learning can impact solid waste management in various ways, including waste generation patterns, segregation practices, education and awareness, and policy development. The major occupation in the study area is schooling, hence, they made be more interested in a study of this nature that will be valuable for environmental education and awareness creation on effective waste management strategies. Furthermore, students often have different consumption patterns and generate waste differently compared to staff and other residents.
Solid Waste Generating Entities on Campuses
This study identified the various solid waste generating entities on the campuses of the sampled higher institutions. The result is presented in Table 2
Table 2: Waste Generating Entities on Campuses
| Entities | Frequency | Percentage | ||||||
| JSTU | BSU | ATP | Total | JSTU | BSU | ATP | Total | |
| School Minimarket | 76 | 65 | 8 | 149 | 39.4 | 34.9 | 50.0 | 37.7 |
| Offices and Lecture Halls | 81 | 51 | 5 | 137 | 42.0 | 27.4 | 31.3 | 34.7 |
| Students’ Hostels | 44 | 61 | 8 | 113 | 22.8 | 32.8 | 50.0 | 28.6 |
| General School Premises | 45 | 57 | 4 | 106 | 23.3 | 30.6 | 25.0 | 26.8 |
| Vegetation Cover (leaves and grasses) | 24 | 49 | 2 | 75 | 12.2 | 26.6 | 13.6 | 19.0 |
| Others | 13 | 4 | 1 | 18 | 6.7 | 2.2 | 6.3 | 4.6 |
Source: Field Survey, 2023 N = 395 (Multiple Response)
JSTU = Joseph Sarwuan Tarka University, Makurdi (Federal University of Agriculture, Makurdi); BSU = Benue State University, Makurdi; ATP = Alfred Torkula Polytechnic, Makurdi
The result shows that school mini-market (labour market) accounted for 37.7% of the total respondents on solid waste generating entity in higher Institutions’ campuses in Makurdi metropolis. This suggests mini-markets were the leading solid waste generating entity in the study area and by extension accounted for higher quantity of solid wastes generated. The result further shows that offices and lecture halls, students’ hostels also generate solid wastes substantially, accounting for 34.7% and 28.6% of the total solid wastes generated. General school premises accounted for 26.8% of waste generated which are not directly connected to any specific activity or entity. The wastes here (general school premises) could result from hawking, indiscriminate damping of waste by students and visitors alike as well as leaves of trees and grasses. At the various higher institutional level, the result shows that school mini-markets and students’ hostels are the leading waste generating entity at Alfred Torkula Polytechnic with 50%, while Joseph Sarwuan Tarka University and Benue State University, Makurdi accounted for 39.4% and 34.9% respectively. The result however, shows that offices/lecture halls are the leading waste generating entity at Joseph Sarwuan Tarka University, accounting for 42.0%. Identifying the relative contribution of solid wastes generation burden from the generating entities on the campuses of higher institutions in the study area is very critical for planning and effective management strategies. At Benue State University, Makurdi, staff offices/lecture halls and other sources of wastes accounted for the least with 27.4% and 26·6%. while students’ hostels and general school premises accounted for the greater burden of waste generations with 32.8% and 30.6% respectively. This result however suggests that all the wastes generating entities can contributed significantly to waste burden on Benue State University campuses.
Types/categories of solid Wastes Generated
The study sampled the opinions of respondents on the dominant types of solid wastes generated on the campuses of higher institutions in Makurdi Metropolis. The result is presented in Table 3
Table 3: Types/Categories of Solid Wastes Generated
| Type | JSTU | BSU | ATP | Total | JSTU | BSU | ATP | Total |
| Frequency | Percentage | |||||||
| Organic Waste (food Remnant) | 130 | 178 | 13 | 321 | 67.2 | 95.5 | 84.2 | 81.2 |
| Plastic (Bottles, polythene bags, sachet water) | 105 | 145 | 14 | 265 | 54.5 | 78.2 | 89.5 | 67.1 |
| Papers | 79 | 167 | 9 | 255 | 40.9 | 89.8 | 57.9 | 64.6 |
| Metals | 9 | 84 | 3 | 96 | 4.5 | 45.2 | 21.8 | 24.4 |
| Glasses | 9 | 60 | 2 | 70 | 4.5 | 32.0 | 12.9 | 17.8 |
| Textile (clothing materials) | 18 | 169 | 8 | 194 | 9.1 | 90.9 | 47.4 | 49.2 |
| E-waste | 18 | 23 | 0 | 40 | 9.1 | 12.1 | 0 | 10.1 |
| Others | 24 | 45 | 3 | 72 | 12.5 | 24 | 21.8 | 18.3 |
Source: Field Survey, 2023 N = 395 (Multiple Response)
JSTU = Joseph Sarwuan Tarka University, Makurdi (Federal University of Agriculture, Makurdi); BSU = Benue State University, Makurdi; ATP = Alfred Torkula Polytechnic, Makurdi
Overall, the result shows that organic wastes such as food remnants accounted for 81.2%, thereby becoming the leading type of waste generated in the study area. This is followed by plastic such as bottles, polythene bags and sachet water bags and papers wastes. The plastic and paper wastes accounted for 64.6% and 67.1% respectively. Other categories, of solid waste of significant proportion are textile (49.2%) and metals (24.4%). The result also shows that e-waste and glasses are the least with 17.8% and 10.1%. This distribution the types of solid waste generated may be connected to the dominant activities and consumption patterns, within the campuses which may be different from an open normal urban communities or neigh bour hood.
Solid Wastes Categorization and Quantification
The result of solid wastes categorization and quantification is presented in Tables 4-7.
Table 4: Average Daily Solid Wastes Generation at Joseph Sarwuan Tarka University, Makurdi.
| Waste Category | Quantity (kg) | Percentage | ||||
| SP1 | SP2 | SP3 | Mean | Total | ||
| Food Remnant | 1.0 | 5.1 | 13.4 | 6.5 | 19.5 | 26.8 |
| Plastics (Sachet water bags etc) | 2.2 | 3.9 | 11.2 | 5.8 | 17.3 | 23.8 |
| Papers | 1.0 | 2.7 | 3.3 | 2.3 | 7.0 | 9.6 |
| Grasses and Leaves of trees | – | 4.1 | 6.4 | 3.5 | 10.5 | 14.4 |
| Others | 2.3 | 5.6 | 10.6 | 6.2 | 18.5 | 25.4 |
| Total | 6.5 | 21.4 | 44.9 | 24.3 | 72.8 | 100.0 |
Source: Field work, 2023
SP = Sample Point
SP1 = Block B, Girls Hotel South Core; SP2 = Beside School Mini-market South Core;
SP3 = Behind Girls Hostel, North Core
Daily quantity of Solid wastes generated in the three sampled dumpsites in each of the selected high institution were collected, sorted into the various identifiable categories or components and measured for five days. At Joseph Sarwuan Tarka University, the result indicates that 72.8kg weight of solid waste was generated daily. The result further shows that food remnants accounted for 26.8% of the total daily quantity of solid wastes generated in this institution, while plastics and other wastes categories accounted for 23.8% and 25.4% respectively. This result clearly suggests that foods and plastics wastes especially sachet water bags are the dominant solid wastes components at Joseph Sarwuan Tarka University. While the food wastes are biodegradable, the plastic components are non-biodegradable, hence, they require different methods of disposal, so as ensure environmental safety.
At Benue State University, the result shows that the total daily quantity solid wastes generated was 69.9kg. The result shows that vegetal waste (grasses, waste fruit/seeds and leaves of trees) accounted for 53.5% of the total daily quantity of solid wastes generated. The dominance of vegetal waste can be attributed to the quantity of fleshly deposited leaves, seeds and grasses during the week when the measurements were taken. The relatively lower percentage of food remnant can be attributed to the fact that the selected storage/dumpsites where were located closer to students’ hostels and staff offices and lecture halls than the school mini-markets. Plastic waste is equally high, accounting for second solid waste category with 17.0% of the total solid wastes generated in Benue State University (Table 5).
Table 5: Average Daily Solid Wastes Generation at Benue State University, Makurdi.
| Waste Category | Quantity (kg) | Percentage | ||||
| SP1 | SP2 | SP3 | Mean | Total | ||
| Food Remnant | – | 3.2 | 1.1 | 1.4 | 4.3 | 6.2 |
| Plastics (Sachet water bags etc) | 3.1 | 4.3 | 4.5 | 4.0 | 11.9 | 17.0 |
| Papers | 2.0 | 3.0 | 1.1 | 2.0 | 6.1 | 8.7 |
| Grasses and Leaves of trees | 19.1 | 13.2 | 5.1 | 12.5 | 37.4 | 53.5 |
| Others | 3.1 | 3.8 | 3.3 | 3.4 | 10.2 | 14.6 |
| Total | 27.3 | 27.5 | 15.1 | 23.3 | 69.9 | 100.0 |
Source: Field work, 2023 SP = Sample Point SP1 = Beside Girls Hostel (Technical Block);
SP2 = Front of Gabriel Suswam Girls Hostel; SP3 = Girls Hostels Eastern Wing Campus
At Alfred Torkula polytechnic, the result shows that the total quantity of solid wastes generated was 22.9kg by weight. Here, food wastes accounted for 26.2% of the total daily wastes generated while other categories of wastes that were not clearly identified accounted for 35.8%. Again, plastic wastes such as sachet water bags, polythene bags remain high in terms weight and area coverage with 24.5%. This is followed by vegetal waste (grasses and tree leaves) which accounted for 11.8% (Table 6).
Table 6: Average Daily Solid Wastes Generation at Alfred Torkula Polytechnic, Makurdi.
| Waste Category | Quantity (kg) | Percentage | ||||
| SP1 | SP2 | SP3 | Mean | Total | ||
| Food Remnant | 0.3 | 2.1 | 3.6 | 2.0 | 6.0 | 26.2 |
| Plastics (Sachet water bags etc) | 1.1 | 1.2 | 3.3 | 1.9 | 5.6 | 24.5 |
| Papers | 0.1 | – .0 | 0.3 | 0.1 | 0.4 | 1.7 |
| Grasses and Leaves of trees | – .0 | 1.3 | 1.4 | 0.9 | 2.7 | 11.8 |
| Others | 2.1 | 2.4 | 3.7 | 2.7 | 8.2 | 35.8 |
| Total | 3.6 | 7 | 12.3 | 7.6 | 22.9 | 100.0 |
Source: Field work, 2023 SP = Sample Point
SP1 = Beside Girls Hostel (Beside Clinic); SP2 = Mini-School Market (opposite School Campus) 1;
SP3 = Mini-School Market (opposite School Campus) 2
Based on the average daily solid waste generation estimates, the projected the mean and total solid wastes that can be generated in an academic session of 32 weeks. The result is presented in Table 7. The result indicates that a total of 37,094.4 kg of solid wastes can be generated by the three selected high institutions in Makurdi metropolis. Out of this total, JSTU, BSU and ATP accounted for 44.0%. 42.2% and 13.8% respectively, which reflects their estimated population size. In term of the composition, the result indicates that vegetal waste (grasses and leaves of trees including seeds) contributed more to solid wastes burden, accounting for 30.6%. This is followed by plastic wastes and food wastes with 21.0% and 18.0%. Other unidentified wastes accounted for 22.3% of the total wastes estimate for 32 Weeks or one academic session. The dominance of vegetal wastes may be connected with the abundance of trees and grasses in these institutions.
Table 7: Estimated Mean and Total Quantity (kg) of Solid Wastes Generation at Selected Higher Institutions in Makurdi for Academic Session of 32 Weeks
| Waste Category | JSTU | BSU | ATP | Grand Total | Percentage | |||
| Mean | Total | Mean | Total | Mean | Total | |||
| Food Remnant | 1,456.0 | 4,368.0 | 313.6 | 963.2 | 448.0 | 1,344.0 | 6675.2 | 18.0 |
| Plastics (Sachet water bags etc) | 1,299.2 | 3,875.2 | 896.0 | 2,665.6 | 425.6 | 1,254.4 | 7795.2 | 21.0 |
| Papers | 515.2 | 1,568.0 | 448.0 | 1,366.4 | 22.4 | 89.6 | 3024 | 8.2 |
| Grasses and Leaves of trees | 784.0 | 2,352.0 | 2,800.0 | 8,377.6 | 201.6 | 604.8 | 11334.4 | 30.6 |
| Others | 1,388.8 | 4,144.0 | 761.6 | 2,284.8 | 604.8 | 1,836.8 | 8265.6 | 22.3 |
| Total | 5,443.2 | 16,307.2 | 5,219.2 | 15,657.6 | 1,702.4 | 5,129.6 | 37094.4 | 100.0 |
Source: Computed from Data in Tables 4.19, 4.20 and 4.21
JSTU = Joseph Sarwuan Tarka University, Makurdi (Federal University of Agriculture, Makurdi); BSU = Benue State University, Makurdi; ATP = Alfred Torkula Polytechnic, Makurdi
It is very important to note that, the categories of wastes and the quantity estimates based on the respondents’ opinions (Table 3) and the actually measurements showed high level of agreement which validates the rationale for the application of these two approaches. The respondents’ opinions were very useful and as they represented historical perspective of solid waste management in the study area.
The find of this present study is consistent with those of Chiemchaisri et al., (2007), Giacovelli et al., (2017), and He et al., (2016). They reported that paper wastes, which includes used notebooks, textbooks, printed lecture materials, and other paper-based materials constitutes a significant portion of the waste generated in educational institutions. Also, plastic wastes, which consists of items like water bottles, food containers, and packaging materials, disposable plastic cutlery and plates also contribute significantly to this category of waste. In the same, vein, food waste often generates from school mini-market include leftover food, food scraps, and expired products were found to be one of the major solid wastes’ components in educational institutions (He et al., 2016). Kumar et al., (2016) reports that organic waste, which includes garden waste, leaves, and other organic materials generated from landscaping and maintenance activities on campus are of significant proportion, as also found in this present study.
Furthermore, Jean-Marie, Zahui, Messou, Essi-Loes and Coulibaly (2022) examines the management practice of solid waste in Nangui Abrogoua University and reports that three types of solid waste are produced in the institution: ordinary waste, which included paper, cardboard packaging, leftover food, hazardous waste (e.g. Chemical products, cotton soaked in blood, syringes) and inert waste (e.g. Soil cuttings, remains of gravel, concrete). Wastes generated in UNA are dominated by the recoverable fraction paper (20.92%), plastics (19.65%), cardboard (11.8%) glass (0.34%) and metals (1.69%)] and biodegradable fraction (26.04%). The current practice of waste management should be improved to ensure an adequate university environment. However, the composition of the waste offers good prospects for recovery and recycling. These findings are similar to those of the present study, which suggests that food and paper waste dominate solid waste categories in high educational institutions. They also report that about 2.5 tons (2,267.96kg) of solid waste is produced daily in the University, of which 1.5 tons (1360.78kg) come from offices and services, and one ton, from university canteens. However, green waste and waste from informal businesses are incinerated in illegal dumps within the university. This quantity of wastes generated here far exceed the combined quantity of solid wastes generated in the three selected institutions in this present study.
Solid Wastes management Department/Unit on Campus
The study also investigated the department or unit directly responsible for solid wastes management from collection, storage to disposal phases in the selected higher institutions Makurdi metropolis. The result is presented in Table 8. The result revealed that 58.5% of the respondents are of the view that municipal waste management authority, (Benue State Environmental Sanitation Agency – BENSESA) is directly responsible for the management of solid wastes in the Study area. This suggests that they are expected to provide solid wastes storage facilities on all the selected campuses and also carry out routine disposal at the approved dumpsite created by the same authority. The result further indicates that 20.07% of the respondents opined, that solid wastes are being managed by contractors, hired by the various institutions’ authorities, while 17.1% and 5.6% were of the opinion that solid wastes are managed by the institutions waste management departments/units and individual waste generators.
At the various institutional level, the result shows that 40.9% of wastes generated at Joseph Sarwuan Tarka University are being managed by wastes contractors, 27.3% by the municipal waste management authorities, while 22.7% is managed by the institutions’ waste management department/Unit. Conversely, 90.9% of the wastes generated in Benue State University, Makurdi are being managed by the municipal authority, while 11.9% is managed by individual generators who often either abandoned them at open dumps or burn them to further contaminate and the nearby water source, especially surface water sources such as streams and rivers. At Alfred Torkula Polytechnic, 57.9% of the respondents were of the opinion that solid wastes are managed by municipal authority, while 42.1% held that the institution manages the wastes they generate.
Interviews with the department/unit directly responsible for waste management in these institutions revealed that solid waste is principally managed by private waste companies hired by these institutions with the responsibility of providing sanitation/cleaning services. These companies are expected however, to work with municipal waste management authority that is expected to routinely evacuate these wastes for proper disposal. Sadly, these agreements are not strictly complied with by parties which explained mounting waste often found across campuses. The interview further revealed that waste contractors are now required to explore ways to safely dispose of the waste resulting from their campus cleaning and sanitation service without necessarily having to wait for the municipal authority. Consequently, opening of wastes and burying in a pit has become a common practice especially in Benue State University, Makurdi.
Table 8: Solid Waste Managing Department Unit on Campus
| Department/Unit | JSTU | BSU | ATP | Total | JSTU | BSU | ATP | Total |
| Frequency | Percentage | |||||||
| The institution’s wastes management department | 44 | 17 | 7 | 67 | 22.7 | 9.1 | 42.1 | 17.1 |
| Contractors | 79 | 0 | 0 | 79 | 40.9 | 0.0 | 0.0 | 20.0 |
| Municipal wastes management authority (BENSESA) | 53 | 169 | 9 | 231 | 27.3 | 90.9 | 57.9 | 58.5 |
| Individual waste generators | 0 | 22 | 0 | 22 | 0.0 | 11.9 | 0.0 | 5.6 |
Source: Field Survey, 2023 N = 395 (Multiple Response)
JSTU = Joseph Sarwuan Tarka University, Makurdi (Federal University of Agriculture, Makurdi); BSU = Benue State University, Makurdi; ATP = Alfred Torkula Polytechnic, Makurdi
Again, Jean-Marie, Zahui, Messou, Essi-Loes and Coulibaly (2022) reports that solid waste Nangui Abrogoua University, Abijan are managed by three actors: the Modern Infrastructure Company for Development in Côte d’Ivoire (MICDCI), private providers and the University Heritage Service. This structure is similar to the one found in this where wastes are being managed by multiple waste handlers with in effective BENSESA as the leading wastes handler in this present study. Consequently, indiscriminate dumping of solid wastes in and around these institutions is rampant.
Solid Wastes Storage and Collection Methods
The study investigated waste storage and collection phases of solid wastes management processes so as to understand the existing storage and collection practices. The result is presented in Table 9. The result revealed that 46.0% of the total respondents were of the opinion that the institution had no wastes storage and collection facilities, while 37.9% said solid wastes are collected and stored in plastic waste baskets. Physical field observation shows that these waste baskets are placed at strategic locations such as lecture and office buildings entrance, roads/paths and open space. Observations also shows that these plastic baskets are not suitable and sustainable due to harsh weather condition, especially high temperatures. More significantly, 61.0% revealed that waste dumped at open sites as seen in plates 1-5. This result suggests that indiscriminate dumping of waste in the campuses of higher institutions in the study area is a common practice. This has profound negative implications for human and environmental health. The residents are placed at high risks of offensive odour from these dumpsites, fire hazards and contracting diseases.
At the level of individual institution, the result indicates that 55.7% the respondents at Joseph Sarwuan Tarka University opined that solid wastes are dumped openly, which suggests the non-availability of open dumps as storage facilities in this institution (Plate 3 and 4). The result further shows that wastes are collected and stored in plastic wastes baskets (31.8%) and plastic bags/sacks (27.3%). At Benue State University, Makurdi, 88.9% revealed that the University had no big solid wastes storage facilities. Consequently, 66.7% opined that solid wastes generated in the University are stored and collected in open dumpsites within the university campus (Plate 1 or small waste basket (Plate 2). The situation is quite similar in Alfred Torkula Polytechnic where 59.4% of the respondents said wastes are stored at open dumpsites within and around the institutions campus, while 52.6%. and 21.1 %% are dumped and stored in small plastic bag/sacks and plastic waste baskets. The result provides clear evidence that higher institutions in Makurdi metropolis do not have modern solid wastes storage and collection facilities, hence wastes are collected/stored at open dumps until they are either disposed or left there permanently.
Table 9: Storage and collection
| Methods | JSTU | BSU | ATP | Total | JSTU | BSU | ATP | Total |
| Frequency | Percentage | |||||||
| No Storage big Facilities | 16 | 165 | 1 | 182 | 8.1 | 88.9 | 5.3 | 46.0 |
| Plastic bags/Sacks | 53 | 0 | 8 | 61 | 27.3 | 0.0 | 52.6 | 15.5 |
| Plastic Waste Basket | 61 | 85 | 3 | 150 | 31.8 | 45.6 | 21.1 | 37.9 |
| Metal waste Bins | 26 | 6 | 0 | 32 | 13.6 | 3.2 | 0.0 | 8.2 |
| Concrete bin | 0 | 8 | 1 | 9 | 0 | 4.2 | 5.3 | 2.2 |
| Roll-on roll-off containers | 10 | 5 | 0 | 0 | 5.2 | 2.6 | 0.0 | 0.0 |
| Open dumping | 108 | 124 | 10 | 241 | 55.7 | 66.7 | 59.4 | 61.0 |
| Others | 68 | 42 | 2 | 112 | 35.4 | 22.7 | 10.5 | 28.4 |
Source: Field Survey, 2023 N = 395 (Multiple Response)
JSTU = Joseph Sarwuan Tarka University, Makurdi (Federal University of Agriculture, Makurdi); BSU = Benue State University, Makurdi; ATP = Alfred Torkula Polytechnic, Makurdi
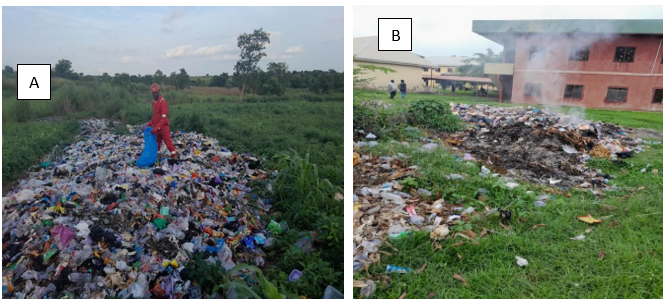
Plate 1: A= Open storage/dumping of solid Waste at JSTU, behind Girls’ hostel, North-core; B = Open storage/dumping of solid Waste at BSU,behind Girls’ hostel Eastern Wing Campus.
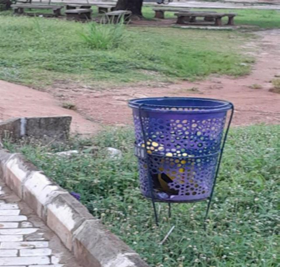
Plate 2: Small size waste storage plastic baskets at BSU, Makurdi, Front of 500-Seaters Lecture Hall, Faculty of Environmental Sciences.
Frequency of Solid Wastes Collection and Disposal
Solid wastes are expected to be collected and disposed of by the relevant waste management authorities/individuals at a regular interval in order to reduce the risks of water, foods and environmental contamination. The result of the frequency of collections and disposal by the wastes management authorities/individuals is presented in Table 10. Result revealed that 35.1% of the respondents opined that their institution does not have solid wastes collection and disposal services, and that wastes are disposed of directly at the dumpsites within and around the institution’s premises. This suggests that the storage sites are the same as the collection containers and vehicles and disposal sites, which are indiscriminately scattered in and around the campuses, thereby constituting health risks and hazards to the residents and the environment (Plate 3).
At the individual institutional level, the result shows that 59.10% respondents at Joseph Sarwuan Tarka University, Makurdi were of the opinion that the University had no organized collection service, thereby making periodic solid wastes collection for disposal a huge challenge In the same vein, 50.0% of respondents at Benue State University revealed that wastes collection is done at once a while, while 26.40% revealed that wastes are collected for disposal monthly. The varying opinion on the frequency of waste collection for disposal is an indication of unorganized structure of waste management at the Benue State University, Makurdi. At Alfred Torkula Polytechnic, 63.4% of respondents revealed that solid wastes generated in the institution are collected for disposal weekly, while 36.6% were of the view that the institution had no organised wastes collection and disposal services that routinely collect wastes for proper disposal.
Table 10: Frequency of Solid Waste Collection
| Time | JSTU | BSU | ATP | Total | JSTU | BSU | ATP | Total |
| Frequency | Percentage | |||||||
| No collection Service (disposed directly at dumpsite) | 114 | 19 | 6 | 139 | 59.1 | 10.0 | 36.6 | 35.1 |
| Daily | 9 | 8 | 0 | 17 | 4.5 | 4.5 | 0.0 | 4.3 |
| Weekly | 53 | 17 | 10 | 80 | 27.3 | 9.1 | 63.4 | 20.2 |
| Monthly | 18 | 49 | 0 | 67 | 9.1 | 26.4 | 0.0 | 16.9 |
| Once in a while | 0 | 93 | 0 | 93 | 0.0 | 50.0 | 0.0 | 23.5 |
| Total | 193 | 186 | 16 | 395 | 100.0 | 100.0 | 100.0 | 100.0 |
Source: Field Survey, 2023
JSTU = Joseph Sarwuan Tarka University, Makurdi (Federal University of Agriculture, Makurdi); BSU = Benue State University, Makurdi; ATP = Alfred Torkula Polytechnic, Makurdi
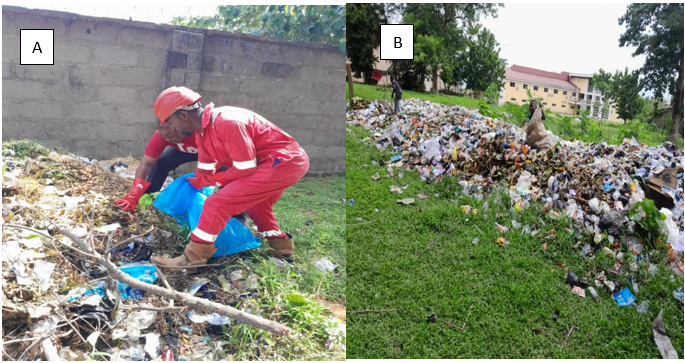
Plate 3: Indiscriminate Solid Waste dump at BSU, (A: Beside Technical Block Girls Hostel; B: Girls Hostel, Eastern Wing Campus)
Solid Wastes Sorting and Treatment before Disposal
Sorting of solid waste into different categories and treating them before the final disposal are critical processes in effective solid wastes management practices. The result of sorting and treatment of solid waste is presented in Table 11 and 12.
Table 11: Status of Solid waste Sorting before Disposal
| Variable | JSTU | BSU | ATP | Total | JSTU | BSU | ATP | Total |
| Frequency | Percentage | |||||||
| No | 167 | 186 | 15 | 368 | 86.4 | 100.0 | 94.7 | 93.1 |
| Yes | 26 | 0 | 1 | 27 | 13.6 | 0.0 | 5.3 | 6.9 |
| Total | 193 | 186 | 16 | 395 | 100.0 | 100.0 | 100.0 | 100.0 |
Source: Field Survey, 2023
JSTU = Joseph Sarwuan Tarka University, Makurdi (Federal University of Agriculture, Makurdi); BSU = Benue State University, Makurdi; ATP = Alfred Torkula Polytechnic, Makurdi
The results indicates that 94.75% of the respondents opined that solid wastes generated in their institutions are not sorted in to different categories before disposal. In the vein, 96.7% also revealed the wastes are not treated before disposal (Table 12). This is an indication that best practices in modern wastes management process is not followed on the study area. Sorting of wastes before disposal ensures that biodegradable wastes are not disposed alongside the non-biodegradable. Similarly, treatment of wastes reduces the risks of contamination, which in turn, reduces health risks and hazards by toxic wastes.
Table 12: Status of Solid waste Treatment before Disposal
| Variable | JSTU | BSU | ATP | Total | JSTU | BSU | ATP | Total |
| Frequency | Percentage | |||||||
| Yes | 149 | 180 | 16 | 345 | 77.3 | 96.7 | 100.0 | 87.4 |
| No | 44 | 6 | 0 | 50 | 22.7 | 3.3 | 0.0 | 12.6 |
| Total | 193 | 186 | 16 | 395 | 100.0 | 100.0 | 100.0 | 100.0 |
Source: Field Survey, 2023
JSTU = Joseph Sarwuan Tarka University, Makurdi (Federal University of Agriculture, Makurdi); BSU = Benue State University, Makurdi; ATP = Alfred Torkula Polytechnic, Makurdi
Methods of Wastes Disposal
The result of the current methods of wastes disposal in the study area is presented in Table 13.
Table 13: Methods of Solid Waste Disposal
| Methods | JSTU | BSU | ATP | Total | JSTU | BSU | ATP | Total |
| Frequency | Percentage | |||||||
| Open dumping | 114 | 169 | 14 | 297 | 59.1 | 90.9 | 89.5 | 75.3 |
| Open burning | 105 | 123 | 13 | 242 | 54.6 | 66.3 | 84.2 | 61.3 |
| Sanitary Landfill | 18 | 0 | 3 | 21 | 9.1 | 0.0 | 20.1 | 5.3 |
| Dumping into water bodies (River/stream) | 0 | 23 | 1 | 24 | 0.0 | 12.3 | 9.0 | 6.2 |
| Incineration | 16 | 4 | 0 | 19 | 8.1 | 2.0 | 0.0 | 4.9 |
| composting | 5 | 0 | 0 | 5 | 2.8 | 0 | 0 | 1.4 |
| Others | 64 | 40 | 2 | 106 | 33.1 | 21.6 | 11.8 | |
Source: Field Survey, 2023 N = 395 (Multiple Response)
JSTU = Joseph Sarwuan Tarka University, Makurdi (Federal University of Agriculture, Makurdi); BSU = Benue State University, Makurdi; ATP = Alfred Torkula Polytechnic, Makurdi
Overall, the result indicates that open dumping (75.3%) and burning of wastes (61-3%) were the leading methods of solid wastes disposal in the study area. Other methods are sanitary landfills (5.2%), dumping into water bodies (6.2%) and incineration (4.9%). Direct field observations revealed that wastes are dumped in open spaces within the institutions’ promises indiscriminately. There is no designated dumpsite where all the wastes collected are dumped.
At the various institutional level, the result shows that 59.1% of the respondents were of the view that open dumping is the major waste disposal method at Joseph Sarwuan Tarka University, Makurdi, while 54.67% were of the view that burning of wastes is also commonly practiced at the institution. Similarly, at Benue State University, 90.9% of the respondents revealed that wastes generated are dumped in open spaces scattered within the University campuses. Open burning (66.5%) at the dumpsites is also rampant. At Alfred Torkula Polytechnic, the result shows that 89.5% and 84.2% of the respondents indicated that wastes are either dumped openly or burned in open spaces within the and around the campuses.
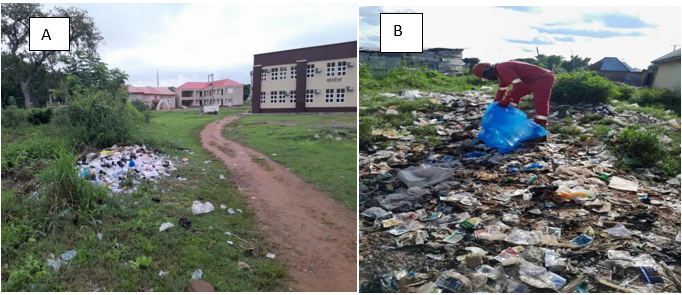
Plate 4: Open dumping disposal and BSU (A: Behind New Adminisrative Block) and ATP (B: Behind Mini-Market)
Challenges of Wastes Management in higher Institutions
Table 14 presents result of challenges encountered by higher institutions’ authorities in solid waste management. The result indicates that inadequate service coverage from municipal waste management authority (BENSESA) is one of the major waste management challenges with a mean score of 4.30 and Standard deviation of 0.865.
Table 14: Challenges Encountered in Solid Waste Management on Campuses
| Identified Challenges | N | Mean | Std. Deviation | Skewness | Kurtosis | ||
| Statistic | Statistic | Statistic | Statistic | Std. Error | Statistic | Std. Error | |
| Inadequate service coverage from BENSESA | 395 | 4.300 | .865 | -1.138 | .123 | 1.002 | .245 |
| No proper institutional structure/framework for waste management services | 395 | 3.808 | .9171 | -.899 | .123 | 1.096 | .245 |
| Lack of planning on solid waste management | 395 | 3.205 | 1.1292 | -.251 | .123 | -.374 | .245 |
| lack of waste reuse and recycling practice | 395 | 4.420 | .7873 | -1.554 | .123 | 2.788 | .245 |
| Inadequate financial resources to manage waste | 395 | 2.752 | 1.2234 | .391 | .123 | -.854 | .245 |
| Lack of waste collection and disposal equipment | 395 | 4.291 | 1.0392 | -1.274 | .123 | .619 | .245 |
| Rapid increase in the population of the institutions, thereby outstripping service capacity | 395 | 2.542 | 1.2071 | .789 | .123 | -.355 | .245 |
| Proliferation of waste storage/dumpsite within the campus | 395 | 4.137 | 1.1406 | -1.271 | .123 | .763 | .245 |
Source: Field Survey, 2023
The values of skewness and kurtosis are -1.138 and 1.003 respectively. The high mean score suggests that majority of the respondents rated inadequate service coverage very high as the challenge of wastes management especially, the storage, collection and disposal phases. The low value of standard deviations from the mean indicates high level of agreement among the respondents across the selected higher institutions in study. The result further shows that value of skewness is less than one (1) which indicates that the distribution of responses are negatively skewed. Similarly, the value Kurtosis is less than 3, hence the distribution is described as platykurtic, which suggests that the peakness of the distribution is flat compared to normal distribution. This further provides evidence of high of agreement that inadequate service coverage is a key challenges of waste management in the study area. Furthermore, the result shows that lack of solid waste reuse and recycling practice is another major challenge of solid wastes management with mean score, standard deviation, Skewness and Kurtosis of 4.420, 0.7873 -1.554 and 2.788.
Other Challenges of significant proportions identified are lack of collection and disposal equipment (4.291 mean score), lack of proper institutional structure/framework for waste management services (3.808) and lack of planning on solid waste management strategies. The fact that solid wastes within these three institutions are left unattended to for months validates the fact that these institutions are faced with the above identified challenges.
The results of this present study are consistent with a number of previous studies in this area. For instance. Adeniyi, Oladehinde, Oladipupo, Adesoye and Folorunso (2023) in their study on “Appraisal of solid waste generation in secondary schools towards sensitisation on environmental quality and education” reported that a total of 375.6 kg of solid waste is generated in the selected schools and daily per capita waste generation is 0.56 kg. Paper material is the waste component with the highest quantity and 88.5% of waste produced is recyclable. However, this study did not find evidence of waste recycling. Similarly, Betul, Fatma and Aydin (2022) reports that only 26% of solid waste generated at Marmara University Anadoluhisari campus in Turkey, are separated into different components before they are either recycled or disposed. Only 16% of participants were found to be very conscious about waste recycling. This suggests a better solid wastes management practices than the one reported in this study.
The finding of Saad and Mahmoud (2021) in their study on solid waste management practice in the university campus, are also consistent the findings of this present study. The author reported that the composition of MSW samples revealed that 80% of wastes were recyclable, 19% as compostable materials, while only 1% of the materials were a non-recyclable waste. More than 73% of the recyclable materials include paper and plastic warranting dire need of an effective solid waste management programme. The highest value of FPW was recorded for the breakfast meal. This suggests that waste recycling is not common at Imam Abdulrahman Bin Faisal University (IAU), Dammam – Saudi Arabia where their study was conducted.
Nkeleme, Nwabueze and Achigbu (2021) in their assessment of solid waste generation and management in Eziobodo Community, Imo State, Nigeria documented that residential buildings accounts for the highest generation source of solid wastes in the community and the solid wastes were predominantly nylon/nylon bags/nylon sachets; food waste, plastic can/rubbers arranged in their order of severity. This study is equally consistent with the findings of this present study, as plastic waste remains the dominant solid waste component.
Furthermore, Coker, Achi, Sridhar and Donnett (2016) study on solid waste management practices at a private institution of higher learning in Nigeria, found that 0.3 and 0.4 kg/capita/day was generated daily by the students in their respective halls of residence, with population ranging from 762 – 848 students in each of the halls. All the solid wastes generated were collected using appropriate waste collection bags and mobile bin positioned at strategic corners of the university premises. The waste materials after collection were segregated into plastics, bottles, nylon and organic materials by scavengers. These findings are similar to the findings of this present study, given the solid wastes are not properly managed by the university authorities, but collected and left at the mercies of scavengers.
CONCLUSION
Based on the findings, the study concludes that solid waste management practices in higher educational institutions in Makurdi metropolis fall below best waste management practices as evident in the uncollected and disposed waste. Also, the residents of campuses are exposed to high health risks and hazards from indiscriminately dumped solid waste in close proximity to offices/lecture halls and students’ hostels and school mini-markets.
The study recommends among other things that higher educational institutions should establish and enforce waste segregation programmes within their campuses. This includes separating recyclables from non-recyclables and hazardous waste from non-hazardous waste. Improve waste collection schedules and services within the campus to ensure timely removal of waste. Consider outsourcing waste management services to professional providers if necessary to guarantee efficient waste disposal.
REFERENCES
- Abdel-shafy, H. I. and Mansour, M. S. M. (2018). Solid waste Issues: Sources, composition, disposal, recycling, and valorization Egypt. J. Pet. 27 1275–90
- Adeniyi, L.A., Oladehinde, G.J., Oladipupo, A.S., Adesoye, P.O. and Folorunso, S.A. (2023), “Appraisal of solid waste generation in secondary schools towards sensitisation on environmental quality and education”, Management of Environmental Quality, Vol. ahead-of-print No. ahead-of-print. https://doi.org/10.1108/MEQ-07-2023-0211
- Adenuga, O. T., Mpofu, K. and Modise, K. R. (2020). An approach for enhancing optimal resource recovery from different classes of waste in South Africa: Selection of appropriate waste to energy technology. Sustain. Futur. 2 100033
- Aladejebi, O. J., Adeyeye, A. J. and Olatunji, E. O. (2015). Assessment of Solid Waste Management in IFE North Local Government Area, Osun State, Nigeria. International Journal of Scientific and Research Publications, 5(9), 1-8.
- Alhassan, H., Kwakwa, P.A., and Owusu-Sekyere, E. (2020). Households’ source separation behaviour and solid waste disposal options in Ghana’s Millennium City. Journal of Environmental Management. 2020; 259:110055
- Almasi, A., Mohammadi, M., Azizi, A., Berizi, Z., Shamsi, K., Shahbazi, A. and Mosavi, S. A. (2019). Assessing the knowledge, attitude and practice of the kermanshahi women towards reducing, recycling and reusing of municipal solid waste. Resour. Conserv. Recycl. 141 329–38
- Betul, H. G. H., Fatma, F. K., Aydin, A. (2022). Separate waste collection in higher education institutions with its technical and social aspects: A case study for a university campus. Journal of Cleaner Production, 367, 133022
- Chiemchaisri, C., Juanga, J.P., Visvanathan, C. (2007). Municipal solid waste management in Thailand and disposal emission inventory. Environmental Monitoring and Assessment, 135(1-3), 13-20.
- Coker, A. O., Achi, C. G., Sridhar, M. K. C., and Donnett, C.J. (2016). Solid Waste Management Practices at a Private institution of Higher Learning in Nigeria, Procedia Environmental Sciences, 35 (2016) 28 – 39.
- Gajalakshmi, R. and Manivannan, S.K. (2020). Solid Waste Management – A Case Study. The Mattingly Publishing Co., Inc. 83(March – April 2020), 9498 – 9504
- Giacovelli, L., Barletta, D., Raggi, A. (2017). Plastic waste generation in Italian schools: A first assessment to promote waste reduction strategies. Waste Management, 68, 216-223.
- He, P., Ma, L., Zheng, Z., Zhang, J., Cui, C., Yao, L. (2016). Source-separated collection and disposal of cafeteria food waste in Beijing, China: A life cycle assessment. Journal of Cleaner Production, 112(Part 3), 2333-2341.
- Ishi T, Tyavyar E.M, Nomkpev W.A. (2022). Determinants of household solid waste disposal practices in the residential neighbourhoods of a rapidly growing urban area in Nigeria. Environ Waste Management Recycling. 5(5):121
- Jean-Marie, P. O., Zahui, F. M., Messou, A., Essi Loes, L. M and Coulibaly, L (2022). Assessment of Solid Waste Management Practices in Public Universities in Developing Countries: Case of Nangui Abrogoua University (Abidjan, Côte d’Ivoire). International Journal of Waste Resources, 12(2), 1-9.
- Kumar, R., Malaviya, P., Kumar, S. (2016). A comparative analysis of biodegradable waste management in urban and rural areas of India. Waste Management, 48, 162-175.
- Nkeleme, E. I., Nwabueze, M. A., and Achigbu, O. I. (2021). Assessment of Solid Waste Generation and Management in Eziobodo Community, Imo State, Nigeria, Journal of Engineering Research and Reports, 20(1), 58-66.
- Reyes, M. J. T. (2020). Assessing Students’ Awareness, Attitude, and Practices on Solid Waste Management in a Philippine Catholic School philipine Soc. Sci. J. 3, 9–20
- Rugatiri, J., Abidin, Z. and Ismail, A. (2021). Assessing solid waste management strategy in higher education institutions of Indonesia: A case study of IPB University, IOP Conf. Series: Earth and Environmental Science 771 (2021) 012023
- Saad, D. and Mahmoud, F. El. (2021). Assessment of solid waste management practice in the university campus. International Journal of Sustainability in Higher Education, 22 (3), 561-575
- Tyubee, B. T. (2008). Urban Growth and Air Pollution in Makurdi, Nigeria. Association of
- Nigerian Geographers’ Proceedings of the National Conference on Urbanization, Resources Exploitation and Environmental Sustainability in Nigeria, Abuja, Nigeria, pp. 411-426.