
Comparison of Mitochondrial Genome Arrangement of Labeorohita with Some Selected Vertebrae Species.
- Khandakar Arshadul Bari
- Hawa Jahan
- Reza Md. Shahjahan
- Rowshan Ara Begum
- 467-485
- Apr 30, 2024
- Science & Technology
Comparison of Mitochondrial Genome Arrangement of Labeorohita with Some Selected Vertebrae Species.
1Khandakar Arshadul Bari, 2Hawa Jahan, 2Reza Md. Shahjahan,*2Rowshan Ara Begum
1Pirganj Govt. College, Thakurgaon
2University of Dhaka.
*Corresponding Author
DOI: https://dx.doi.org/10.47772/IJRISS.2024.804036
Received: 26 February 2024; Revised: 25 March 2024; Accepted: 30 March 2024; Published: 30 April 2024
ABSTRACT
The mitochondrial genome of Labeorohita serves as a microcosm for exploring genetic diversity and evolutionary relationships within vertebrates. Through comprehensive analysis of the mitochondrial genome, encompassing 37 genes including protein-coding genes (PCGs), transfer RNA (tRNA), and ribosomal RNA (rRNA), we elucidated its organization and compared it with other vertebrate taxa.
Our investigation revealed a compact mitochondrial genome of approximately 16 kb, comprising 13 PCGs, 22 tRNA genes, and 2 rRNA genes, with a distinctive dispersed loop region (D-loop). Notably, the arrangement of PCGs formed three distinct clusters, shared across Labeo species, suggesting evolutionary conservation within the genus. Comparative analyses with other osteichthyes species corroborated this conservation, underscoring L. rohita‘s representative status within the class.
Furthermore, comparisons with chondrichthyes, lungfish, amphibians, reptiles, birds, and mammals unveiled evolutionary trends in mitochondrial genome organization. Noteworthy findings include the unique replication origin in lungfish and amphibians, and transposition events in birds. Phylogenetic reconstructions based on mitochondrial gene sequences affirmed the close relationship between lungfish and amphibians, supporting lungfish as the closest relatives of class Amphibia.
In summary, our study provides comprehensive insights into the mitochondrial genome organization of L. rohita and its implications for vertebrate evolution. The findings contribute to a deeper understanding of genetic diversity and evolutionary relationships within vertebrates, with potential applications in taxonomy, conservation, and evolutionary biology.
Keywords: Labeorohita, mitochondrial genome, genetic diversity, evolutionary relationships, vertebrates, phylogenetic analysis, protein-coding genes, transfer RNA, ribosomal RNA, conservation.
INTRODUCTION
The genus Labeo contains 103 species, with four species found in Bangladesh (Rahman, 2005). Labeo species constitute an important group of fish with intense diversity and potential for commercial aquaculture in many Southeast Asian nations, including the Indian subcontinent.
There are only two types of DNA in animals: nuclear DNA and mitochondrial DNA (mtDNA).
Mitochondria are cellular organelles that have the function of oxidative phosphorylation and the formation of ATP. In humans, mtDNA is a double-stranded, circular, covalently closed molecule of 16.5 kb. MtDNA is inherited as a haploid from the mother, and heteroplasmy has been rarely found. From a population perspective, it could be considered as a system of small, sexually isolated demes or clonal lineages, with an evolutionary rate 5 to 10 times faster than the nuclear genome (José A. Castro, Antònia Picornell, &Misericòrdia Ramon, 1998).
Complete mitochondrial DNA analysis has proven useful in clarifying relationships among closely related species (Mayer, 1993). The 16S, 12S, Co1, and Cytb genes of the mitochondrial genome have been used as useful molecular markers for species-specific identification (Sperling & March, 1994; Girish et al., 2005).
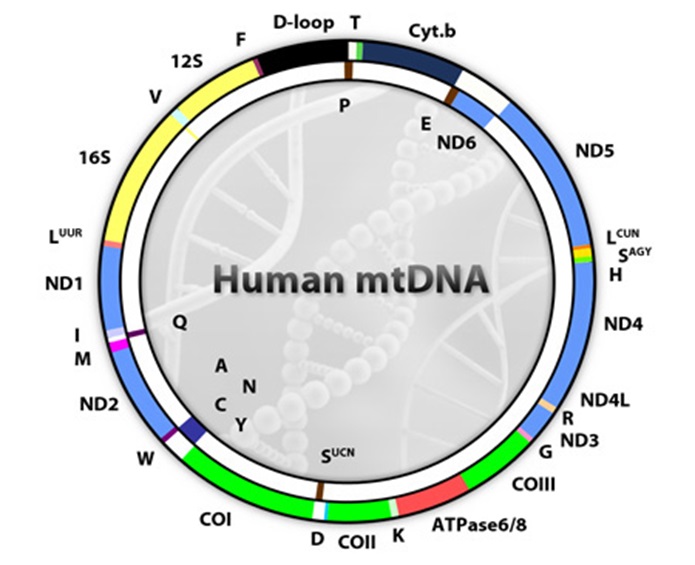
Figure 1: Animal mitochondrial DNA showing position of all the genes. Figure collected from Wikipedia (Mitochondrial DNA; http://commons.wikimedia.org).
The animal mitochondrial DNA (mtDNA) is a closed circular molecule (see Figure 1). Only the cnidarian classes Cubozoa, Scyphozoa, and Hydrozoa have been found to have linear mtDNA chromosomes (Bridge et al., 1992). In general, the vertebrate mt genome is highly compact, around 16 kb in length, and contains only 37 genes: 13 protein-coding genes, two ribosomal RNA genes (rRNAs), and 22 transfer RNA genes (tRNAs), along with one long noncoding region known as the control region containing the signals for regulation and initiation of mtDNA replication and transcription (e.g., Wolstenholme, 1992). Mt gene arrangement tends to be conserved among vertebrates, with all 37 genes and the control region organized in relatively the same order from teleost fish to eutherian mammals (Boore, 1994a).
Complete mitochondrial DNA (mtDNA) sequences have been determined for 177 vertebrate species and 75 invertebrate species, with partial sequences for hundreds of others (Boore et al., 1999). All are circular DNA molecules containing 37 genes: 13 for proteins (COI-III, ND1-6, ND4L, Cytb, A6, A8); two for rRNAs (srRNA and lrRNA); and 22 for tRNAs (designated by the one-letter amino acid code, with the two S and two L tRNAs differentiated by the codons recognized [AGN/UCN and CUN/UUR, respectively]). The genes are arranged very compactly, with no introns and few intergenic nucleotides.
Studies on the genome rearrangement of Labeorohita and its comparison with other species have not been conducted yet. Genome arrangement of Labeorohita has not been compared with other chondrichthyes and osteichthyes species. Furthermore, lower vertebrate species have not been compared with genome arrangement with that of Labeorohita. Similarly, higher vertebrate species have not been compared with the genome arrangement of Labeorohita. Despite the extensive work on the complete mitochondrial genome or partial sequencing of mtDNA and identification of species based on 16S, CO1, and Cyt b genes, there has been no research on rearrangement. Therefore, I attempted to study this topic.
METHODOLOGY
Sample Collection and DNA Extraction:
- Specimens of Labeorohita and other vertebrate species were collected from diverse geographical locations.
- Genomic DNA was extracted from tissue samples using the CTAB method.
PCR Amplification and Sequencing:
- A short region of the mitochondrial genome, such as the 16S rRNA gene, was amplified using polymerase chain reaction (PCR) with species-specific primers.
- PCR products were purified and sequenced using Sanger sequencing technology.
Data Retrieval and Assembly:
- Mitochondrial DNA sequences of 17 species, namely L. rohita, L. bata, L. calbasu, Channa marulius, Sicamugilcascasia, Tenualosailisha, Heteropneustesfossilis, Macrognathus aculeatus, Mastacembelusarmatus, Neoceratodusforsteri, Chimaera monstrosa, Dasyatiszugei, Scoliodonlaticaudus, Bufo melanostictus, Gecko gekko, Acridotheres tristis, and Cavia porcellus, were collected from the GenBank Database (NCBI).
- The genes of the collected sequences were manually arranged according to their position in the collected sequence using Microsoft Office. To construct a phylogenetic tree from the nucleotide sequences of the 16S and COI genes of the 17 species mentioned above, different software programs were used, including Notepad, Serial Cloner, and SeaView.
- Sequences were assembled and annotated using bioinformatics tools to identify protein-coding genes, tRNA, rRNA, and the D-loop region.
Genome Arrangement Analysis:
- The arrangement of protein-coding genes, tRNA, rRNA, and the D-loop region in the mitochondrial genome of rohita was analyzed and compared with other vertebrate species.
- Manual arrangement was performed using software like Microsoft Office or specialized bioinformatics tools.
Phylogenetic Analysis:
- Nucleotide sequences of conserved mitochondrial genes (e.g., CoI, 16S rRNA, cytochrome b) from rohita and representative vertebrate species were aligned.
- Phylogenetic trees were constructed using maximum likelihood (ML), neighbor-joining (NJ), or maximum parsimony (MP) methods.
- Bootstrap analysis was conducted to assess the robustness of tree topologies.
Comparative Genomics:
- Comparative analyses were performed to identify conserved regions, gene clusters, and unique features in the mitochondrial genomes of different vertebrate taxa.
- Differences in gene arrangements, sequence lengths, and structural elements like replication origins were examined.
Data Interpretation and Conclusion:
- Results from genome arrangement analysis, phylogenetic reconstruction, and comparative genomics were interpreted to infer evolutionary relationships and genetic diversity.
- Conclusions regarding the representative nature of rohita mitochondrial genome, evolutionary trends, and relationships among vertebrates were drawn.
Validation and Review:
- Results were validated through rigorous statistical analyses and peer review processes.
- Feedback from experts in the field was incorporated to refine interpretations and ensure the robustness of conclusions.
RESULT & DISCUSSION
Comparison of mtDNA arrangement in different vertebrate
Figure 2: Schematic diagram of the mitochondrial genome of Labeorohita(AP 011201).Different color showing the position of 13 protein coding, 22 tRNA and 2 rRNA genes with D-loop region.
Mitochondrial Genome Arrangement:
From the NCBI, it was revealed that the complete mitochondrial genome of Labeorohita is 16 kb long. It consists of 37 genes with one dispersed loop region or D-loop region. Among them, 13 protein-coding genes, 22 tRNAs, and 2 rRNA genes are found.
1. Protein coding genes:
There are 13 protein-coding genes in the mitochondrial genome of Labeorohita, namely NADH1, NADH2, Cytochrome Oxidase I, Cytochrome Oxidase II, ATPase 8, ATPase 6, Cytochrome Oxidase III, NADH 3, NADH 4L, NADH 4, NADH 5, NADH 6, Cytochrome b, and the D-loop or control region. These 13 protein-coding genes are interrupted by 22 tRNAs except for three clusters, namely ATPase 6 – ATPase 8 – COIII, ND4L – ND4, ND5 – ND6. The arrangement of these three clusters of protein-coding genes is commonly observed in vertebrate mitochondrial genomes.
Comparing the mitochondrial genome of three Labeo species, namely Labeorohita, L. calbasu, and L. bata, it was observed that these three clusters of protein-coding genes are the same in all three species of Labeo. However, differences were observed only in gene length, which varied from 1 to 10 bp. From this observation, it was concluded that the genome arrangement of Labeorohita is a representative or typical genome arrangement for Labeo species in the case of protein-coding genes.
Typical Labeo species were compared with the genome arrangement of Tenualosailisha, Channa marulius, and Heteropneustesfossilis, and with Mastacembelusarmatus, Macrognathus aculeatus, and Sicamugilcascasia. The same result was found as before, that is, all three clusters are similar in these species. From those comparisons, it was eventually concluded that the mitochondrial genome arrangement of L. rohita can represent the class Osteichthyes for protein-coding genes. Thus, the arrangement of the mitochondrial genome of L. rohita can be described as the typical mitochondrial genome arrangement for class Osteichthyes.
| Labeorohita | Labeocalbasu | Labeo bata | Typical Labeosp |
| Phe, 69 | Phe, 69 | Phe, 69 | Phe, |
| 12S,954 | 12S, 954 | 12S,954 | 12S |
| Val,71 | Val, 71 | Val,71 | Val |
| 16S,1686 | 16S, 1689 | 16S,1686 | 16S |
| Leu,75 | Leu, 75 | Leu,75 | Leu |
| ND1,974 | ND1, 974 | ND1,974 | ND1 |
| Ile,71 | Ile, 71 | Ile,71 | Ile |
| Gln,70 | Gln, 70 | Gln,70 | Gln |
| Met,68 | Met, 68 | Met, 68 | Met |
| ND2,1044 | ND2, 1044 | ND2,1044 | ND2 |
| Trp,70 | Trp, 70 | Trp, 70 | Trp, |
| Ala,68 | Ala, 68 | Ala, 68 | Ala |
| Asn,72 | Asn, 72 | Asn, 72 | Asn |
| Cys,66 | Cys, 66 | Cys, 66 | Cys |
| Tyr,70 | Tyr, 70 | Tyr, 70 | Tyr |
| COI,1550 | COI, 1550 | COI,1550 | COI |
| Ser,70 | Ser, 70 | Ser, 70 | Ser |
| Asp,71 | Asp, 71 | Asp,71 | Asp |
| COII,680 | COII, 690 | COII,680 | COII |
| Lys,75 | Lys, 73 | Lys, 75 | Lys |
| ATP8,164 | ATP8, 164 | ATP8, 164 | ATP8 |
| ATP6, 682 | ATP6, 682 | ATP6, 682 | ATP6 |
| COIII, 784 | COIII, 785 | COIII, 784 | COIII |
| Gly,71 | Gly, 71 | Gly,71 | Gly |
| ND3, 348 | ND3, 348 | ND3, 348 | ND3 |
| Arg, 69 | Arg, 69 | Arg, 69 | Arg, |
| ND4L,296 | ND4L, 296 | ND4L, 296 | ND4L |
| ND4, 1380 | ND4, 1380 | ND4, 1380 | ND4 |
| His, 68 | His, 68 | His, 68 | His |
| Ser, 68 | Ser, 68 | Ser, 68 | Ser |
| Leu, 72 | Leu, 72 | Leu, 72 | Leu |
| ND5, 1823 | ND5, 1823 | ND5, 1823 | ND5 |
| ND6, 521 | ND6, 521 | ND6, 521 | ND6 |
| Glu, 68 | Glu, 68 | Glu, 68 | Glu |
| Cyt b, 1140 | Cyt b, 1140 | Cyt b, 1140 | Cyt b |
| Thr,71 | Thr, 71 | Thr,71 | Thr |
| Pro,69 | Pro, 69 | Pro, 69 | Pro |
| D-loop, 940 | D-loop, 937 | D-loop, 940 | D-loop |
Figure 3: Mitochondrial genome arrangement of three species of Labeo namely Labeorohita(AB 011201), L. calbasu (AP012143) and L. bata (AP011198). Number showing the total length of particular genes in the boxes. Protein-coding genes are represented bold. tRNA genes are represented as three letter code.
- When the typical mitochondrial genome arrangement of fish is compared with chondrichthyes such as Chimaera monstrosa, Dasyatiszugei, and Scoliodonlaticaudus (see Figure 6), it was found that the arrangement of protein-coding genes is the same with the three clusters. So, it can be concluded that in the case of protein-coding genes, the genome arrangement of L. rohita is typical for chondrichthyes.
- When the typical mitochondrial genome arrangement of fish is compared with the lungfish Neoceratodusforsteri (see Figure 6), it was found that the arrangement of protein-coding genes is the same, and the three clusters are also the same. So, it can be concluded that in the case of protein-coding genes, the genome arrangement of L. rohita is typical for Neoceratodusforsteri.
- When the typical mitochondrial genome arrangement of fish is compared with amphibian Bufo melanostictus (see Figure 7), it was revealed that the protein-coding genes are the same, but the positions are different, and the number of base pairs also varies from that of the fish mitochondrial genome. Additionally, it was observed that in fish, between the clusters ND4L-ND4 and ND5-ND6, there are three tRNAs present (tRNAH, tRNAS, tRNAL2), but in the case of Amphibia (Bufo), only tRNAH and tRNAS are present, and tRNAL2 is absent. So, it can be concluded that amphibians are distant from the fish mitochondrial genome.
- When the typical mitochondrial genome arrangement of fish is compared with reptiles (G. gekko), birds (A. tristis), and mammals (C. porcellus), it was revealed that the protein-coding genes are the same in all cases. Additionally, the three clusters ATPase 6 – ATPase 8 – COIII, ND4L – ND4, ND5 – ND6 are similar to that of reptiles and mammals genome arrangement, but in the case of birds, there is an ND5-Cyt b cluster present instead of the ND5 – ND6 cluster. This is due to the transposition of the ND6 and tRNAGlu gene.
- The typical mitochondrial genome arrangement of fish was also compared with Drosophila melanogaster, and it was revealed that tRNAH, tRNAT, and tRNAP were present between the ND5 and ND6 genes (see Figure 9). The same result was found in the sessile barnacle Tetraclita japonica (Rowshan et al., 2004). Therefore, it can be concluded that the mitochondrial genome arrangement between fish and invertebrates is significantly different when protein-coding genes are considered.
| Typical Labeosp | Tenualosa | Channa | Heteropneustes |
| Phe, | Phe, 69 | Phe, 70 | Phe, 69 |
| 12S | 12S, 953 | 12S, 944 | 12S, 954 |
| Val | Val, 71 | Val, 71 | Val, 71 |
| 16S | 16S, 1679 | 16S, 1685 | 16S, 1663 |
| Leu | Leu, 75 | Leu, 75 | Leu, 74 |
| ND1 | ND1, 974 | ND1, 974 | ND1, 974 |
| Ile | Ile, 71 | Ile, 69 | Ile, 71 |
| Gln | Gln, 70 | Gln, 70 | Gln,70 |
| Met | Met, 68 | Met, 69 | Met,69 |
| ND2 | ND2, 1049 | ND2, 1045 | ND2, 1044 |
| Trp, | Trp, 71 | Trp, 70 | Trp, 70 |
| Ala | Ala, 68 | Ala, 68 | Ala, 68 |
| Asn | Asn, 73 | Asn, 72 | Asn, 72 |
| Cys | Cys, 65 | Cys, 66 | Cys, 65 |
| Tyr | Tyr, 69 | Tyr, 69 | Tyr, 69 |
| COI | COI, 1550 | COI, 1550 | COI, 1550 |
| Ser | Ser, 70 | Ser, 70 | Ser,70 |
| Asp | Asp, 68 | Asp, 71 | Asp, 70 |
| COII | COII, 690 | COII, 690 | COII, 690 |
| Lys | Lys, 73 | Lys, 74 | Lys, 73 |
| ATP8 | ATP8, 167 | ATP8, 167 | ATP8, 167 |
| ATP6 | ATP6, 683 | ATP6, 682 | ATP6, 682 |
| COIII | COIII, 785 | COIII, 784 | COIII, 783 |
| Gly | Gly, 70 | Gly, 68 | Gly, 72 |
| ND3 | ND3, 350 | ND3, 348 | ND3, 348 |
| Arg, | Arg, 68 | Arg,69 | Arg, 68 |
| ND4L | ND4L, 296 | ND4L,296 | ND4L, 296 |
| ND4 | ND4, 1380 | ND4, 1380 | ND4, 1380 |
| His | His, 68 | His, 69 | His,69 |
| Ser | Ser, 66 | Ser, 69 | Ser, 66 |
| Leu | Leu, 70 | Leu, 72 | Leu, 72 |
| ND5 | ND5, 1847 | ND5, 1838 | ND5, 1826 |
| ND6 | ND6, 521 | ND6, 521 | ND6, 518 |
| Glu | Glu, 68 | Glu, 67 | Glu, 68 |
| Cyt b | Cyt b, 1140 | Cyt b, 1140 | Cyt b, 1137 |
| Thr | Thr, 71 | Thr,71 | Thr, 72 |
| Pro | Pro, 69 | Pro,69 | Pro, 69 |
| D-loop | D-loop, 1168 | D-loop, 911 | D-loop, 858 |
Figure 4: Compare the mitochondrial genome arrangement of Labeo with those of Tenualosailisha[Clupeiformes, (AP 011610)], Channa marulius [Channiformes(AB 968638)], Heteropneustesfossilis [Siluriformes (AP 012013)].
2. tRNA:
There are 22 tRNA genes observed in L. rohita, consistent with the observation of Wolfe (1993). The tRNA genes of L. rohita range in size from 66 to 76 bp, and they form 5 clusters, namely WANCY, IQM, SD, HSL2, and TP (see Figure 3).
- The arrangement of the 22 tRNA genes of three Labeo species, L. rohita, L. calbasu, and L. bata, was studied, and the aforementioned 5 clusters are the same in all three species. However, the lengths differ from each other by only 1-2 bp (see Figure 3). From this observation, we can conclude that the genome arrangement of Labeorohita is a representative or typical genome arrangement for Labeo species for tRNA genes.
- Subsequently, the typical Labeo species’ tRNA gene arrangement was compared with Tenualosailisha, Channa marulius, and Heteropneustesfossilis (see Figure 4), and with Mastacembelusarmatus, Macrognathus aculeatus, and Sicamugilcascasia (see Figure 5). The same result was found as before; all 5 clusters are similar in these species. From these comparisons, it was concluded that the mitochondrial genome arrangement of L. rohita can represent the class Osteichthyes for tRNA gene arrangement. Thus, the arrangement of the mitochondrial genome of L. rohita can be described as the typical mitochondrial genome arrangement for class Osteichthyes or the typical mitochondrial genome arrangement for fish.
| Typical Labeosp | Mastacembelus | Macrognathus | Sicamugil |
| Phe, | Phe, 69 | Phe, 69 | Phe, 69 |
| 12S | 12S, 948 | 12S, 944 | 12S, 950 |
| Val | Val, 71 | Val, 72 | Val, 70 |
| 16S | 16S, 1670 | 16S, 1669 | 16S, 1696 |
| Leu | Leu, 73 | Leu, 74 | Leu, 73 |
| ND1 | ND1, 971 | ND1, 971 | ND1, 974 |
| Ile | Ile, 70 | Ile, 70 | Ile, 69 |
| Gln | Gln, 70 | Gln, 70 | Gln, 70 |
| Met | Met, 68 | Met, 68 | Met, 69 |
| ND2 | ND2, 1045 | ND2, 1045 | ND2, 1044 |
| Trp, | Trp, 71 | Trp, 71 | Trp, 71 |
| Ala | Ala, 68 | Ala, 68 | Ala, 68 |
| Asn | Asn, 72 | Asn, 72 | Asn, 72 |
| Cys | Cys, 66 | Cys, 66 | Cys, 65 |
| Tyr | Tyr, 66 | Tyr, 66 | Tyr, 67 |
| COI | COI, 1550 | COI, 1550 | COI, 1592 |
| Ser | Ser, 70 | Ser, 70 | Ser, 70 |
| Asp | Asp, 71 | Asp, 71 | Asp, 72 |
| COII | COII, 690 | COII, 690 | COII, 690 |
| Lys | Lys, 74 | Lys, 74 | Lys, 74 |
| ATP8 | ATP8, 167 | ATP8, 167 | ATP8, 167 |
| ATP6 | ATP6, 682 | ATP6, 683 | ATP6, 683 |
| COIII | COIII, 784 | COIII, 784 | COIII, 783 |
| Gly | Gly,70 | Gly, 69 | Gly, 72 |
| ND3 | ND3, 345 | ND3, 345 | ND3, 348 |
| Arg, | Arg, 68 | Arg, 69 | Arg, 68 |
| ND4L | ND4L, 297 | ND4L, 296 | ND4L, 296 |
| ND4 | ND4, 1380 | ND4, 1380 | ND4, 1380 |
| His | His, 64 | His, 69 | His, 68 |
| Ser | Ser, 66 | Ser, 66 | Ser, 67 |
| Leu | Leu, 72 | Leu, 72 | Leu, 72 |
| ND5 | ND5, 1832 | ND5, 1838 | ND5, 1841 |
| ND6 | ND6, 515 | ND6, 521 | ND6, 521 |
| Glu | Glu, 68 | Glu, 68 | Glu, 68 |
| Cyt b | Cyt b, 1137 | Cyt b, 1137 | Cyt b, 1134 |
| Thr | Thr, 71 | Thr, 71 | Thr, 76 |
| Pro | Pro, 69 | Pro, 69 | Pro, 69 |
| D-loop | D-loop, 871 | D-loop, 917 | D-loop, 1389 |
Figure 5: Compare the mitochondrial genome arrangement of Labeo with Mastacembelusarmatus [synbranchiformes (NC_023977)], Macrognathus aculeatus [synbranchiformes (NC_027435)], Sicamugilcascasia [mugiliformes (NC_017898)].
- When the typical mitochondrial genome arrangement of osteichthyes is compared with that of chondrichthyes such as Chimaera monstrosa, Dasyatiszugei, and Scoliodonlaticaudus (see Figure 27), it was found that the arrangement of tRNA was almost the same. However, a replication origin containing 37 base pairs was observed within the cluster WANCY, more specifically, between tRNAN and tRNAC. So, it can be concluded that in the case of tRNA genes, chondrichthyes differ from osteichthyes.
- When the typical mitochondrial genome arrangement of fish is compared with lungfish Neoceratodusforsteri (see Figure 6), it was found that the arrangement of tRNA is the same, but the difference is that in the cluster WANCY, there lies a replication origin of 35 base pairs. So, it can be concluded that in the case of tRNA, lungfish is slightly different from osteichthyes and resembles that of chondrichthyes.
- When the typical mitochondrial genome arrangement of fish is compared with amphibian Bufo melanostictus (see Figure 7), it was revealed that the tRNA clusters are different. In amphibians, the tRNA clusters are L1TPF, IQM, WANCY, SD, and HS. A replication origin of 10 base pairs is present between tRNAN and tRNAC. Lungfish also has a replication origin in the same clusters between tRNAN and tRNAC (see Figure 7). The position of the origin of replication is a unique identifying characteristic of lungfish, which is similar to that of amphibian mtDNA and dissimilar to that of other osteichthyesmtDNA.
- When the typical mitochondrial genome arrangement of fish is compared with reptiles (G. gekko), birds (A. tristis), and mammals (C. porcellus), it was revealed that the 5 clusters (WANCY, IQM, SD, HSL2, TP) are similar in all cases. However, the position of the TP cluster is different in the case of birds.
- By comparing the typical mitochondrial genome arrangement of osteichthyes with that of Drosophila melanogaster, it was revealed that the tRNA clusters of Drosophila are different. In Drosophila, the tRNA clusters ARNS1EP, IQP, WCY, KD, and TP were found (see Figure 9). The same result was found in the sessile barnacle Tetraclita japonica (Begum, R.A. et al., 2004). So, it can be concluded that the mitochondrial genome arrangement of osteichthyes, more commonly known as fish, and invertebrates are far different from each other whenever vertebrate and invertebrate mtDNA is compared.
| Typical Osteichthyes | Neoceratodus | Chimaera | Dasyatis | Scoliodon |
| Phe, | Phe, 68 | Phe, 70 | Phe, 71 | Phe, 70 |
| 12S | 12S, 951 | 12S, 948 | 12S, 963 | 12S, 951 |
| Val | Val, 70 | Val, 70 | Val,71 | Val, 71 |
| 16S | 16S, 1679 | 16S, 1664 | 16S, 1704 | 16S, 1669 |
| Leu | Leu, 74 | Leu, 74 | Leu, 74 | Leu, 74 |
| ND1 | ND1, 971 | ND1, 971 | ND1, 977 | ND1, 974 |
| Ile | Ile, 76 | Ile, 72 | Ile, 68 | Ile, 69 |
| Gln | Gln, 70 | Gln, 69 | Gln, 72 | Gln, 71 |
| Met | Met, 68 | Met, 68 | Met, 70 | Met, 68 |
| ND2 | ND2, 1043 | ND2, 1041 | ND2, 1046 | ND2, 1044 |
| Trp, | Trp, 71 | Trp, 68 | Trp, 69 | Trp, 70 |
| Ala | Ala, 68 | Ala, 68 | Ala, 68 | Ala, 68 |
| Asn | Asn, 72 | Asn, 72 | Asn, 72 | Asn, 72 |
| Cys | Rep org, 35 | Rep org, 52 | Rep org, 35 | Rep org, 37 |
| Tyr | Cys, 70 | Cys, 73 | Cys, 66 | Cys, 66 |
| COI | Tyr, 69 | Tyr, 67 | Tyr, 69 | Tyr, 68 |
| Ser | COI, 1556 | COI, 1559 | COI, 1556 | COI, 1556 |
| Asp | Ser, 70 | Ser, 71 | Ser, 71 | Ser, 70 |
| COII | Asp, 68 | Asp, 71 | Asp, 70 | Asp, 68 |
| Lys | COII, 712 | COII, 690 | COII, 69 0 | COII, 690 |
| ATP8 | Lys, 71 | Lys, 72 | Lys, 73 | Lys, 73 |
| ATP6 | ATP8, 167 | ATP8, 167 | ATP8, 167 | ATP8, 167 |
| COIII | ATP6, 683 | ATP6, 683 | ATP6, 683 | ATP6, 683 |
| Gly | COIII, 785 | COIII, 785 | COIII, 785 | COIII, 785 |
| ND3 | Gly, 70 | Gly, 68 | Gly, 70 | Gly, 69 |
| Arg, | ND3, 348 | ND3, 348 | ND3, 348 | ND3, 348 |
| ND4L | Arg, 69 | Arg, 69 | Arg, 68 | Arg, 69 |
| ND4 | ND4L, 296 | ND4L, 296 | ND4L, 296 | ND4L, 296 |
| His | ND4, 1380 | ND4, 1374 | ND4, 1380 | ND4, 1380 |
| Ser | His, 68 | His, 68 | His, 68 | His, 68 |
| Leu | Ser, 66 | Ser, 68 | Ser, 66 | Ser, 66 |
| ND5 | Leu, 68 | Leu, 71 | Leu, 71 | Leu, 71 |
| ND6 | ND5, 1829 | ND5, 1838 | ND5, 1844 | ND5, 1829 |
| Glu | ND6, 515 | ND6, 521 | ND6, 515 | ND6, 521 |
| Cyt b | Glu, 68 | Glu, 69 | Glu, 68 | Glu, 69 |
| Thr | Cyt b, 1143 | Cyt b, 1143 | Cyt b, 1142 | Cyt b, 1144 |
| Pro | Thr, 72 | Thr, 70 | Thr, 72 | Thr, 69 |
| D-loop | Pro, 69 | Misc_feature, | Pro, 69 | Pro, 68 |
| D-loop, 925 | 1533(CRI) | D-loop, 2522 | D-loop, 1062 | |
| Pro, 68 | ||||
| Misc_feature, | ||||
| 1434(CRI) |
Figure 6: Compare the mitochondrial genome arrangement of Labeo with other chondrichthyesnamely Neoceratodusforsteri (AJ 584642), Chimaera monstrosa (AJ 310140), DasyatisZugei (NC_019643), and ScoliodonLaticaudus(KP 336547).
3. rRNA:
Two ribosomal RNA genes were found in the LabeorohitamtDNA, one encoding the large subunit, 16S rRNA (1686 bp), and the other encoding the small subunit, 12S rRNA (954 bp). The tRNAV is present between the 12S rRNA and 16S rRNA genes (see Figure 24), representing a unique arrangement among vertebrate and invertebrate mitochondrial genomes (Begum, R.A. et al., 2004).
- Comparing L. rohita with the other two Labeo species, it was observed that the number of base pairs is almost similar, differing only by 1-3 bp (see Figure 3).
- Comparing with other osteichthyes, it was found that the number of base pairs differs by up to 22 bp (see Figure 4 & 5).
- Similar results were found when comparing with chondrichthyes and lungfish.
- When compared with amphibians, it was revealed that the number of base pairs differs by 82 bp (see Figure 7).
- When the typical mitochondrial genome arrangement of fish was compared with reptiles (G. gekko), birds (A. tristis), and mammals (C. porcellus), it was found that tRNAVal is present between the small rRNA (12S) and large rRNA (16S) like in other vertebrates and invertebrates. However, the number of base pairs differs by 3 to 25 bp.
- Comparing with Drosophila (invertebrate), it was found that there is a large difference between vertebrate and invertebrate rRNA base pair numbers. In Drosophila, 12S rRNA has 785 bp, whereas in vertebrates, it is around 954 bp, and 16S rRNA has 1324 bp in Drosophila, whereas in vertebrates, it is around 1686 bp.
| Typical chondrichthyes | Typical osteichthyes (Labeo) | Neoceratodus(Lung Fish) | Bufo melanostictus(Amphibia) |
| Phe, 70 | Phe, | Phe, 68 | Phe, 67 |
| 12S, 951 | 12S | 12S, 951 | 12S, 936 |
| Val, 71 | Val | Val, 70 | Val, 68 |
| 16S, 1669 | 16S | 16S, 1679 | 16S, 1597 |
| Leu, 74 | Leu | Leu, 74 | Leu, 72 |
| ND1, 974 | ND1 | ND1, 971 | ND1, 960 |
| Ile, 69 | Ile | Ile, 76 | Ile, 70 |
| Gln, 71 | Gln | Gln, 70 | Gln, 68 |
| Met, 68 | Met | Met, 68 | Met, 72 |
| ND2, 1044 | ND2 | ND2, 1043 | ND2, 1032 |
| Trp, 70 | Trp, | Trp, 71 | Trp, 69 |
| Ala, 68 | Ala | Ala, 68 | Ala, 68 |
| Asn, 72 | Asn | Asn, 72 | Asn, 72 |
| Rep org, 37 | Cys | Rep org, 35 | Rep org, 10 |
| Cys, 66 | Tyr | Cys, 70 | Cys, 65 |
| Tyr, 68 | COI | Tyr, 69 | Tyr, 69 |
| COI, 1556 | Ser | COI, 1556 | COI, 1541 |
| Ser, 70 | Asp | Ser, 70 | Ser, 67 |
| Asp, 68 | COII | Asp, 68 | Asp, 68 |
| COII, 690 | Lys | COII, 712 | COII, 687 |
| Lys, 73 | ATP8 | Lys, 71 | Lys, 70 |
| ATP8, 167 | ATP6 | ATP8, 167 | ATP8, 164 |
| ATP6, 683 | COIII | ATP6, 683 | ATP6, 683 |
| COIII, 785 | Gly | COIII, 785 | COIII, 783 |
| Gly, 69 | ND3 | Gly, 70 | Gly, 67 |
| ND3, 348 | Arg, | ND3, 348 | ND3, 339 |
| Arg, 69 | ND4L | Arg, 69 | Arg, 70 |
| ND4L, 296 | ND4 | ND4L, 296 | ND4L, 299 |
| ND4, 1380 | His | ND4, 1380 | ND4, 1364 |
| His, 68 | Ser | His, 68 | His, 68 |
| Ser, 66 | Leu | Ser, 66 | Ser, 66 |
| Leu, 71 | ND5 | Leu, 68 | ND5, 1788 |
| ND5, 1829 | ND6 | ND5, 1829 | ND6, 494 |
| ND6, 521 | Glu | ND6, 515 | Glu, 67 |
| Glu, 69 | Cyt b | Glu, 68 | Cyt b, 1145 |
| Cyt b, 1144 | Thr | Cyt b, 1143 | D-loop, 1967 |
| Thr, 69 | Pro | Thr, 72 | Leu, 71 |
| Pro, 68 | D-loop | Pro, 69 | Thr, 71 |
| D-loop, 1062 | D-loop, 925 | Pro, 68 |
Figure 7: Mitochondrial genome arrangement showing the evolutionary relation among fishes and amphibian. Rearrangement shown in arrow marks.
4. D-loop region:
The D-loop region or control region is observed between two tRNA genes, namely tRNAP and tRNAF, in the mitochondrial genome of L. rohita (Accession Number: AB011201).
- Comparing the mitochondrial genome of three Labeo species – Labeorohita, L. calbasu, and L. bata (see Figure 3) – it was observed that the position of the D-loop region is the same. Its length differs by only (1-3) bp. Therefore, it can be said that in the case of the D-loop region, the mitochondrial genome arrangement of L. rohita can represent the Labeo species.
- When the mitochondrial genome arrangement of L. rohita is compared with that of Tenualosailisha, Channa marulius, and Heteropneustesfossilis (see Figure 4), and with Mastacembelusarmatus, Macrognathus aculeatus, and Sicamugilcascasia (see Figure 5), it was found that although the position is the same, the length of the D-loop region differs from 82 bp to 228 bp, which suggests placing these osteichthyes in different orders. However, from the arrangement comparison, it can be concluded that the arrangement is typical.
- When the typical mitochondrial genome arrangement of fish is compared with chondrichthyes fish such as Chimaera monstrosa, Dasyatiszugei, and Scoliodonlaticaudus (see Figure 6), it was found that the arrangement and position of the D-loop region are the same. However, the length differs from (122-1582) bp, which indicates that these fish cannot be placed in the same class. It was observed that they belong to the class Chondrichthyes.
| Typical Fish | Amphibia Bufo melanostictus | Reptile Gekko gecko | Bird Acridotheres tristis | Mammal Cavia porcellus |
| Phe, | Leu, 71 | Phe, 73 | Phe, 69 | Phe, 65 |
| 12S | Thr, 71 | 12S, 957 | 12S, 979 | 12S, 942 |
| Val | Pro, 68 | Val, 69 | Val, 70 | Val, 69 |
| 16S | Phe, 67 | 16S, 1585 | 16S, 1598 | 16S, 1565 |
| Leu | 12S, 936 | Leu, 75 | Leu, 75 | Leu, 74 |
| ND1 | Val, 68 | ND1, 962 | ND1, 978 | ND1, 960 |
| Ile | 16S, 1597 | Ile, 72 | Ile, 72 | Ile, 65 |
| Gln | Leu, 72 | Gln, 72 | Gln, 71 | Gln, 71 |
| Met | ND1, 960 | Met, 69 | Met, 69 | Met, 69 |
| ND2 | Ile, 70 | ND2, 1035 | ND2, 1040 | ND2, 1044 |
| Trp, | Gln, 68 | Trp, 71 | Trp, 70 | Trp, 70 |
| Ala | Met, 72 | Ala, 68 | Ala, 69 | Ala, 69 |
| Asn | ND2, 1032 | Asn, 72 | Asn, 73 | Asn, 73 |
| Cys | Trp, 69 | Cys, 62 | Cys, 67 | Rep_origin, 37 |
| Tyr | Ala, 68 | Tyr, 65 | Tyr, 71 | Cys, 67 |
| COI | Asn, 72 | COI, 1544 | COI, 1551 | Tyr, 67 |
| Ser | Rep org, 10 | Ser, 74 | Ser, 73 | COI, 1542 |
| Asp | Cys, 65 | Asp, 67 | Asp, 69 | Ser, 69 |
| COII | Tyr, 69 | COII, 692 | COII, 684 | Asp, 69 |
| Lys | COI, 1541 | Lys, 68 | Lys, 68 | COII, 684 |
| ATP8 | Ser, 67 | ATP8, 169 | ATP8, 168 | Lys, 67 |
| ATP6 | Asp, 68 | ATP6, 686 | ATP6, 684 | ATP8, 204 |
| COIII | COII, 687 | COIII, 783 | COIII, 784 | ATP6, 681 |
| Gly | Lys, 70 | Gly, 69 | Gly, 69 | COIII, 784 |
| ND3 | ATP8, 164 | ND3, 339 | ND3, 351 | Gly, 68 |
| Arg, | ATP6, 683 | Arg, 68 | Arg, 70 | ND3, 347 |
| ND4L | COIII, 783 | ND4L, 296 | ND4L, 297 | Arg, 68 |
| ND4 | Gly, 67 | ND4, 1380 | ND4, 1378 | ND4L, 297 |
| His | ND3, 339 | His, 71 | His, 70 | ND4, 1378 |
| Ser | Arg, 70 | Ser, 64 | Ser, 64 | His, 69 |
| Leu | ND4L, 299 | Leu, 70 | Leu, 71 | Ser, 57 |
| ND5 | ND4, 1364 | ND5, 1829 | ND5, 1818 | Leu, 70 |
| ND6 | His, 68 | ND6, 509 | Cyt b, 1143 | ND5, 1812 |
| Glu | Ser, 66 | Glu, 65 | Thr, 70 | ND6, 531 |
| Cyt b | ND5, 1788 | Cyt b, 1134 | Pro, 70 | Glu, 69 |
| Thr | ND6, 494 | Thr, 70 | ND6, 519 | Cyt b, 1140 |
| Pro | Glu, 67 | Pro, 67 | Glu, 72 | Thr, 69 |
| D-loop | Cyt b, 1145 | D-loop, 1172 | Misc_feature, 1250 | Pro, 68 |
| D-loop, 1967 | D-loop, 1357 |
Figure 8: Comparison of mitochondrial genome arrangement of typical fish with other vertebrate such as Amphibian (Bufo melanostictus, A/N: NC_005794), Reptile (Gekko gecko, A/N: HM 370130), Bird (Acridotheres tristis, A/N: NC_015195), Mammal (Cavia porcellus, A/N: AJ222767).number showing the total length of particular gene in the boxes, Protein coding genes are represent bold. tRNA gene are represent as three-letter code.
- When the typical mitochondrial genome arrangement of fish is compared with lung fish Neoceratodusforsteri (see Figure 6), it was found that the arrangement and position of the D-loop region are the same. The length differs from that of typical fish by only about 15 bp. This finding suggests that this lungfish can be placed with typical fish in the class Osteichthyes.
- When the typical mitochondrial genome arrangement of fish is compared with amphibian Bufo melanostictus (see Figure 7), it was revealed that the D-loop region is 1967 bp long and positioned between the cytochrome b gene and tRNAleu, which differs from the typical mitochondrial genome of fish. Specifically, it can be said that this position of the D-loop region in amphibian Bufo melanostictus is different from that in fish. Therefore, it can be concluded that amphibians belong to a different class.
- When the typical mitochondrial genome arrangement of fish is compared with reptiles (G. gecko), birds (A. tristis), and mammals (C. porcellus), it was revealed that the position of the D-loop region of reptiles and mammals is similar to that of typical fish genome. However, the position of the D-loop region in birds is between tRNAglu and tRNAphe. This is due to the transposition of the cyt b gene.
- When the typical mitochondrial genome arrangement of fish is compared with Drosophila melanogaster (Invertebrate) (see Figure 9), it was found that the D-loop region of Drosophila is located between the small ribosomal RNA (12S rRNA) and tRNAile, with a length ranging from 14917 bp to 19517 bp. As the position and length vary significantly from vertebrates, it can be concluded that Drosophila should be placed in another subkingdom. The same result was found in the case of barnacles Tetraclita japonica (Rowshan et al., 2004).
Thus, we can conclude that the vertebrate order is first Osteichthyes, then Chondrichthyes, followed by lungfish, and immediately after lungfish is the position of amphibians. Therefore, it can be said that lungfishes are the closest relatives of the class Amphibia.
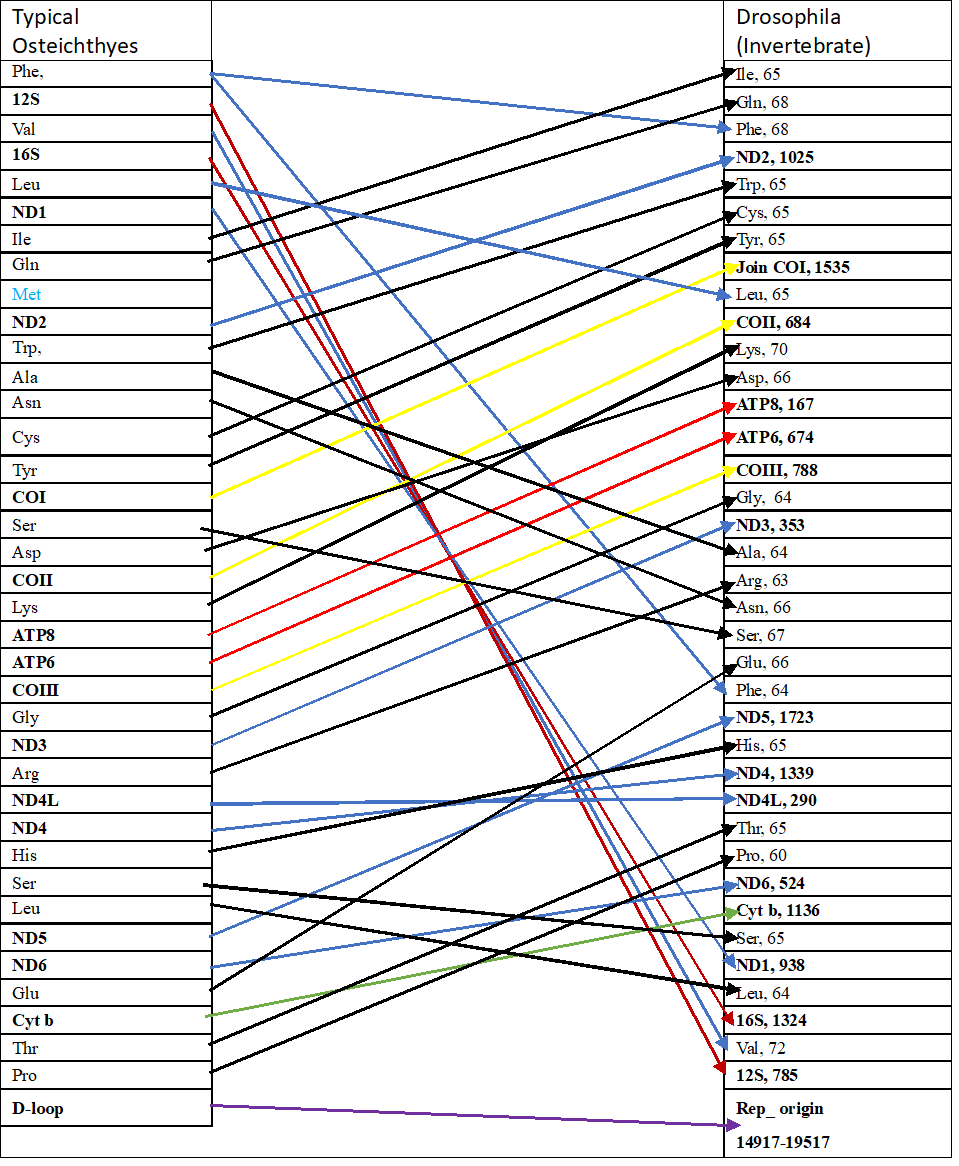
Figure 9: The comparison of mitochondrial genome arrangement between typical Osteichthyes (Labeo) and Drosophila. Rearrangement are shown in arrow marks (black= a.a; yellow=CO gene; blue=ND gene).
Phylogenetic Tree:
The relationships among Labeo species, Labeo species with other Osteichthyes, Chondrichthyes, lungfish, and amphibians were investigated using a phylogenetic tree based on the nucleotide sequences of CoI, 16S, and cytochrome b genes. The molecular phylogenetic tree with bootstrap values was constructed with particular attention to different groups of animals.
1. Phylogenetic Tree based on Nucleotide Sequence of CoI Gene:
- For the nucleotide dataset of the concatenated CoI, the Maximum Likelihood (ML) method produced distinct branching orders. Three species of Labeo formed a monophyletic group with the highest bootstrap value of 100% in the ML tree. This relationship is consistent with the genome arrangement and the phylogeny based on the CoI gene (see Figure 10).
- Osteichthyes such as Tenualosailisha, Channa marulius, Heteropneustesfossilis, Mastacembelusarmatus, Macrognathus aculeatus, and Sicamugilcascasia form a monophyletic group according to ML trees, consistent with the phylogeny based on taxonomy.
- Neoceratodusforsteri (lungfish) is placed just after the Osteichthyes group in the Maximum Likelihood tree.
- The phylogenetic tree reveals that Chondrichthyes fish such as Chimaera monstrosa, Dasyatiszugei, and Scoliodonlaticaudus form a monophyletic group, positioned after Amphibia (Bufo melanostictus).
- ML shows that Bufo melanostictus (amphibian) is positioned after the lungfish. This relationship is consistent with the genome arrangement and the phylogeny based on the CoI gene (see Figure 10).
- The Maximum Likelihood tree shows that birds are situated just before mammals, with a bootstrap value of 0.93, indicating the relevance of this position. This relationship also supports the taxonomic hierarchy of vertebrates.
- In the case of Drosophila, the ML tree shows Drosophila as an outgroup. This finding is consistent with the comparison of mitochondrial genome arrangements.
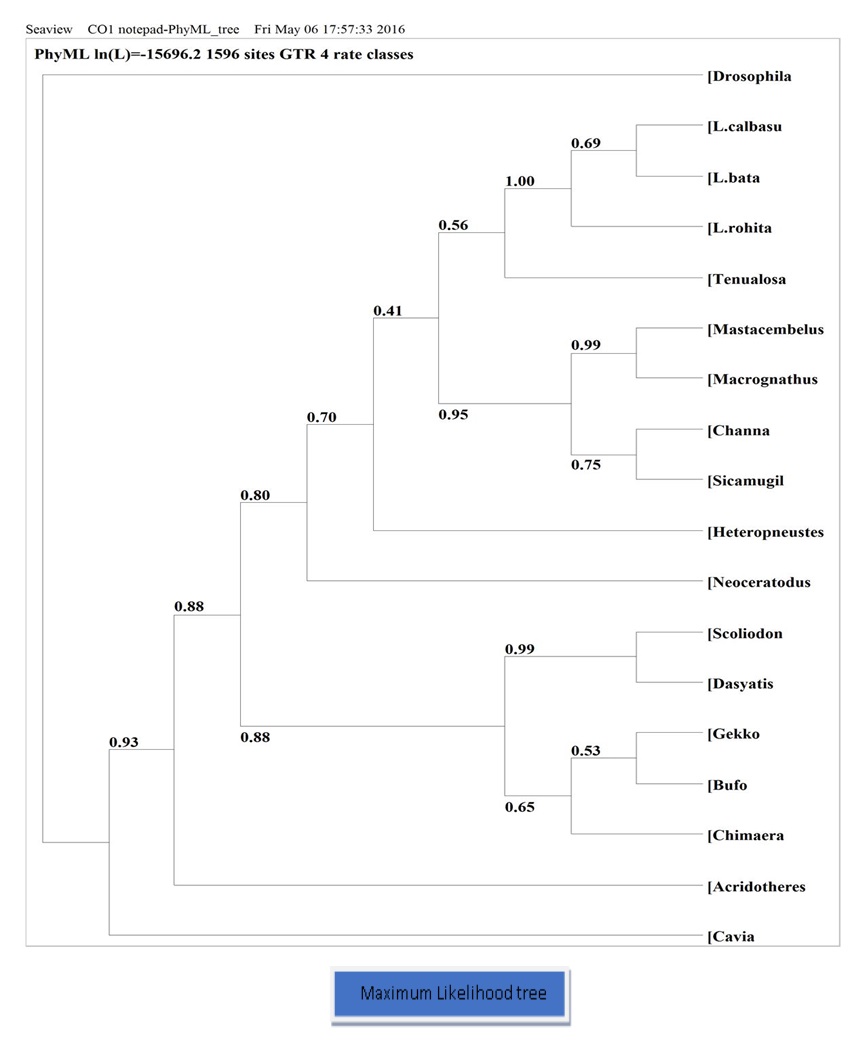
Figure 10: Phylogenic tree (Maximum Likelihood) based on nucleotide sequence of CO1 gene, number showing the bootstrap values. Nucleotide sequence of Drosophila was used as outgroup.
2. Phylogenetic Tree based on Nucleotide Sequence of 16S rRNA Gene:
- Analysis of the phylogenetic tree based on the 16S rRNA gene of 15 vertebrate species revealed that the Maximum Parsimony and Neighbor Joining methods produce different branching orders. However, a common finding in both trees is that Labeo species form a monophyletic group with a bootstrap value of 100.
- According to both Maximum Parsimony and Neighbor Joining trees, Tenualosailisha, Channa marulius, Heteropneustesfossilis, Mastacembelusarmatus, Macrognathus aculeatus, Sicamugilcascasia, including Labeo species, form a group, although there are some sub-groups within this larger group. This grouping can be referred to as the Osteichthyes fish group.
- The phylogenetic tree reveals that Chondrichthyes fish such as Chimaera monstrosa, Dasyatiszugei, and Scoliodonlaticaudus form a monophyletic group, positioned with the lungfish Neoceratodusforsteri.
- Neoceratodusforsteri (lungfish) is placed just after the Chondrichthyes group in the Maximum Likelihood tree.
- When a phylogenetic tree (maximum likelihood) was constructed from the 16S nucleotide sequence of different selected species, it was observed that higher vertebrates form a monophyletic group.
- In the case of Drosophila, the Neighbor Joining tree shows Drosophila as an outgroup, while the Maximum Parsimony tree shows both Drosophila and Bufo as monophyletic. Bufo’s position is after the fish group (as Osteichthyes, Neoceratodus, and Chondrichthyes are all fish and sequentially situated in the phylogenetic tree, they can be referred to as the fish group).
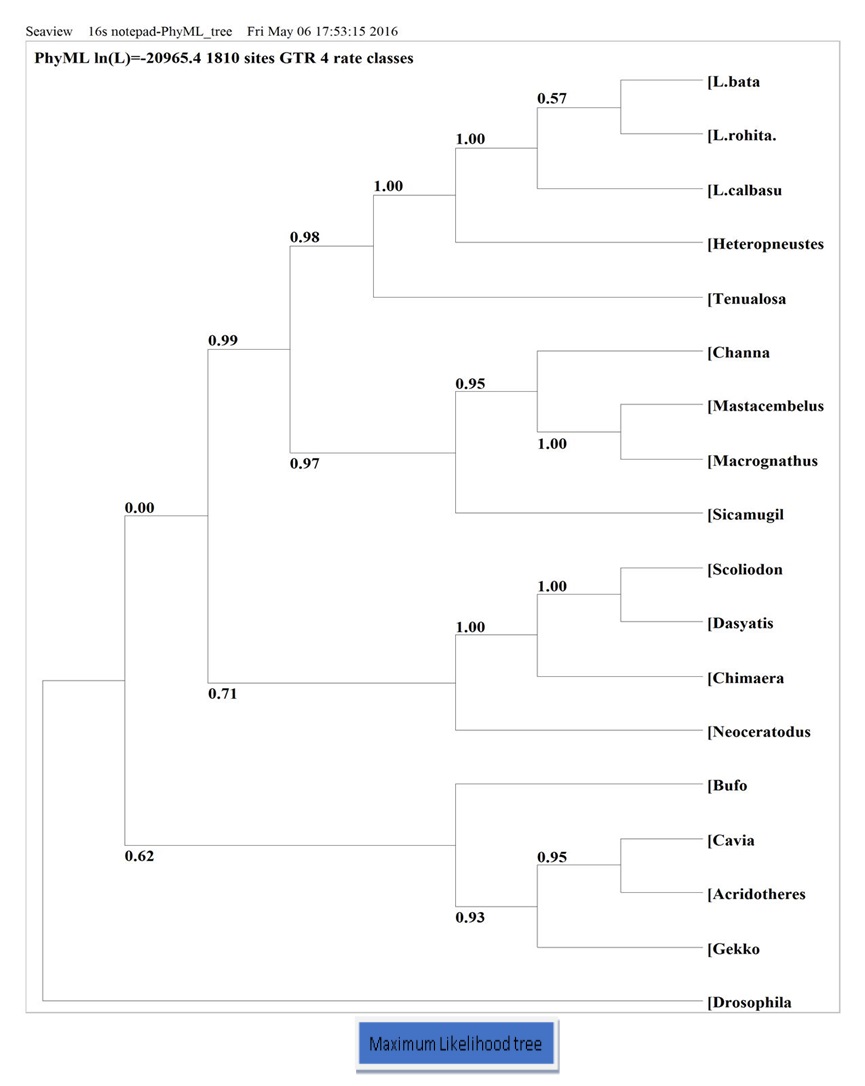
Figure 11: Phylogenic tree (Maximum Likelihood) based on nucleotide sequence of 16S gene, number showing the bootstrap values. Nucleotide sequence of Drosophila was used as outgroup. CONCLUSION
- The genome arrangement of Labeorohita is conserved in most osteichthyes species, indicating a common evolutionary history among these species.
- The phylogenetic tree constructed from the nucleotide sequence of 16S rRNA supports the conclusion that lungfish is the closest relative of amphibians.
- The arrangement of the 37 genes in L. rohita’s genome could serve as representative data for vertebrates, excluding birds due to a distinct arrangement.
- The genome arrangement of invertebrates differs significantly from that of vertebrates, highlighting a clear distinction in evolutionary paths between these two groups.
REFERENCE
- Ahmed, M. S., Datta, S. K., &Zhilik, A. A. (2020). Molecular diversity of freshwater fishes of Bangladesh assessed by DNA barcoding. Bangladesh Journal of Zoology, 48(1), 1-19.
- Rahman, A. K. A. (2005). Freshwater fishes of Bangladesh (2nd ed.). Zoological Society of Bangladesh, University of Dhaka.
- Wolstenholme, D. R. (1992). Animal mitochondrial DNA: structure and evolution. International Review of Cytology, 141, 173-216.
- Castro, J. A., Picornell, A., & Ramon, M. (1998). Mitochondrial DNA: a tool for populational genetics studies. International Microbiology, 1(4), 327-332.
- Girish, P. S., Anjaneyulu, A. S. R., Viswas, K. N., Shivakumar, B. M., Anand, M., Patel, M., & Sharma, B. (2005). Meat species identification by polymerase chain reaction-restriction fragment length polymorphism (PCR-RFLP) of mitochondrial 12S rRNA gene. Meat Science, 70(1), 107-112.
- Bridge, J. S. (1992). A revised model for water flow, sediment transport, bed topography and grain size sorting in natural river bends. Water Resources Research, 28(4), 999-1013.
- Boore, J. L., & Brown, W. M. (1994). Complete DNA sequence of the mitochondrial genome of the black chiton, Katharina tunicata. Genetics, 138(2), 423-443.
- Boore, J. L. (1999). Animal mitochondrial genomes. Nucleic Acids Research, 27(8), 1767-1780.
- Wolfe, K. H., & Sharp, P. M. (1993). Mammalian gene evolution: nucleotide sequence divergence between mouse and rat. Journal of Molecular Evolution, 37, 441-456.
- Begum, R. A., Yamaguchi, T., & Watabe, S. (2004). Molecular phylogeny of thoracican barnacles based on the mitochondrial 12S and 16S rRNA genes. Sessile Organisms, 21(2), 47-54.
ACKNOWLEDGEMENT
First and foremost, I extend my deepest gratitude to the Almighty ALLAH for His boundless blessings, guidance, and protection throughout my academic journey.
I am profoundly indebted to my esteemed Professor, Dr. Rowshan Ara Begum, from the Department of Zoology, University of Dhaka, for her unwavering guidance, invaluable insights, and continuous support during the course of this study. Her mentorship has been instrumental in shaping this research.
I extend my heartfelt appreciation to Professor Dr. Reza Md. Shahjahan for his amiable demeanor and generous counsel, which have enriched this work.
Special thanks are due to Professor Mohammad Shamimul Alam Ph.D., for his encouragement, scholarly guidance, and insightful advice, which have been invaluable in the development of this thesis.
I am grateful to my co-supervisor, Associate Professor Hawa Jahan, from the Department of Zoology, University of Dhaka, for her unwavering cooperation, assistance, and friendly disposition throughout this endeavor.
I acknowledge with gratitude the support and guidance provided by Professor Dr. Md. Anowarul Islam, Former Chairman of the Department of Zoology, University of Dhaka.
I extend my deepest appreciation to my parents, whose boundless love, encouragement, and blessings have been my source of strength and inspiration. Their unwavering support has been instrumental in my academic pursuits.
I am also indebted to my family members for their unwavering encouragement and support throughout my academic journey.
Lastly, I extend my sincere thanks to all my friends who have made my time at Dhaka University memorable and enjoyable. I am also grateful to all the members of the laboratory for their assistance and camaraderie.
February,2024 Authors