
Exploring Consumer Purchasing Decision towards Halal Food Products among University Students in Malaysia using 4P Marketing Mix Theory
- Nashirah Abu Bakar
- Sofian Rosbi
- 3219-3230
- Mar 17, 2025
- Marketing
Exploring Consumer Purchasing Decision towards Halal Food Products among University Students in Malaysia using 4P Marketing Mix Theory
Nashirah Abu Bakar1, Sofian Rosbi2
1Islamic Business School, College of Business, Universiti Utara Malaysia, 06010 Sintok Kedah, Malaysia
2Faculty of Business & Communication, Universiti Malaysia Perlis, 01000 Kangar, Perlis, Malaysia
DOI: https://dx.doi.org/10.47772/IJRISS.2025.9020250
Received: 13 February 2025; Accepted: 17 February 2025; Published: 17 March 2025
ABSTRACT
In the year 2018, the market revenue of global halal food amounted to approximately USD715 trillion and is forecasted to increase to USD2.04 trillion by year 2027. This value indicates the halal food industry is one of the fastest-growing food industries. Therefore, the objective of this study is to evaluate the factors that contribute to the consumer purchasing decision towards halal food products. This study used a deductive method with questionnaire instruments. There are four independent variables namely Product, Price, Place and Promotion. The underpinning theory is 4P Marketing Mix. This study adapts and modify in developing the measurement items. The sample is undergraduate students from universities in Malaysia. The purposive sampling techniques was selected in collecting data from respondents. The 200 respondents were choosing for this study. Next, the data analysis method is using structural equation model with partial least square. The result indicates all four variables exhibit significant and positive influence towards the purchasing decision of consumer towards halal food products. The contribution of this study is it will help food manufactures and retailing to develop and provide more customer-oriented halal food products. In addition, this study adds more contribution towards body of knowledge in halal marketing.
Keywords: Halal Food, 4P Marketing Mix, Malaysia, Consumer Purchasing Decision
INTRODUCTION
The halal food industry has witnessed significant growth and development in Malaysia and globally, driven by increasing consumer awareness and demand for halal-certified products. This growth is particularly notable in Malaysia, where the government has actively promoted the country as a global halal hub. The establishment of the Halal Industry Development Corporation (HDC) in 2006 marked a pivotal moment in this initiative, aiming to position Malaysia as a leader in halal food production and export (Nasir et al. (2021).
One of the primary factors contributing to the growing demand for halal food products is the heightened awareness among Muslim consumers regarding their religious obligations. The Quran and Sunnah dictate dietary laws that prohibit the consumption of haram (forbidden) foods, leading to a growing preference for halal-certified products (Saima, 2024). This awareness is not limited to Muslim consumers; non-Muslims are increasingly recognizing halal food as a safe and high-quality option, further expanding the market (Talib et al., 2016). The global halal food market is projected to reach approximately USD8 trillion by year 2030, reflecting the significant economic potential of this sector (Ali et al., 2020).
Despite the high growth and demand, the halal food industry also faces several challenges. One of the challenge faces is the implementation of halal certification, particularly among small and medium enterprises (SMEs). Many SMEs struggle with the costs and complexities associated with obtaining halal certification, which can hinder their ability to compete in the market. Furthermore, halal ingredient procurement has been highlighted as being of vital importance in global halal supply chains, with widespread application of many non-halal ingredients with the potential for offering halal alternatives for ingredients such as gelatine, pepsin and carmine. All have either halal or vegetable-based alternatives (Randeree, 2019).
The Malaysian halal food industry is characterized by a diverse range of products, including meat, dairy, and processed foods. Therefore, government of Malaysia has implemented various policies to support the growth of this sector, including financial incentives and training programs for producers to enhance their understanding of halal standards (Hassan & Hamdan, 2013). Additionally, the establishment of halal certification bodies has helped to standardize practice and ensure compliance with halal requirements, thereby boosting consumer confidence (Daud, 2023).
Internationally, the halal food market is expanding beyond traditional Muslim-majority countries. Developed nations, despite having smaller Muslim populations, are witnessing a rise in the demand for halal products due to the increasing awareness of health and safety standards associated with halal certification (Nurrachmi, 2018). This trend presents opportunities for Malaysian producers to diversify their export markets and tap into the growing global demand for halal food (Ali et al., 2020).
The development of halal food products in Malaysia and worldwide is a dynamic and evolving landscape. While the industry faces challenges related to certification and market competition, the increasing consumer awareness and demand for halal products present significant opportunities for growth. As Malaysia continues to position itself as a global halal hub, ongoing support from the government and industry stakeholders will be crucial in overcoming these challenges and capitalizing on the burgeoning halal market. Therefore, this paper evaluated the factors that contribute to the consumer purchasing decision towards halal food products.
LITERATURE REVIEW
The halal food industry has experienced significant growth and development, particularly in Malaysia, where the government has actively promoted the country as a global halal hub. This growth is driven by increasing consumer awareness and demand for halal-certified products, which are perceived as safe and compliant with Islamic dietary laws (Nasir et al., 2021; Hassan & Hamdan, 2013). The 4P marketing mix—Product, Price, Place, and Promotion—provides a comprehensive framework for analysing the marketing strategies employed in the halal food sector.
Product
The product aspect of the halal food industry encompasses a wide range of offerings, including meat, dairy, and processed foods. The halal certification process ensures that products meet specific religious and quality standards, which enhances consumers trust and satisfaction (Talib et al., 2016). Moreover, the concept of “Halalan Thoyyiban” emphasizes not only the permissibility of food but also its cleanliness and quality throughout the production chain (Surya & Saragih, 2019). As consumer preferences evolve, halal products are increasingly being tailored to meet the demands of both Muslim and non-Muslim consumers, who view halal food as a high-quality option (Miftahuddin et al., 2022).
Price
Pricing strategies in the halal food market are influenced by various factors, including production costs, certification fees, and market competition. Research indicates that halal certification can enhance a product’s perceived value, allowing producers to command premium prices (Hosseini et al., 2019). However, small and medium enterprises (SMEs) often face challenges in managing these costs, which can hinder their competitiveness in the market (Al, 2023). The willingness to pay for halal products is also affected by consumers’ perceptions of quality and safety, which are critical in driving purchasing decisions (Madenci et al., 2020).
Place
The distribution channels for halal products are essential for ensuring product availability and accessibility. The halal supply chain must be meticulously managed to prevent contamination and maintain product integrity (Zailani et al., 2017). In Malaysia, the government has implemented policies to support halal logistics, which are crucial for maintaining the halal status of products from production to consumption (Zailani et al., 2017). Additionally, the expansion of halal products into international markets presents opportunities for Malaysian producers to diversify their export strategies and tap into the growing global demand for halal food (Ali et al., 2020).
Promotion
Promotional strategies in the halal food industry focus on educating consumers about the benefits of halal products and building brand loyalty. Effective marketing campaigns highlight the ethical and quality aspects of halal food, appealing to both Muslim and non-Muslim consumers (Muflih & Juliana, 2020). Social media influencers have emerged as a powerful tool for promoting halal food, as they can effectively reach target audiences and enhance brand visibility (Antara et al., 2023). Moreover, the role of halal literacy and consumer education is vital in fostering a deeper understanding of halal principles, which can influence purchasing behaviour (Khan et al., 2020).
Therefore, the halal food industry is a dynamic and evolving sector characterized by increasing consumer awareness and demand for halal-certified products. The application of the 4P marketing mix provides valuable insights into the strategies employed by halal producers to enhance product offerings, optimize pricing, improve distribution channels, and implement effective promotional campaigns. As the global halal market continues to expand, ongoing support from government and industry stakeholders will be crucial in overcoming challenges and capitalizing on the burgeoning opportunities within the halal food sector.
RESEARCH METHODOLOGY
This research aims to investigate the factors influencing consumer purchasing decisions regarding halal products among university students in Malaysia, utilizing the 4P marketing mix framework—Product, Price, Place, and Promotion. The study employed a structured questionnaire to collect data from respondents, focusing on their perceptions and behaviors related to halal products.
The research adopts a quantitative approach, employing a cross-sectional survey design to gather data from university students. This design is appropriate as it allows for the collection of data at a single point in time, facilitating the analysis of relationships between the 4P marketing mix elements and consumer purchasing decisions (Edeh et al., 2021).
The target population for this study comprises university students enrolled in public and private institutions across Malaysia. A purposive sampling technique employed to select participants from various universities, ensuring a representative sample of the student population. This method is effective in minimizing bias and enhancing the generalizability of the findings (Campbell, 2022). The sample size determined using Cochran’s formula, aiming for 200 respondents to ensure statistical validity.
The questionnaire developed based on the 4P marketing mix framework, with sections dedicated to each of the four elements (McCarthy, 1964). Questions assess students’ perceptions of halal product quality, variety, and compliance with halal standards. Items will be adapted from existing literature on consumer behaviour towards halal products (Sousa, et al., 2017). Questions focus on the availability and accessibility of halal products in various retail outlets, including supermarkets, convenience stores, and online platforms. This section explores how distribution channels influence purchasing behavior (Ming & Jais, 2022). The questionnaire utilizes a 5-point Likert scale (1 = Strongly Disagree to 5 = Strongly Agree) to measure respondents’ attitudes and perceptions. A pilot test conducted with a small group of students to refine the questionnaire and ensure clarity and reliability.
Data collected through an online survey distributed via university mailing lists and social media platforms. This approach is efficient and allows for a broader reach among students (Edeh et al., 2021). Informed consent obtained from participants, and confidentiality will be assured.
The collected data analyzed using Statistical Package for the Social Sciences (SPSS) and SmartPLS software. Descriptive statistics employed to summarize demographic information and responses, while inferential statistics, including multiple regression analysis, used to examine the relationships between the 4P marketing mix elements and consumer purchasing decisions (Daragmeh et al., 2021). The significance level will be set at p < 0.05.
This research methodology outlines a structured approach to investigating the influence of the 4P marketing mix on consumer purchasing decisions regarding halal products among university students in Malaysia. By employing a quantitative survey design and a well-structured questionnaire, the study aims to provide valuable insights into the factors that drive halal product consumption in this demographic.
RESULT AND DISCUSSION
This study using partial least square method in assessing the structural equation modelling. There are 200 respondents involved in this analysis. Figure 1 shows the analysis output for research framework.
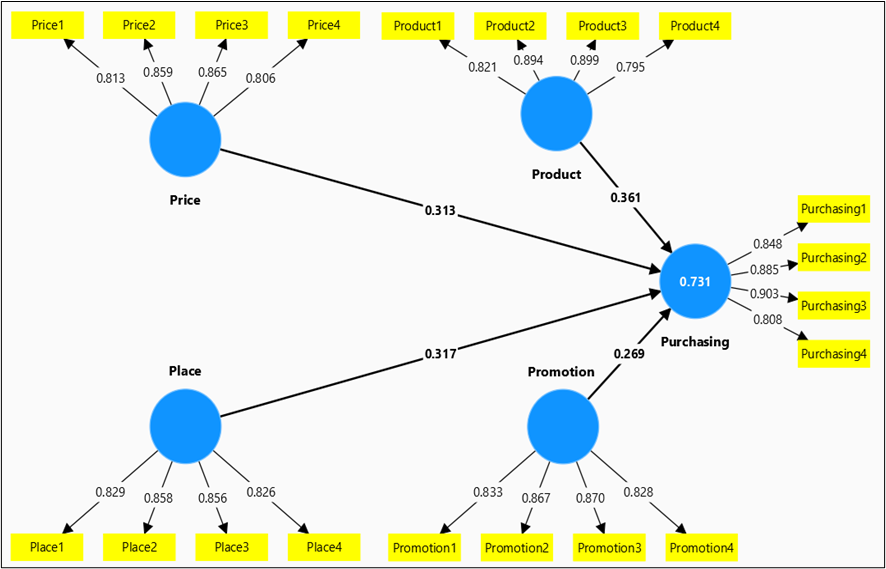
Figure 1: Output result for measurement model for research framework
The outer loading for each of construct as shown in Table 1. The requirement for outer loading should be higher than 0.7 (Hair et.al.,2010). This indicates the items exhibits good convergent validity. Convergent validity is the degree to which the individual indicator reflects the construct (Kline, 2011). The characteristics of the indicator should represent only one factor and be strongly related to each other.
Table 1: Convergent validity based on outer loading for measurement model
| Construct | Items | Outer loading | Convergent validity (loading >0.7) |
| Product (P1) | Product1 | 0.821 | Valid |
| Product2 | 0.894 | Valid | |
| Product3 | 0.899 | Valid | |
| Product4 | 0.795 | Valid | |
| Price (P2) | Price1 | 0.813 | Valid |
| Price2 | 0.859 | Valid | |
| Price3 | 0.865 | Valid | |
| Price4 | 0.806 | Valid | |
| Place (P3) | Place1 | 0.829 | Valid |
| Place2 | 0.858 | Valid | |
| Place3 | 0.856 | Valid | |
| Place4 | 0.826 | Valid | |
| Promotion (P4) | Promotion1 | 0.833 | Valid |
| Promotion2 | 0.867 | Valid | |
| Promotion3 | 0.870 | Valid | |
| Promotion4 | 0.828 | Valid | |
| Purchasing Decision (PD) | Purchasing1 | 0.848 | Valid |
| Purchasing2 | 0.885 | Valid | |
| Purchasing3 | 0.903 | Valid | |
| Purchasing4 | 0.808 | Valid |
Table 2 shows the internal consistency of each construct. Cronbach Alpha (CA) provides reliable opinions based on relationships and correlations between indicator. The acceptable value if the Cronbach Alpha is larger than 0.7 (Hair et. al, 2003). Composite Reliability (CR) is a measure of internal consistency in scale items. CR is the total amount of true score variance relative to the total scale score variance (Brunner & Sub, 2005). The acceptable value of CR should be higher than 0.7 (Hair et. al, 2017). Next, Average Variance Extracted (AVE) is a measure of the amount of variance that is captured by a construct in relation to the amount of variance due to measurement error (Bryne, 2010). The minimum value for acceptable AVE is 0.5. The AVE should not be lower than 0.5 to demonstrate an acceptable level of convergent validity, meaning that the latent construct explains no less than 50% of the indicator variance (Fornell & Larcker, 1981).
Table 2: Internal consistency for construct
| Variable | Cronbach Alpha (>0.7) | Composite Reliability (>0.7) | AVE (>0.5) | Internal consistency |
| Product (P1) | 0.875 | 0.915 | 0.729 | Consistent |
| Price (P2) | 0.856 | 0.903 | 0.699 | Consistent |
| Place (P3) | 0.863 | 0.907 | 0.709 | Consistent |
| Promotion (P4) | 0.872 | 0.912 | 0.722 | Consistent |
| Purchasing Decision (PD) | 0.884 | 0.920 | 0.743 | Consistent |
Table 3 shows the discriminant validity using the Fornell-Larcker criterion. The Fornell-Larcker criterion explains that the square root of AVE in every latent variable should be more than other correlation values among the latent variables (Fornell & Larcker, 1981). It is means that, the diagonal values in bold is the square root of AVE while other values are the correlation between the respective constructs. The discriminant validity is achieved when a diagonal value in bold is higher than the values in its row and column. Table 3 concludes all constructs achieved discriminant validity.
Table 3: Fornell-Larcker criterion
| Product (P1) | Price (P2) | Place (P3) | Promotion (P4) | Purchasing Decision (PD) | Discriminant validity | |
| Product (P1) | 0.854 | Valid | ||||
| Price (P2) | 0.196 | 0.836 | Valid | |||
| Place (P3) | 0.264 | 0.212 | 0.842 | Valid | ||
| Promotion (P4) | 0.363 | 0.458 | 0.201 | 0.850 | Valid | |
| Purchasing Decision (PD) | 0.604 | 0.575 | 0.533 | 0.608 | 0.862 | Valid |
Next, this study evaluated the cross loading for each of construct as shown in Table 4. The loadings of indicators of the construct should be higher than the loading on another construct (Dash & Paul, 2021; Hamid, et al, 2017). Table 4 indicates all construct meet the requirement level of discriminant validity because the loading of measurement items for particular construct is higher than another construct.
Table 4: Cross loadings
| Place | Price | Product | Promotion | Purchasing | |
| Place1 | 0.829 | 0.165 | 0.194 | 0.129 | 0.436 |
| Place2 | 0.858 | 0.137 | 0.196 | 0.230 | 0.451 |
| Place3 | 0.856 | 0.237 | 0.252 | 0.171 | 0.479 |
| Place4 | 0.826 | 0.173 | 0.246 | 0.144 | 0.427 |
| Price1 | 0.197 | 0.813 | 0.127 | 0.396 | 0.454 |
| Price2 | 0.128 | 0.859 | 0.140 | 0.389 | 0.473 |
| Price3 | 0.196 | 0.865 | 0.242 | 0.422 | 0.514 |
| Price4 | 0.189 | 0.806 | 0.139 | 0.326 | 0.479 |
| Product1 | 0.170 | 0.234 | 0.821 | 0.383 | 0.517 |
| Product2 | 0.275 | 0.207 | 0.894 | 0.295 | 0.553 |
| Product3 | 0.253 | 0.158 | 0.899 | 0.326 | 0.539 |
| Product4 | 0.197 | 0.055 | 0.795 | 0.228 | 0.444 |
| Promotion1 | 0.211 | 0.420 | 0.252 | 0.833 | 0.539 |
| Promotion2 | 0.138 | 0.395 | 0.295 | 0.867 | 0.520 |
| Promotion3 | 0.196 | 0.408 | 0.317 | 0.870 | 0.529 |
| Promotion4 | 0.134 | 0.328 | 0.380 | 0.828 | 0.473 |
| Purchasing1 | 0.429 | 0.493 | 0.507 | 0.552 | 0.848 |
| Purchasing2 | 0.506 | 0.499 | 0.532 | 0.444 | 0.885 |
| Purchasing3 | 0.467 | 0.502 | 0.544 | 0.590 | 0.903 |
| Purchasing4 | 0.435 | 0.488 | 0.496 | 0.506 | 0.808 |
Then, the discriminant validity also analysed using the Heterotrait-Monotrait ratio of correlations (HTMT). The HTMT is a statistical technique employed to evaluate discriminant validity in business management research (Nawanir et al., 2019; Roemer et al., 2021). The acceptable level of discriminant validity is suggested to be less than 0.90 (Hair & Alamer, 2022; Gold et al., 2001; Kline, 2011).
The HTMT was introduced by Henseler et al. (2015) as an estimator for the correlation between two latent variables. It is based on the multitrait-multimethod (MTMM) matrix, in which correlations are compared to assess discriminant validity (Campbell and Fiske, 1959). Table 5 shows the HTMT value for each of the construct for this study. The result shows all value less than 0.90. Therefore, this indicates that discriminant validity has been ascertained. As the conclusion, the measurement model passed all diagnostic tests.
Table 5: HTMT
| Product (P1) | Price (P2) | Place (P3) | Promotion (P4) | Purchasing Decision (PD) | Discriminant validity | |
| Product (P1) | Valid | |||||
| Price (P2) | 0.221 | Valid | ||||
| Place (P3) | 0.301 | 0.246 | Valid | |||
| Promotion (P4) | 0.417 | 0.528 | 0.229 | Valid | ||
| Purchasing Decision (PD) | 0.684 | 0.661 | 0.609 | 0.691 | Valid |
Next, this study evaluated the structural model. Figure 2 shows the structural path model for the research framework. Table 2 shows significance of path coefficient analysis for structural model. The result revealed Product (P1) has a positive and significant influence on Purchasing Decision (PD) with standard beta coefficient is 0.361, p-value is 0.000. Next, the analysis shows Price (P2) has a positive and significant influence on Purchasing Decision (PD) with standard beta coefficient is 0.313, p-value is 0.000. Then, the analysis shows Place (P3) has a positive and significant influence on Purchasing Decision (PD) with standard beta coefficient is 0.317, p-value is 0.000. Subsequently, the analysis shows Promotion (P4) has a positive and significant influence on Purchasing Decision (PD) with standard beta coefficient is 0.269, p-value is 0.000.
Based on Table 7, all four hypotheses are supported. This concluded that in encouraging consumers to purchase halal food, all four variables namely Product, Price, Place and Promotion need to carefully consider. Businesses must continuously adapt these elements based on market trends, customer preferences, and competitive pressures to maximize success.
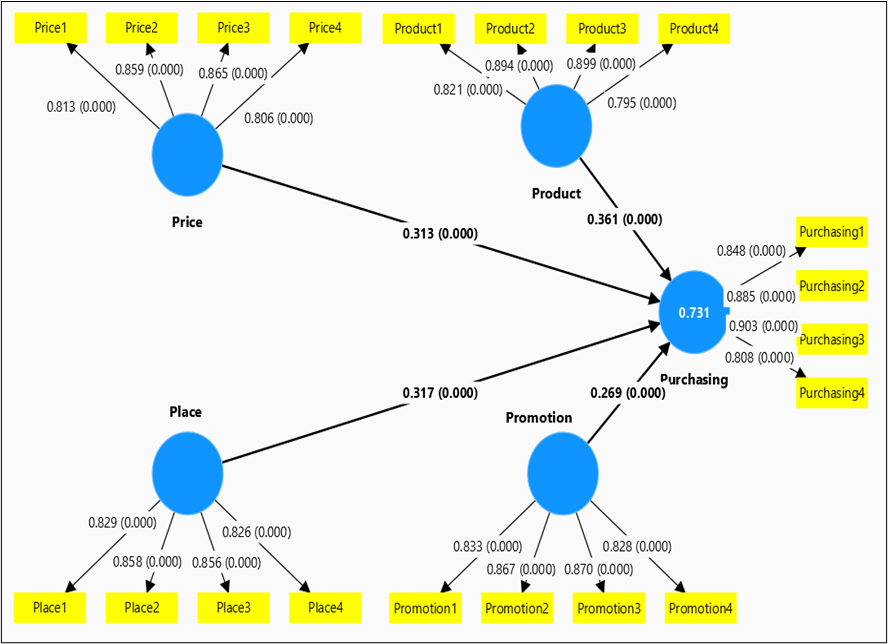
Figure 2: Output result for structural model for research framework
Table 6: Path analysis
| Relationship | Std beta | t-value | p-value | Lower Limit | Upper limit | Significant |
| P1>PD | 0.361 | 6.681 | 0.000 | 0.268 | 0.445 | Yes |
| P2>PD | 0.313 | 5.559 | 0.000 | 0.225 | 0.410 | Yes |
| P3>PD | 0.317 | 6.140 | 0.000 | 0.229 | 0.398 | Yes |
| P4>PD | 0.269 | 5.011 | 0.000 | 0.186 | 0.363 | Yes |
Table 7: Hypotheses testing
| Hypothesis | p-value | Decision |
| There is significant and positive Product (P1) towards Purchasing Decision | 0.000 | Supported |
| There is significant and positive Price (P2) towards Purchasing Decision | 0.000 | Supported |
| There is significant and positive Place (P3) towards Purchasing Decision | 0.000 | Supported |
| There is significant and positive Promotion (P4) towards Purchasing Decision | 0.000 | Supported |
Next, this research calculated the R-squared value for the established structural model. R-Squared (R² or the coefficient of determination) is a statistical measure in a regression model that determines the proportion of variance in the dependent variable that can be explained by the independent variable (Chicco et al., 2021). R-squared is a measure that provides information about the goodness of fit of a model. The threshold value for good model fit is 0.5 (Hair et al., 2017). Table 8 shows R-squared is 0.731 indicating that 73.1% of the variation in the dependent variable was explained by the independent variables in developed structural model. Therefore, the model fit is substantial that indicates high level of model fit and predictive accuracy.
Q-square is predictive relevance, measures whether a model has predictive relevance or not (> 0 is good). Further, Q2 establishes the predictive relevance of the endogenous constructs. Q-square values above zero indicate that data and model analysis values are well reconstructed and that the model has predictive relevance (Fornell & Cha, 1994). Table 8 shows Q² value greater than zero indicates that the model has predictive relevance, meaning it can reliably predict outcomes for new data points.
It’s important to note that while both R² and Q² assess model fit, they serve different purposes. R² measures how well the model fits the training data, whereas Q² evaluates the model’s predictive performance on new, unseen data. Table 8 concludes that the developed structural model exhibits substantial model fit and high predictive relevance.
Table 8: R-squared and Q-squared analysis
| Model | R-squared (R2) | Model fit (R2>0.5) | Q-squared (Q2) | Predictive relevance (Q2>0) |
| Structural model | 0.731 | Substantial model fit | 0.533 | Good predictive relevance |
Then, this study performed the collinearity diagnostics test. A variance inflation factor (VIF) measures the amount of multicollinearity in a set of multiple regression variables. Here are common thresholds for interpreting VIF values: VIF = 1: No correlation between the predictor variable and other variables. 1 < VIF < 5: Moderate correlation; generally acceptable. VIF ≥ 5: Indicates potentially problematic multicollinearity (Hair et al., 2011). Table 9 shows the VIF value. Based on Table 9, the VIF for all four constructs are less than 5, that concludes there is no serious multicollinearity problem.
In statistics, an effect size is a value measuring the strength of the relationship between two variables in a population, or a sample-based estimate of that quantity. It assesses how strong one exogeneous construct contributes to explain a certain endogenous construct in term of R-squared. According to Cohen’s (1988) guidelines, f2 ≥ 0.02, f2 ≥ 0.15, and f2 ≥ 0.35 represent weak, moderate, and substantial effect sizes, respectively. Table 9 shows the f-squared value for variables in the research model. Table 9 indicates Product (P1) has substantial effect on Purchasing Decision (PD) as the f-squared was recorded at 0.400. Next, the Price (P2) has moderate effect
Table 9: VIF and f-squared analysis
| Variable | VIF | Serious multicollinearity (VIF ≥ 5) | f-squared value | Effect size |
| Product (P1) | 1.205 | no | 0.400 | substantial |
| Price (P2) | 1.291 | no | 0.282 | moderate |
| Place (P3) | 1.110 | no | 0.336 | moderate |
| Promotion (P4) | 1.408 | no | 0.191 | moderate |
CONCLUSION
The halal food marketing landscape in Malaysia is characterized by a dynamic interplay of the 4P marketing mix—Product, Price, Place, and Promotion—each playing a crucial role in shaping consumer purchasing decisions. The findings of this research underscore the importance of these elements in enhancing the appeal and accessibility of halal products to both Muslim and non-Muslim consumers.
For first construct, product shows attributes, such as quality, variety, and compliance with halal standards, are paramount in influencing consumer preferences. The halal certification process not only assures consumers of the product’s compliance with Islamic dietary laws but also enhances their trust and satisfaction. As consumers become increasingly aware of the health and ethical implications of their food choices, the demand for high-quality halal products continues to rise.
For the second construct, Price strategies are also critical, as they directly impact consumer purchasing behaviour. The study indicates that while consumers are willing to pay a premium for halal-certified products, the pricing must remain competitive to attract a broader audience, particularly among price-sensitive segments. This balance is essential for small and medium enterprises (SMEs) that may struggle with the costs associated with halal certification.
The third variable, Place refers to the distribution channels through which halal products are made available to consumers. The research highlights the significance of ensuring that halal products are easily accessible in various retail environments, including supermarkets, convenience stores, and online platforms. Effective distribution strategies can enhance product visibility and convenience, thereby encouraging purchases. The Malaysian government’s initiatives to support halal logistics further facilitate the efficient distribution of halal products, reinforcing Malaysia’s position as a global halal hub.
Finally, Promotion plays a vital role in communicating the benefits of halal products to consumers. The study emphasizes the effectiveness of promotional strategies, such as social media marketing and loyalty programs, in building brand awareness and fostering customer loyalty. By educating consumers about the ethical and quality aspects of halal products, marketers can enhance consumer engagement and drive purchasing decisions. In conclusion, the application of the 4P marketing mix provides valuable insights into the factors influencing consumer purchasing decisions in the halal food sector in Malaysia. As the halal market continues to expand, it is imperative for stakeholders to leverage these marketing strategies to address consumer needs and preferences effectively. Ongoing support from the government and industry players will be crucial in overcoming challenges and capitalizing on the burgeoning opportunities within the halal food market. Future research could explore the impact of emerging trends, such as digital marketing and sustainability, on halal food consumption patterns.
REFERENCES
- Ahmad, A. N., Ungku Zainal, U.F., Othman, M. & Abdul Rahman, R. (2024). Overview of the halal food control system in Malaysia. Food Control, 100, 1-10. https://doi.org/10.1016/j.foodcont.2018.02.035
- Ali, A., Mamat, M. & Rahman, A. (2020). Halal food export and Malaysia’s potential: The applicability of the gravity theory of trade. Journal of Islamic Marketing, 11(1), 1-15. https://doi.org/10.1108/jima-01-2020-0019
- Antara, P. M., Musa, A.H., Idris, A.R., Selamat, S.M., Baharuddin, F.N. & Zainal Abedin, N.F. (2023). Intention to use social media influencers in halal food promotional activities: A proposed conceptual model using the Integrative Model of Behavioural Prediction. International Journal of Academic Research in Business and Social Sciences, 13(3), 978-988, https://doi.org/10.6007/ijarbss/v13-i3/16689
- Brunner, M. & SubN. (2005). Analyzing the Reliability of Multidimensional Measures: An Example from Intelligence Research, Educational and Psychological Measurement, 65(2), 227-240. https://doi.org/10.1177/0013164404268669
- Campbell, D. T., & Fiske, D. W. (1959). Convergent and Discriminant Validation by the Multitrait-Multimethod Matrix. Psychological Bulletin, 56, 81-105.
http://dx.doi.org/10.1037/h0046016 - Campbell, S., Greenwood, MM., Prior, S., Shearer, T., Walkem, K., Young, S., Bywaters, D. & Walker, K. (2020). Purposive sampling: complex or simple? Research case examples. Journal of Research in Nursing, 25(8), 652–661. doi: 1177/1744987120927206
- Chairani, A., Rahman, A., & Zailani, S. (2022). Analysis of the determinants of consumer decisions in purchasing halal beauty products. Journal of Industrial Engineering and Halal Industries, 3(1), 1-10. https://doi.org/10.14421/jiehis.3525
- Chicco D., Warrens, M.J. & Jurman G. (2021). The coefficient of determination R-squared is more informative than SMAPE, MAE, MAPE, MSE and RMSE in regression analysis evaluation. PeerJ Computer Science. 7(3), 1-24. 10.7717/peerj-cs.623
- Daragmeh, A., Sági, J. & Zéman, Z. (2021). Continuous Intention to Use E-Wallet in the Context of the COVID-19 Pandemic: Integrating the Health Belief Model (HBM) and Technology Continuous Theory (TCT), Journal of Open Innovation: Technology, Marketing and Complexity, 7, 1-23. https://doi.org/10.3390/joitmc7020132
- Dash, G. & Paul, J. (2021). CB-SEM vs PLS-SEM methods for research in social sciences and technology forecasting. Technological Forecasting and Social Change, 173, 1-11. https://doi.org/10.1016/j.techfore.2021.121092
- Edeh, F.O., Aryani, D.N., Subramaniam, T., Kee, D.M.H., Samarth, T., Nair, R.K., Kannappan, T., Tan, Y.S. & The, Y.C. (2021). Impact of COVID-19 Pandemic on Consumer Behavior towards the Intention to Use E-Wallet in Malaysia. International Journal of Accounting & Finance in Asia Pasific, 4(3), 42-59. https://doi.org/10.32535/ijafap.v4i3.1205
- Fernando, Y., Ahmad Jasmi, M.F., Wahyuni-TD, I.S., Mergeresa, F., Khamis, K.A., Fakhrorazi, A.& Omar, R. (2023). Supply chain integration and halal frozen meat product returns. Journal of Islamic Marketing, 14(5), 1369- 1395. https://doi.org/10.1108/JIMA-05-2021-0144
- Fornell, C. and Cha, J. (1994) Partial Least Squares. Advanced Methods of Marketing Research, 407, 52-78.
- Fornell, C., & Larcker, D. F. (1981). Evaluating structural equation models with unobservable variables and measurement error. Journal of Marketing Research, 18(1), 39–50. https://doi.org/10.2307/3151312
- Gold, A., Malhotra, A. and Segars, A. (2001). Knowledge Management: An Organizational Capabilities Perspective. Journal of Management Information Systems, 18, 185-214. https://doi.org/10.1080/07421222.2001.11045669
- Hair, J. & Alamer, A. (2022). Partial Least Squares Structural Equation Modelling (PLS-SEM) in Second Language and Education Research: Guidelines Using an Applied Example. Research Methods in Applied Linguistics, 1, 100027. https://doi.org/10.1016/j.rmal.2022.100027
- Hair, J. F., Hollingsworth, C. L., Randolph, A. B., & Chong, A. Y. L. (2017). An updated and expanded assessment of PLS-SEM in information systems research. Industrial Management & Data Systems, 117(3), 442–458. 1108/IMDS-04-2016-0130
- Hair, J. F., Ringle, C. M., & Sarstedt, M. (2011). PLS-SEM: Indeed a silver bullet. Journal of Marketing Theory and Practice, 19(2), 139–151. https://doi.org/10.2753/MTP1069-6679190202
- Hassan, H., & Hamdan, A. (2013). Experience of non-Muslim consumers on halal as third party certification mark in Malaysia. Asian Social Science, 9(15), 263-270. https://doi.org/10.5539/ass.v9n15p263
- Hamid, M.R.A., Sami, W. &Mohmad Sidek, M.H. (2017). Discriminant Validity Assessment: Use of Fornell & Larcker criterion versus HTMT Criterion. Journal of Physics: Conference Series, 890, 1-5. doi:10.1088/1742-6596/890/1/012163
- Henseler, J., Ringle, C. M., & Sarstedt, M. (2015). A new criterion for assessing discriminant validity in variance-based structural equation modeling. Journal of the Academy of Marketing Science, 43(1), 115–135. DOI:1007/s11747-014-0403-8
- Hosseini, P., Mirzaei, S.M., & Iranmanesh, M.(2020). Determinants of Muslims’ willingness to pay for halal certified food: Does religious commitment act as a moderator in the relationships?. Journal of Islamic Marketing, 11(6), 1225-1243. https://doi.org/10.1108/JIMA-02-2018-0043
- Jamil, H., Wahab, A.Y.A., Razak, A.R.A. & Al-Saari, N. (2020). Exploring the internationalization strategy of higher education institutions and halal food ecosystem in Malaysia. Food Research, 4(1), 145-150. https://doi.org/10.26656/fr.2017.4(s1).s23
- Jamil, R., Rahman, A., & Zailani, S. (2020). Financial problems associated with food insecurity among public university students in Peninsular Malaysia. Malaysian Journal of Nutrition, 26(1), 1-10. https://doi.org/10.31246/mjn-2020-0032
- Kamarulzaman, N.H., Muhamad, N.A.and Mohd Nawi, N. (2022). An investigation of adoption intention of halal traceability system among food SMEs. Journal of Islamic Marketing, 13(9), 1872-1900. https://doi.org/10.1108/JIMA-11-2020-0349
- Khan, A., Arafat, M.Y.and Azam, M.K. (2022). Role of halal literacy and religiosity in buying intention of halal branded food products in India. Journal of Islamic Marketing, 13(2), 287-308. https://doi.org/10.1108/JIMA-08-2019-0175
- Khan, M. A., & Kamaruddin, N. (2018). The longitudinal impact of intellectual capital on innovation performance in SMEs. The Journal of Social Sciences Research, 4(8), 207-213. https://doi.org/10.32861/jssr.spi2.207.213
- Madenci, A.B., Bayramoğlu, Z., Türker, S. & Ağızan , K. (2020)/ Determination of consumer’s willingness to pay for halal food. Journal of Tekirdag Agriculture Faculty, 17(3), 346-356. https://doi.org/10.33462/jotaf.681421
- Marmaya, N., Zakaria, Z.& Mohd Desa, M.N. (2019). Gen Y consumers’ intention to purchase halal food in Malaysia: a PLS-SEM approach. Journal of Islamic Marketing, 10(3), 1003-1014. https://doi.org/10.1108/JIMA-08-2018-0136
- Miftahuddin, M.A., Rabiatul Adawiyah, W., Pradipta, R. & Wihuda, F. (2022). Examining the effect of halal perceived value and perceived risk on purchase intention: A mediating role of halal trust. Innovative Marketing, 18(4), 62-73. doi:10.21511/im.18(4).2022.06
- Ming, K.L.Y. & Jais, M. (2022). Factors Affecting the Intention to Use E-Wallets During the COVID-19 Pandemic. Gadjah Mada International Journal of Business, 24(1), 82-100. 22146/gamaijb.64708
- Mohd Daud, A.H., Mohd Soffian Lee, U.H. & Ismail, A. (2023). The practice of halal certification: A case of Malaysia’s halal meat-based industry. International Journal of Academic Research in Business and Social Sciences, 13(8), 1484-1497. https://doi.org/10.6007/ijarbss/v13-i8/17666
- Nasir, S., Zulfakar, M. H., & Rahmat, A. K. (2021). Determinants of Preferred Export Logistics Gateway in Malaysia Halal Product Industry. International Journal of Academic Research in Accounting Finance and Management Sciences, 11(1), 489–498. https://doi.org/10.6007/ijarafms/v11-i1/9823
- Nawanir, G., Lim, K.T.& Othman, S.N. (2016). Lean manufacturing practices in Indonesian manufacturing firms: Are there business performance effects?, International Journal of Lean Six Sigma, 7(2), 149-170. https://doi.org/10.1108/IJLSS-06-2014-0013
- Nurfahmiyati, Assyofa, A.R. & Nurcholisah, K. (2023). Factors driving decision making for purchasing halal products in Indonesia: Literature review. Kajian Akuntansi, 24(2), 346-352. https://doi.org/10.29313/kajian_akuntansi.v24i2.2558
- Othman, B., Shaarani, S.M.& Bahron, A. (2016). Evaluation of knowledge, halal quality assurance practices and commitment among food industries in Malaysia. British Food Journal, 118(8), 2033-2052. https://doi.org/10.1108/BFJ-12-2015-0496
- Rahim, N., & Shahwan, S. (2013). Awareness and perception of Muslim consumers on non-food halal product. Journal of Social and Development Sciences, 4(10), 787-794. https://doi.org/10.22610/jsds.v4i10.787
- Randeree, K.(2019). Challenges in halal food ecosystems: the case of the United Arab Emirates. British Food Journal, 121(5), 1154-1167. https://doi-org.eserv.uum.edu.my/10.1108/BFJ-08-2018-0515
- Roemer, E., Schuberth, F. & Henseler, J. (2021). HTMT2 – An improved criterion for assessing discriminant validity in structural equation modelling, Industrial Management & Data System, 121(12), 2637-2650. DOI 10.1108/IMDS-02-2021-0082
- Saima, S.U., Radin Firdaus, R.B. & Sarjiyanto (2024). Challenges and ways forward for the Malaysian SMEs in the halal food industry: A systematic review. Potravinarstvo Slovak Journal of Food Sciences, 12(1), 223-238. https://doi.org/10.5219/1937
- Sousa, V.E.C., Matson J. & Lopez K. D. (2017). Questionnaire Adapting: Little Changes Mean a Lot. Western Journal of Nursing Research, 39(9), 1289-1300. doi:1177/0193945916678212
- Talib, M. S. A., Rahman, A., & Zailani, S. (2016). Emerging halal food market: An institutional theory of halal certificate implementation. Management Research Review, 39(6), 1-22. https://doi.org/10.1108/mrr-06-2015-0147
- Zailani, S., Iranmanesh, M., Aziz, A.A.& Kanapathy, K. (2017). Halal logistics opportunities and challenges. Journal of Islamic Marketing, 8(1), 127-139. https://doi.org/10.1108/JIMA-04-2015-0028
- Zailani, S., Iranmanesh, M., Jafarzadeh, S.and Foroughi, B. (2020). The influence of halal orientation strategy on financial performance of halal food firms: Halal culture as a moderator. Journal of Islamic Marketing, 11(1), 31-49. https://doi.org/10.1108/JIMA-01-2018-0023
- Byrne, B. M. (2010). Structural Equation Modeling with Amos: Basic Concepts, Applications, and Programming (2nd ed.). New York: Taylor and Francis Group.
- Cohen, J. (1988). Statistical Power Analysis for the Behavioral Sciences (2nd ed.). Hillsdale, NJ: Lawrence Erlbaum Associates, Publishers.
- Hair, J.F., Babin, B., Money, A.H., & Samouel, P. (2003). Essentials of Business Research Method. USA: John Wiley & Sons.
- Hair, J.F., Black, W.C., Babin, B.J. and Anderson, R.E. (2010). Multivariate Data Analysis. 7th Edition, Pearson, New York.
- Kline, R. B. (2011). Principles and practice of structural equation modeling (3rd ed.). Guilford Press.
- McCharty, E.J. (1964). Basic Marketing: A Managerial Approach. 2nd Edition, Irwin, New York.