
Food Choice Motives and Eating Behavior among College Students
- Elprethy B. Falconet.
- Cathlene A. Iluis.
- Gwyneth M. Iwag
- 334-347
- Mar 26, 2025
- Food Security
Food Choice Motives and Eating Behavior among College Students
Elprethy B. Falconet., Cathlene A. Iluis., Gwyneth M. Iwag
Student, Santo Tomas College of Agriculture Sciences and Technology
DOI: https://dx.doi.org/10.47772/IJRISS.2025.90300028
Received: 18 February 2025; Accepted: 24 February 2025; Published: 26 March 2025
ABSTRACT
This study aims to investigate the relationship between food choice motives and eating behavior and also utilized quantitative research, specifically a descriptive correlational design. Two adapted questionnaires were developed and distributed to 349 respondents selected through stratified sampling. The researchers utilized mean, standard deviation, and Pearson’s correlation coefficient (r) for data analysis. The findings revealed high food choice motives for health, sensory appeal, convenience, and natural content among students. Similarly, student eating behaviors in terms of uncontrolled eating, restrained eating, emotional eating, social eating, and proactive eating were also found to be very high. With the results of p-value which is 0.050 and (r) value of 0.106 which indicated a significant relationship between food choice motives and student eating behavior. Therefore, the study underscored the importance for students, parents, instructors, and future researchers to prioritize and be mindful of health, sensory appeal, convenience, and natural content when making food choices. Equipping students with information on how to maintain these considerations, such as choosing foods with pleasant aromas, could empower them to make informed dietary decisions
Keywords – Food Choice Motives, Eating Behaviors, Descriptive Correlational Research, Pearson-r, Stratified Sampling, Philippines
INTRODUCTION
In education, college students’ eating habits exhibited high variability. Health, natural ingredients, convenience, and sensory appeal were just some of the factors influencing their food choices as a health behavior. In the past, students generally developed inconsistent eating patterns due to their busy schedules, demanding workloads, and extended study sessions (Savanur, 2022). Over the past few decades, the prevalence of overweight and obesity has risen sharply, creating a public health crisis. Nevertheless, a person’s eating behaviors were impacted by different circumstances throughout their life.
In Malaysia, research has identified numerous factors influencing food choices and dietary intake. Studies, particularly among emotional eaters in Southeast Asian nations like Malaysia, have shown that using food or eating as a coping mechanism for emotional stress can lead to unhealthy habits (Chan et al, 2020).
In America, similarly college students campuses were found to consume less fruits and vegetables and more high-fat foods compared to the recommended intake. In Europe, a similar trend of weight gain among university students was observed. However, (Deliens et al. 2021) identified a lack of European data on dietary intake among students.
In the Philippines, universities in Zamboanga City and Los Banos have examined the factors influencing students’ meal choices. These factors encompassed the availability of healthy food options, defined as a variety of foods providing essential nutrients for a person’s health and well-being. These nutrients include minerals, carbohydrates, fats, proteins, and water. Previous research has also highlighted the challenges college students face in managing their eating habits and self-control when it comes to food choices. This lack of control can contribute to weight gain (Capili, 2020).
Several recent studies identified gaps in our understanding of how students choose their food. These gaps, in turn, limited the available empirical evidence on which aspects of student food selection require improvement and intervention. For instance, no prior research, to the researcher’s knowledge, had explored the connection between eating behavior and the reasons behind students’ food choices. In light of this critical knowledge gap, this study aimed to address the factors influencing student food choices, including sensory appeal, health considerations, convenience, and the natural content of the food options. Furthermore, a growing body of research (Marta, 2020) suggested that changes in global food systems and increased food availability have contributed to a trend of students consuming more unhealthy options. These changes had a significant impact on student dietary patterns and decision-making. Beyond their academic pursuits, students must also navigate these complex food environments, requiring them to actively manage their diet and lifestyle for optimal health.
Furthermore, a critical need existed to address unhealthy dietary patterns among college students and their impact on eating behaviors. This study aimed to illuminate this issue and its implications for Philippine higher education institutions. The research focused on understanding the factors influencing students’ food choices, preferences, and likes. It highlighted the importance of convenience, natural content, sensory appeal, mood, and health concerns in students’ dietary selections. Early intervention strategies were emphasized as essential for promoting healthy eating habits and optimal food choices.
Moreover, this study investigated the relationship between college student eating behavior and their food choices. The findings underscored the significance of considering factors like convenience, health, and natural content when making food selections. This applied not only to students but also to parents, teachers, and aspiring researchers. Information on sensory appeal, for example, could empower students to maintain healthy dietary choices. Appealing aromas and visual presentation can stimulate hunger and encourage healthy eating. Teachers could have implemented workshops and orientations to explore eating behavior and the motivations behind food choices. Parents could have benefited from guidance on preparing meals that are both nutritious and appealing to their children.
Statement of the Problem
This study sought to address the significant relationship between students’ eating behavior and food selection among college students in Santo Tomas, Davao del Norte.
Specifically, this study aimed to answer the following questions:
- What is the level of food choice motives in terms of:
1.1 health;
1.2 sensory appeal;
1.3 convenience; and
1.4 natural content?
- What is the level of students’ eating behavior in terms of:
2.1 uncontrolled eating;
2.2 restrained eating;
2.3 emotional eating;
2.4 social eating; and
2.5 pro-active eating?
- Is there a significant relationship between food choice motives and eating behavior among college students in Santo Tomas Davao del Norte?
Hypothesis
The null hypothesis, which stated that there is no significant correlation between food choice motives and eating behavior among college students was tested at the 0.05 threshold of significance
Theoretical Framework
Early theories focused on understanding how individuals navigate their social environment to explain eating behavior. Building on this foundation, (Ajzen’s Theory of Planned Behavior, 1988) proposed that intentions, shaped by attitudes, subjective norms, and perceived behavioral control, could explain behavior. In other words, a person’s eating habits reflected their ability to manage their desires in light of their beliefs and social pressures. Research by (Meyer et al., 2022) further suggested that students’ lunch choices might even influence their long-term eating habits. Therefore, the development of eating habits appears to be a complex interplay of various factors. In line with this, public health initiatives and food skills education emerged as crucial factors influencing healthier habits within society, according to (Seda et al., 2022).
These findings aligned with numerous studies validating this connection. For example, stress has been consistently linked to emotional eating, increased fast food intake, and poor lifestyle choices. Similarly, stress, low mood, social isolation, and loneliness, which contribute to depression, have also been associated with emotional eating. Further research by (Matek, 2023) established a connection between food intake and mood improvement, mediated by the perception of tastiness, as well as a correlation between food choices and eating behaviors.
Conceptual Framework
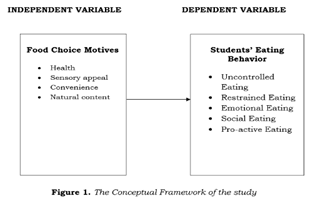
Figure 1 depicted the conceptual framework outlining the study’s variables. As identified by (Steptoe et al., 1995), the independent variable encompassed the reasons for food choices, categorized as convenience, natural content, health, and sensory appeal.
Conversely, the dependent variable, based on (Aguilar,2014), focused on students’ eating behavior, encompassing indicators such as uncontrolled eating, restrained eating, emotional eating, social eating, and pro-active eating.
METHODOLOGY
The research design, research topic, research instrument, data collection process, and statistical analysis of the data were all covered in this chapter.
Research Design
In this study, quantitative research methods were concerned with gathering and evaluating structured data that can be represented numerically. Moreover, quantitative research was a method for learning about a certain population, sometimes known as a sample. Through the use of observed or measured data, it applied scientific investigation to assess concerns over a sample population (Creswell, 2020). Additionally, the researchers used descriptive correlational research to survey the relationship between food choice motives and students’ eating behavior without manipulating any variable in the study.
In relation, to determine the association between numerous factors and create static representations of situations, descriptive correlational design was used (McBurney & White, 2021). Most correlational investigations call for some change in the specific variables being examined (Klazema, 2020). The researchers conducted an analysis utilizing a mathematical method while concentrating on treatment. The processing of data in variable experiments was given a lot of weight in this study to discover relevant correlations between food choice motives and eating behavior among college students. The researchers have employed the above-mentioned design to address the primary study objectives and area of interest. In particular, the researchers used a descriptive approach to investigate, ascertain, and characterize the eating behavior of the students.
Research Subject
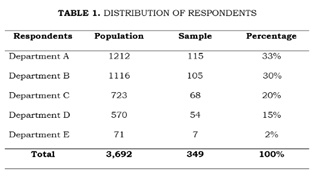
The respondents to this research were college students enrolled in the school year 2023-2024. The respondents’ total population size of the study collectively comprised students from one of the local colleges in Davao del Norte. Specifically, the school consisted of 1212 for Department A first-year students, 1116 for Department B first-year students, 723 for Department C first-year students, 570 for Department D first-year students, and lastly 71 for Department E first-year students.
The researchers used stratified random sampling to verify that their sample included particular subgroups. They also used it to get accurate estimates of each group’s components. This technique was usually used in surveys to clarify variations between sub-populations. The respondents to this study were students who had problems with their eating behavior at one of the local Colleges in Davao Del Norte. Moreover, the respondents’ personal information and responses were kept fully confidential to preserve the respondents’ privacy.
Research Instrument
The researchers employed two (2) modified survey questionnaires. College students’ eating habits were the dependent variable, and food choice motives were the independent variable that was measured using the survey questionnaires. The students’ eating behavior questionnaire was from (Aguilar, 2020), and the food choice questionnaire was from the study of (Carvalho-Ferreira et al., 2022). Five orderable gradations of food choice and students’ eating habits were employed in this study, along with the corresponding measures.
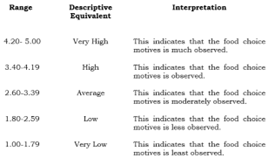
Food Choice Questionnaire (FCQ). The questionnaire for the independent variable “Food Choice Motives” was adopted from (Carvalho-Ferreira et al., 2022). This instrument contained 20-item survey questionnaire comprising the four (4) indicators of a food choice motives questionnaire such as Health (5 items), Sensory Appeal (5 items), Convenience (5 items), and Natural content (5 items). This questionnaire was anchored on a 5-point scale: 5-Strongly Agree, 4-Agree, 3-Moderately Agree, 2-Disagree, and 1-Strongly Disagree.
The following range, descriptive equivalent, and interpretation were applied to determine the level of food choice:
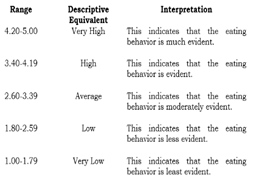
Eating Behavior Questionnaire (EBQ). The questionnaire for the dependent variable “Eating Behavior” was adopted from Aguilar (2014). This instrument contained a 25-item survey questionnaire comprising the five (5) indicators of development and validation of a Filipino eating behavior such as Uncontrolled Eating (5 items), Restrained Eating (5 items), Emotional Eating (5 items), Social Eating (5 items), and Pro-active Eating (5 items). This questionnaire was anchored on a 5- 5-point scale: 5-Strongly Agree, 4-Agree, 3-Moderately Agree, 2-Disagree, and 1-Strongly Disagree.
The following range, descriptive equivalent, and interpretation were applied to determine the level of eating behavior:
Statistical Treatment of Data
The data was computed using the following statistical methods, and the hypothesis was tested at the alpha 0.05 level of significance:
Mean. In this study, this tool was used to determine the level of food choice motives and students’ eating behavior and answered questions number 1 and 2.
Pearson r. In this study, this tool was used to discover the significant relationship between food choices the eating behavior among college students and answered question number 3.
RESULTS AND DISCUSSIONS
This chapter presented the analysis and interpretation of data gathered from the students in one of the Local Colleges in Davao del Norte concerning the level of food choice motives and students’ eating behavior. The arrangement of the data was based on the statement of the problem in Chapter 1.
Level of Food Choice Motives in Terms of Health
Table 2 presented the distribution of health-related food choice motives. As the table revealed, item two (2), “I eat food that keeps me healthy,” had the highest mean score (4.83), which can be described as very high. This suggests that participants were highly aware of the health motivations behind their food choices. Following closely was item four, “I eat food that is high in protein,” with a mean of 4.10 and a descriptive level of high. Interestingly, items “I eat nutritious food” (item number 3) and “I eat food that is good for my skin, teeth, hair, nails, etc.” (item number 5) received the lowest mean (4.00), which also translated to high. This indicated that while health was a significant factor in food choices, other motivations may have also played a role.
The overall standard deviation of 0.19 suggested a high degree of consistency in respondents’ answers to this indicator. In other words, the participants’ responses clustered closely around the mean, indicating a general uniformity in their health-related food choice motivations.
Table 2 Level of Food choice motives in terms of Health
| Items | Mean | SD | Descriptive Equivalent |
| 1. I eat food that contains a lot of vitamins and minerals. | 4.10 | 0.44 | High |
| 2. I eat food that keeps me healthy. | 4.83 | 0.39 | Very High |
| 3. I eat nutritious food. | 4.00 | 0.00 | High |
| 4. I eat food that is high in protein. | 4.01 | 0.08 | High |
| 5. I eat food that is good for my skin/ teeth / hair/ nails and etc. | 4.00 | 0.05 | High |
| Average | 4.19 | 0.19 | High |
Level of Food Choice Motives In Terms Of Sensory Appeal
Table 3 reflected the level of food choice motives in terms of sensory appeal. As the table demonstrated, item five (5), “I eat flavorful food,” received the highest mean (4.11), categorized as “high.” This was followed by item four (4), “I like to eat food that tastes good,” with a mean of 4.03 and a “high” descriptor. Interestingly, items one (1) and two (2), “I want to eat food that smells nice” and “It will boost my appetite if the food looks mouthwatering,” respectively, had the lowest mean (4.00) but still fell under the “high” category. These findings suggested that food choice motives related to sensory appeal were prevalent.
The standard deviation of 0.14 in the overall means indicated that food choice motives in terms of sensory appeal clustered closely around the average. In simpler terms, this meant that students generally preferred food with pleasant aromas and flavors.
Table 3 Level of Food choice motives in terms of sensory appeal
| Items | Mean | SD | Descriptive Equivalent |
| 1. I want to eat food that smells nice. | 4.00 | 0.00 | High |
| 2. It will boost my appetite if the food looks mouthwatering. | 4.00 | 0.00 | High |
| 3. I eat food that has a pleasant texture. | 4.01 | 0.12 | High |
| 4. I like to eat food that tastes good. | 4.03 | 0.17 | High |
| 5. I eat flavorful meals. | 4.11 | 0.42 | High |
| Average | 4.03 | 0.14 | High |
Level of Food Choice Motives In Terms Of Convenience
Table 4 summarized the findings on food choice motives related to convenience. Among the items listed, students rated “I cook food that takes less time to prepare” (Item 3) the highest, with a mean score of 4.42 (very high). This was followed closely by “I eat food that can be bought in shops close to where I live or near our school” (Item 4) and “I prepare food that is easily available in shops and supermarkets” (Item 5), both with a mean score of 4.39 (very high). In contrast, “When I feel sad, I eat my comfort food” (Item 1) received the lowest mean score (4.15; high). The high mean scores for convenience-related items suggested that students prioritize ease and accessibility when making food choices.
The overall standard deviation of 0.51 indicated that the responses were relatively close to the mean. In simpler terms, this implied that a significant portion of the students favored quick and convenient food preparation methods.
Table 4 Level of food choice motives in terms of convenience
| Items | Mean | SD | Descriptive Equivalent |
| 1. I prefer food that is easy to prepare. | 4.15 | 0.46 | Very High |
| 2. I eat food that can be cooked very simply. | 4.31 | 0.48 | Very High |
| 3. I cooked food that takes less time to prepare. | 4.42 | 0.49 | Very High |
| 4. I eat food that can be bought in shops close to where I live or near to our school. | 4.39 | 0.56 | Very High |
| 5. I prefer food that is easily available in shops and supermarkets. | 4.39 | 0.57 | Very High |
| Average | 4.33 | 0.51 | Very High |
A study by (Imtiyaz et al, 2021) suggested that high-quality convenience foods attract consumers to purchase and consume them. This, in turn, shapes customer perception, buying decisions, and usage patterns. Furthermore, (Hena et al., 2021) employed a structural model to analyze convenience food, revealing positive correlations between purchase intention, consumption, and satisfaction. However, despite its significant global impact on food choices, convenience remains inconsistently defined, measured, and conceptualized. (Bogard et al., 2023) argued that this inconsistency hinders the ability of food system policies and interventions to leverage convenience as a tool for improving dietary and nutritional outcomes.
Level of Food Choice Motives In Terms Of Natural Content
The table revealed that item two (2), “I eat the food that contains natural ingredients,” received the highest mean score (4.12), categorized as “high” descriptively. This was closely followed by items three (3) and four (4), “I eat food that has natural preservatives” and “I eat food that is made of fresh ingredients,” respectively, which both scored a mean of 4.10, also considered “high.” Furthermore, item five (5), “I eat food that has a natural color,” had the lowest mean (4.01), still classified as “high.” These findings suggest that students prioritize sensory appeal in their food choices.
The overall standard deviation of 0.26 indicated that the responses to food choice motives related to sensory appeal clustered closely around the mean. In simpler terms, this suggested a general student preference for food that is not only natural and fresh but also tastes good.
The result was supported by the study of (Rankin, 2021), which found that certain consumers may be influenced to choose a particular product because they believe it to be “natural.” Foods that have been processed more are thought to be less natural, and perceptions of “naturalness” are linked to how much food is thought to have been processed (including the use of artificial ingredients and additives). Personalized diets that cater to the individual dietary needs of each person may incorporate functional foods with health claims. Moreover, some individuals report consuming fewer functional items when “natural content” is taken into consideration while making dietary decisions (Gambaro et al., 2021).
Table 5 Level of Food choice in terms of natural content
| Items | Mean | SD | Descriptive Equivalent |
| 1. I eat food that contains natural additives. | 4.08 | 0.28 | High |
| 2. I eat food that contains natural ingredients. | 4.12 | 0.33 | High |
| 3. I eat food that has natural preservatives. | 4.10 | 0.29 | High |
| 4. I eat food that is made of fresh ingredients. | 4.10 | 0.30 | High |
| 5. I eat food that has natural color. | 4.01 | 0.11 | High |
| Average | 4.08 | 0.26 | High |
Summary of Food Choice Motives
Table 6 summarized the food choice motives of students at a local college in Davao del Norte. Convenience emerged as the most important factor, with a very high mean score of 4.33. This was followed by health, which received a high mean score of 4.19. Interestingly, sensory appeal had the lowest mean score (4.03) but still achieved a “high” descriptive equivalent.
Table 6 Summary on the Level of Food Nutrition Literacy
| Indicators | Mean | SD | Descriptive Equivalent |
| 1. 1. Health | 4.19 | 0.19 | High |
| 2. 2. Sensory Appeal | 4.03 | 0.14 | High |
| 3. 3. Convenience | 4.33 | 0.51 | Very High |
| 4. 4. Natural Content | 4.08 | 0.26 | High |
| Average | 4.16 | 0.28 | High |
Food Choices focuses on the elements that influence individual food choices and evaluates the significance of nine potentially associated motivators, some of which are connected to convenience, natural content, health, and sensory appeal (Lopez-Guimera et al., 2023). On the other hand, for some people, emotions such as melancholy, isolation, or depression can suppress their appetite, making it difficult for them to consume the right kinds of nutrients that their bodies need to function properly (Raquel, 2021).
Level of Student’s Eating Behavior in Terms of Uncontrolled Eating
Reflected in Table 7 was the Level of Student’s eating behavior in terms of uncontrolled eating. As shown that item five (5) “I eat a lot when my family and friends treat me food” got the highest mean of 4.40 with the descriptive equivalent of very high. Moreover, item two (2) “I feel the urge to eat at any given time” was found to have the lowest mean of 4.25 with the descriptive equivalent of very high.
Table 7 Level of Food choice motives in terms of uncontrolled eating
| Items | Mean | SD | Descriptive Equivalent |
| 1. I want to eat right away whenever I see the food I like. | 4.34 | 0.59 | Very High |
| 2. I feel the urge to eat at any given time. | 4.25 | 0.69 | Very High |
| 3. I buy and eat more food if I have money. | 4.35 | 0.61 | Very High |
| 4. I become conscious of my diet only when I feel something bad. | 4.33 | 0.61 | Very High |
| 5. I eat a lot when my family or friends treat me food. | 4.40 | 0.58 | Very High |
| Average | 4.33 | 0.61 | Very High |
The result was supported by the study of (Benbaibeche et.al., 2021), which stated the outcome by stating that disordered eating exhibited direct correlations with eating behavior but also had indirect effects through habitual behavior. As a result, the subject of compulsive eating frequently came up in both patient and professional meetings. A person may get complacent and lose control over their eating habits due to a variety of factors, including the availability of tasty meals, having more money, and knowing that their blood sugar is under control (Scaglioni et al., 2020).
Level of Student’s Eating Behavior In Terms Of Restrained Eating
Reflected in Table 8 was the level of Student’s eating behavior in terms of restrained eating. It can be gleaned from the table that the highest mean is item two (2) “I eat small portions to control my blood sugar” which had a 4.33 mean with the descriptive equivalent of very high. Moreover, item five (5) “I am conscious of my diet when my blood sugar is high” got the lowest mean which had a mean of 4.14 with the descriptive equivalent of high. This meant that the student’s eating behavior in terms of restrained eating was much observed. The overall mean was 4.21 with the descriptive equivalent of very high. This meant that the student’s eating behavior in terms of restrained eating was much observed.
The standard deviation of 0.61 in the overall means that the students’ eating behavior in terms of restrained eating was near the mean. Blood sugar targets for people with diabetes are individualized and vary based on age, type of diabetes, duration of disease, life expectancy, other health conditions, and low blood sugar risk/awareness. This meant that the students eat small portions to control their blood sugar and they avoid sweets because it has high sugar content. The combination of foods you eat, and even the order in which they are eaten, can all have an impact on how your body reacts.
Table 8 Level of Student’s eating behavior in terms of restrained eating
| Items | Mean | SD | Descriptive Equivalent |
| 1. I avoid sweets because they have high sugar content. | 4.21 | 0.51 | Very High |
| 2. I eat small portions to control my blood sugar. | 4.33 | 0.63 | Very High |
| 3. It’s easy for me to choose the right food whenever I eat in canteens or fast food. | 4.20 | 0.67 | Very High |
| 4. I take small frequent meals to control my blood sugar. | 4.20 | 0.63 | Very High |
| 5. I am conscious of my diet when my blood sugar is high. | 4.14 | 0.53 | High |
| Average | 4.21 | 0.61 | Very High |
The findings were corroborated by a study by (Benbaibeche et al.,2021), which found that eating behavior and disordered eating both directly and indirectly correlated through habitual behavior. This led to the topic of compulsive eating coming up again and time again in discussions with patients and professionals. An individual’s tendency to overindulge is also measured by their uncontrolled eating.
Level of Student’s Eating Behavior In Terms Of Emotional Eating
Displayed in Table 9 was the level of student’s eating behavior in terms of emotional eating. It can be seen from the table that the highest mean was item two (2) “Whenever I feel happy, I eat the food” with a mean of 4.26. Then followed by item one (1) “When I feel sad, I eat my comfort food” and item three (3) “When I feel stressed, I lose my appetite and eat less” which had both a mean of 4.24 with the descriptive level of very high. Moreover, item four (4) “When I feel alone, I tend to think about what to eat” got the lowest mean which was 4.09 with the descriptive equivalent of high. This meant that the student’s eating behavior in terms of emotional eating was observed. The overall mean was 4.20 with the descriptive equivalence of very high. This meant that the student’s eating behavior in terms of emotional eating was much observed.
The analysis revealed a standard deviation of 0.41 in the overall data. This suggests that, on average, students’ eating behavior about emotional eating remained close to the mean. In other words, when students experience stress, they tended to overeat, potentially using food as a coping mechanism.
Table 9 Level of Student’s eating behavior in terms of emotional eating
| Items | Mean | SD | Descriptive Equivalent |
| 1. When I feel sad, I eat my comfort food. | 4.24 | 0.44 | Very High |
| 2. Whenever I feel happy, I eat the food I like to treat myself. | 4.26 | 0.44 | Very High |
| 3. When I feel stressed, I lose my appetite and eat less. | 4.24 | 0.43 | Very High |
| 4. Whenever I feel alone, I tend to think about what to eat. | 4.09 | 0.33 | High |
| 5. When I’m in the mood I will eat a lot. | 4.17 | 0.40 | High |
| Average | 4.20 | 0.41 | Very High |
A study by, (Van et al.,2021) identified numerous factors that influence emotional eating behavior. Essentially, people with a tendency to emotionally eat may overconsume food in response to unpleasant feelings like worry or irritation.
Level of Student’s Eating Behavior In Terms Of Social Eating
Presented in Table 10 was the level of student’s eating behavior in terms of social eating. As shown in the table, the highest mean was item four (4) “I tend to eat more when I done to my family and friends” which had a 4.25 mean with the descriptive equivalent of very high. This was followed by item two (2) “I need to finish everything in my plate to avoid food waste” which had a mean of 4.23 with a descriptive level of very high. Moreover, item one (1) “I control my appetite whenever I eat with my friends.” got the lowest mean which is 4.09 with the descriptive equivalent of high. The overall mean was 4.18 with the descriptive equivalent of high. This means that the student’s eating behavior in terms of social eating was observed.
The standard deviation of 0.75 in the overall data indicated that students’ social eating behavior was close to the average. This suggested that students had followed their family’s advice regarding a proper diet.
A study by (Dunbar, 2021) lent support to these findings. It revealed that people who frequently shared meals with others reported greater happiness, life satisfaction, trust in others, community involvement, and a larger circle of close, supportive friends. This suggests that social dining may have evolved as a tool to promote social interaction.
Table 10 Level of student’s eating behavior in terms of social eating
| Items | Mean | SD | Descriptive Equivalent |
| 1. I control my appetite whenever I eat with my friends. | 4.09 | 0.32 | High |
| 2. I need to finish everything in my plate to avoid food waste. | 4.23 | 0.46 | Very High |
| 3. I eat the food gifts given by my family and friends. | 4.12 | 0.35 | High |
| 4. I tend to eat more when I dine with my family and relatives. | 4.25 | 0.69 | Very High |
| 5. I follow my family’s advice in adhering to a proper diet. | 4.21 | 0.44 | Very High |
| Average | 4.18 | 0.75 | Very High |
Level of Student’s Eating Behavior In Terms Of Proactive Eating
Table 11 displayed the level of student’s eating behavior in terms of pro-active eating. It can be gleaned from the table that the highest mean was item three (3) “I immediately eat a lot whenever I feel dizzy, or have cold sweats or tremors” which had a 4.26 mean with the descriptive equivalent of very high. This was followed by item one (1)“Eating the way I do gives me a sense of satisfaction” which had a mean of 4.25 with the descriptive equivalent of very high. Moreover, item two (2) “I eat many times a day because I am afraid of developing low blood sugar” got the lowest mean which is 4.08 with the descriptive equivalent of high. The overall mean was 4.16 with the descriptive equivalent of high. This meant that the student’s eating behavior in terms of pro-active eating was observed.
The standard deviation of 0.72 in the overall data indicated that the students’ eating behavior regarding pro-active eating was near the mean. Consequently, this suggests that they felt satisfied when they ate.
Table 11 Level of Student’s eating behavior in terms of proactive eating
| Items | Mean | SD | Descriptive Equivalent |
| 1. Eating the way I do gives me a sense of satisfaction | 4.25 | 0.69 | Very High |
| 2. I eat many times a day because I am afraid of developing low blood sugar. | 4.08 | 0.30 | High |
| 3. I immediately eat a lot whenever I feel dizzy, or have cold sweats or tremors. | 4.26 | 0.45 | Very High |
| 4. I continue to eat a healthy diet, even when I have the desire to overeat or make poor eating choices. | 4.15 | 0.38 | High |
| 5. It is necessary for me to control my food urges in order to control my eating. | 4.09 | 0.32 | High |
| Average | 4.16 | 0.72 | High |
Summary of the Level of Student’s Eating Behavior
Presented in Table 12 was the summary of the summary student’s eating behavior. It can be seen from the table that the overall mean was 4.22 with the descriptive equivalent of very high. This means that the food choice motives of students’ eating behavior in one of the Local public colleges in Davao del Norte were much observed.
Out of all the items, uncontrolled eating got the highest mean of 4.33 which had a descriptive equivalence of very high. This means that the uncontrolled eating behavior of parenting styles in one local college in Davao del Norte was much observed.
On the other hand, pro-active eating got the lowest mean of 4.16 which had a descriptive equivalence of high. Though ranked as the lowest, this also means that pro-active eating behavior among students in one of the Local colleges in Davao del Norte was observed.
Table 12 Level Summary on the level Student’s eating behavior
| Items | Mean | SD | Descriptive Equivalent |
| 1. Uncontrolled Eating | 4.33 | 0.61 | Very High |
| 2. Restrained Eating. | 4.21 | 061 | Very High |
| 3. Emotional Eating | 4.20 | 0.41 | Very High |
| 4. Social Eating. | 4.18 | 0.75 | High |
| 5. Pro-active Eating. | 4.16 | 0.72 | High |
| Average | 4.22 | 0.62 | Very High |
Relationship between Parenting Styles and Student’s Eating Behavior
Table 13 examined the correlation between Food Choice Motives and Students’ eating behavior. It was observed that an overall r-value was 0.106 with a p-value of 0.050. Since the p-value was less than 0.05, the null hypothesis was rejected. This indicated a statistically significant relationship between Food Choice Motives and Students’ eating behavior. In other words, the study conducted in one of the local colleges in Davao del Norte suggested that Food Choice Motives had a positive influence on students’ eating behavior. Therefore, students with stronger food choice motives tend to exhibit higher levels of specific eating behaviors.
Table 13 Relationship between food choice motives and student’s eating behavior
| Variables Correlated | r | p-value | Decision on Ho | Decision on Relationship |
| food choice motives and student’s eating behavior | 0.106 | 0.050 | Rejected | Significant |
Unsurprisingly, creative thinking, a divergent process built on experience and learning, aligned with this finding. A study of (Guine, 2021) confirmed the link between human behavior and food choices. Beyond the core factors driving our eating habits, a wide range of other influences condition what we select. Human eating patterns are shaped by both psychological and sociological variables. Therefore, understanding the diverse psychological and social factors impacting food preferences and eating behaviors is critical. A variety of factors, including convenience, natural content, health, and sensory appeal, could elevate the perceived value of consuming certain foods.
SUMMARY OF FINDINGS, CONCLUSIONS, AND RECOMMENDATIONS
Summary of Findings
- The level of food choice motives had an overall mean of 4.16, a standard deviation of 0.28, with a descriptive equivalent of high, indicating that the level of food choice motives in one of the local colleges in Santo Tomas Davao del Norte was observed.
- The level of students’ eating behavior had an overall mean of 4.22, a standard deviation of 0.62, with a descriptive equivalent of high, indicating that the level of students eating behavior in one of the local colleges in Santo Tomas Davao del Norte was much observed.
- The relationship between food choice motives and students’ eating behavior showed a positive correlation with a p-value of 0.050 which was lower than the level of significant 0.05. The result indicated the rejection of the null hypothesis.
Conclusions
- The level of food choice motives was high. The results of this study showed that food choice motives had a great influence on students’ eating behavior. At a higher level, it is one of the most important factors influencing students’ eating habits. Choosing a healthy diet, such as increasing one’s intake of fruits and vegetables, can gradually enhance one’s physical and mental well-being and could be a long-term investment in their future well-being.
- The level of students’ eating behavior was very high. In general, a solid, reproducible, and trustworthy tool for evaluating eating behaviors in students is culturally acceptable eating behavior. These Filipinos with type 2 diabetes exhibit newly reported eating habits, such as sociable and proactive eating, in addition to well-known eating behaviors including emotional, restricted, and uncontrollable eating. They might help medical professionals and dietitians create customized diet programs. It might be utilized in nations with a cultural environment comparable to the Philippines, where pro-active eating is also observed and social eating is common but also accompanied by a strong fear of hypoglycemia.
- There was a significant relationship between food choice motives and students’ eating behavior. It means, the higher the food choice motives, the higher the students’ eating behavior. The findings indicated a significant correlation between students’ eating habits and their reasons for choosing their food. This relatively strong association implied that a student’s eating behavior was influenced by their family environment or relationships with peers, classmates, and other family members.
Recommendations
- Students were encouraged to recognize the importance of knowing their eating behavior and enhance their food choices. This may increase their comprehension of eating habits and assist them in realizing how food choices affect their eating habits. This initiative may encouraged studies aimed at operationalizing the common aspects of eating behavior that students may enhance by being more conscious of the importance of their decisions. This could help students to maintain their food choices like for example their sensory appeal. Students may choose food that smells nice and boosts their appetite if the food looks mouthwatering.
- The parents were encouraged to continuously monitor and educate their children’s food choices and cultivate in them the practice of moderation in their eating behavior and choice of healthy foods.
- Instructors were encouraged to incorporate the subjects related to working groups to identify points to develop awareness among students related to food choice motives and attitudes towards eating. Instructors should coordinate with the school management to provide seminars, workshops, and orientation related to food choice and eating behavior.
- The researchers were encouraged to investigate the efficacy of current student eating habits in a future study. This investigation would assess how these behaviors could be strengthened and how interventions could be tailored to focus on students’ food choices and overall dietary patterns.
REFERENCES
- Savanur, M. (2022). Eating behavior of college students is very dynamic. College students tend to have erratic eating patterns because of long study hours in college, high workloads, and lack of time. [Google Scholar]
- Chan, L., S. Penckofer, M. Gulanick, B. Velsor‐Friedrich, and F. B. Bryant, (2020)”The relationships among self‐esteem, stress, coping, eating behavior, and depressive mood in adolescents,” Research in nursing & health, vol. 32, pp. 96-109, 2009.
- Deliens T, Clarys P, Van Hecke L, De Bourdeaudhuij I, Deforche B. (2021) Changes in weight and body composition during the first semester at university. A prospective explanatory study. Appetite.;65C:111–116. [PubMed] [Google Scholar]
- Capili, M. (2020). Anthropometric Status and Eating Behavior as Predictors of University Students.Eating Behavior. Vol. No.2, 32-42
- Marta A ., Lusk, J.L.; McCluskey, J. (2020) Understanding the impacts of food consumer choice and food policy outcomes. Appl. Econ. Perspect. Policy 2020, 40, 5–21. [CrossRef]
- Ajzen, I. (1988). Attitudes, personality, and behavior. Chicago: Dorsey Press
- Meyer, Guine, R.P.F.; Correia, P.M.R.; Ferreira, M.; Lima, J.D.(2022) Development of a questionnaire to assesspeople’s food choices determinants. Curr. Nutr. Food Sci.15, 281–295. [CrossRef]
- Seda P., Machado P., Santos T., Sievert K., Backholer K., Hadjikakou M., Russell C., Huse O., Bell C., Scrinis G., et al. (2021) Ultra-processed foods and the nutrition transition: Global, regional and national trends, food systems transformations and political economy drivers. Obes. Rev. 2021;21:e13126. doi: 10.1111/obr.13126. [PubMed] [CrossRef] [Google Scholar]
- Matek M., Marendic, M.; Polic, N., Orsulic, L.; Polasek, O.; Kolcic, I. (2023) Mediterranean Diet Assessment Challenges: Validation of the Croatian Version of the 14-Item Mediterranean Diet Serving Score (MDSS) Questionnaire. PLoS One 2023, 16, e0247269.[CrossRef] [PubMed]
- Steptoe, T.M. Pollard, J. Wardle, (1995). Development of a measure of the motives underlying the selection of food: the food choice questionnaire, Appetite 25 267–284
- Creswell, J. W. (2020). Qualitative inquiry and research design: Choosing among five approaches(3rd ed.). Thousand Oaks, CA: Sage
- McBurney, D. & White, T. (2020). Research Methods. New York, NY: Cengage Learning.
- Klazema, J. C., & Lazarus, R. S. (2021). Comparison of two modes of stress measurement: Daily hassles and uplifts versus major life events. Journal of Behavioural Medicine, 4, 1–39.
- Imtiyaz, H., Soni, P. & Yukongdi, V.: (2021) Role of sensory appeal, nutritional quality, safety, and health determinants on convenience food choice in an academic environment.
- Hena, I., Soni, P., & Vimolwan, Y. (2021). Role of sensory appeal, nutritional quality, safety, and health determinants on convenience food choice in an academic environment. Foods, 10(2), 345.
- Bogard, J., Downs, E. Cassie (2023)Convenience as a dimension of food environments: A systematic scoping review of its definition and measurement., Appetite 194:107198
- Rankin A, Kuznesof S, Frewer L et al. (2021) Public perceptions of personalised nutrition through the lens of Social Cognitive Theory. J Health Psychol 22, 1233–1242
- Gambaro A & Ares G (2021) Influence of gender, age and motives underlying food choice on perceived healthiness and willingness to try functional foods. Appetite 49, 148–158.
- Lopez-Guimera, Dowd K & Burke KJ (2023) The influence of ethical values and food choice motivations on intentions to purchase sustainably sourced foods. Appetite 69, 137–144. [PubMed] [Google Scholar]
- Raquel , Wongprawmas R., Mora C., Pellegrini N., Guiné R.P.F., Carini E., Vittadini E. (2021) Food Choice Determinants and Perceptions of a Healthy Diet among Italian Consumers. Foods. 2021;10:318. doi: 10.3390/foods10020318. [PMC free article] [PubMed] [CrossRef] [Google Scholar]
- Benbaibeche A , Cohen D.A., Farley T.A. (2021) Eating as an Automatic Behavior. Prev. Chronic Dis. 2008;5 doi: 10.3410/f.1101169.557167. [PMC free article] [PubMed] [CrossRef]
- Scaglioni B, Barrett-Connor E, Fowler SE, et al. (2020) Reduction in the incidence of type 2 diabetes with lifestyle intervention or metformin. N Engl J Med. 2002;346:393–403. [PMC free article] [PubMed] [Google Scholar]
- Van S., Kemp E., Bui M., Grier S. (2020) When food is more than nutrition: understanding emotional eating and overconsumption. J Consum Behav. 2020;12(3):204–213. doi: 10.1002/cb.1413. [CrossRef] [Google Scholar]
- Dunbar, R. I. M. (2021). The social role of touch in humans and primates: behavioural function and neurobiological mechanisms. Neuroscience and Biobehavioral Reviews, 34, 260–268
- Guine, R.P.F.; Correia, P.M.R.; Ferreira, M.; Lima, J.D.(2021) Development of a questionnaire to assesspeople’s food choices determinants. Curr. Nutr. Food Sci.15, 281–295. [CrossRef]