
Multilevel Analysis of Student and School Variables Responsible for the Differentials in Mathematics Achievement: Evidence from the TIMMS 2015-Botswana
- Jane Iloanya
- Emmanuel Zhanda
- Asitha Kodippili
- 1150-1163
- Aug 10, 2023
- Social Science
Multilevel Analysis of Student and School Variables Responsible for the Differentials in Mathematics Achievement: Evidence from the TIMMS 2015-Botswana
Jane Iloanya1*, Emmanuel Zhanda2 & Asitha Kodippili3
1Associate Professor, Department of Education, Botho University, Gaborone, Botswana
2Fellow, Faculty of Business and Accounting, Botho University, Maseru, Lesotho
3Associate Professor, Department of Mathematics and Computer Science, Fayetteville State University (FSU), North Carolina, USA
DOI: https://dx.doi.org/10.47772/IJRISS.2023.70791
Received: 21 June 2023; Revised: 07 July 2023; Accepted: 10 July 2023; Published: 10 August 2023
ABSTRACT
Mathematics literacy is essential for all further learning and future careers of students, therefore, the poor performance of Botswana Junior Certificate learners in Mathematics is very concerning. This study adopted an exploratory research design which utilized the TIMSS 2015 data to analyse student and school variables responsible for the differentials in mathematics achievement. TIMSS represents Trends in International Mathematics and Science Study. The socio-economic status of students’ parents, location of schools, and students’ gender in Botswana Junior Certificate students’ mathematics achievement were explored through the Multilevel (Hierarchical) Linear Model (HLM) to predict the mathematics achievement of the students. The data used for this study was derived from that of the tenth grade Botswana students; a total of 5964 (female = 3030, male = 2934) Botswana tenth graders from 159 schools who participated in TIMMS 2015.Based on the findings of the study, recommendations were made on some interventions to help improve students’ self-efficacy and confidence in mathematics.
Keywords: Trends in International Mathematics and Science Study, Mathematics Achievement, Multilevel Effects, Botswana Junior Certificate Students, Socio-Economic Status
INTRODUCTION
The purpose of this study was to analyze the multilevel effects of the location of schools, socio-economic status (SES) of students’ parents, and student gender on Botswana Junior Certificate students’ mathematics achievement. Multilevel modeling was adopted using the Trends in International Mathematics and Science Study (TIMSS) 2015 tenth-grade (Form 3) data. The study was motivated by the fact that mathematics literacy is essential to all further learning and future careers of students, yet the performance of Botswana Junior Certificate learners in Mathematics is quite low. Venson- Moitoi (2014) stated at the official opening of the Mathematics Association of Botswana annual conference that mathematics is fundamental to learning in all aspects of life, adding that it is the foundation of all learning, reasoning, order, and sequence. Nkate (2008) also emphasized that mathematics is seen as the foundation of what is required to be competitive in a global economy. Despite the important role that mathematics plays in society, there has always been poor performance in the subject at national examinations in Botswana.
Table 1 presents an extract of the cumulative percentage of Botswana Junior Certificate candidates at each grade across mathematics and science for 2018 and 2019.
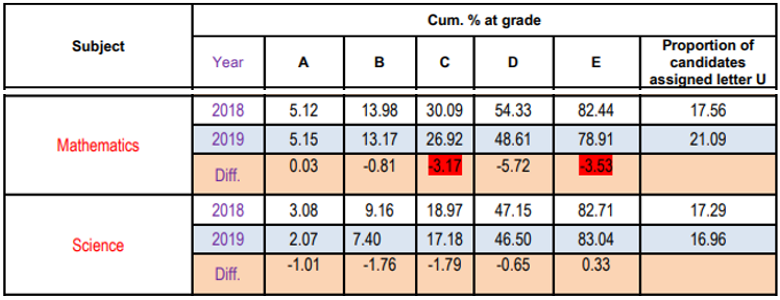
Table 1: Cumulative Percentages of Botswana Junior Certificate Candidates at Grade Achievement for 2018 and 2019 with Differences
Based on table 1 above, a comparative analysis of mathematics performance for 2018 and 2019 denotes that the pass rate was relatively low in all the grades. The same applies to science subjects in the respective years and grades.
Students tend to obtain better grades for Mathematics in the Primary School Leaving Examination (PSLE) than in the Junior Certificate Examination (JCE). Out of all the students who sat for the 2019 PSLE mathematics examinations, 64.24% obtained a Grade of C or better (BEC, 2020). For the 2019 JCE mathematics examinations, only 45.24% obtained a Grade C or better (BEC, 2020). The general low achievement in students’ academic performances at the Junior Secondary School level in Botswana calls for a study to find out what exactly goes wrong at this level, since at the primary school level, students perform relatively better than they do at the JCE level in Botswana. This low academic achievement in mathematics is more prevalent in rural area-based junior secondary schools than in schools in the peri-urban and urban areas.
Despite the efforts being made by the Botswana Government towards ensuring that students in both rural and urban areas have equal educational opportunities to improve their academic performance both internal and external examinations, the observation is that the students in rural areas continue to perform poorly as compared to their counterparts in urban areas (Mareka, 2016).
Another issue of concern is the trend in gender and mathematics performance in Botswana junior secondary schools. Female students tend to perform better in mathematics than their male counterparts at the JCE level (Mareka, 2016). Earlier, it was well known that female students outperformed male students in mathematics at lower primary when the assessment is based more on computational knowledge (Gallagher & Kaufman, 2005). At the JCE level, where the mathematical concepts are spatial, male students performed better than female students (Gallagher & Kaufman, 2005).
Problem Statement
Mathematics is essential in many areas of students’ lives, therefore, the continual drop in the results at the JCE level is a serious concern. Mathematics is a driver of social development because of its widespread application in every sphere of life, particularly in areas of technology, science, economy, business, agriculture, and other social activities. For many years now, the general academic performance and achievements of students in Botswana who sat for the JCE in mathematics have been on the decline. This low achievement as evidenced from some data collected from previous studies shows that the decline is more among the schools based in rural areas than those situated in the urban and peri-urban areas of the country. There has been the issue of whether Botswana Junior Certificate students’ achievements in mathematics is primarily influenced by the location of the school, the socio-economic status of their parents, or the gender of the student. This paper conducts a multilevel analysis of student and school variables responsible for the differentials in mathematics achievement at the Junior Secondary certificate examinations in Botswana using some empirical evidence from the TIMMS 2015 –Botswana analysis of achievement.
Research Objectives
The multilevel analysis of student and school variables responsible for differences in mathematics achievement at the JCE level examinations is driven by the following research objectives –
- To investigate the relationship between Botswana Junior Certificate students’ achievements in mathematics and the location of the schools
- To determine the relationship between Botswana Junior Certificate students’ achievements in mathematics and the socioeconomic status (SES) of their parents
- To find out if gender difference is possibly associated with the Botswana Junior Certificate students’ achievements in mathematics
Research Questions
- What is the relationship between Botswana Junior Certificate students’ achievement in mathematics and the location of the school?
- What is the relationship between Botswana Junior certificate students’ achievement in mathematics and the socio-economic status (SES) of their parents?
- How is gender difference associated with Botswana Junior Certificate students’ achievements in mathematics?
Hypotheses
- H0: Junior Certificate students’ achievement scores in mathematics differ across schools in Botswana according to location.
- H1: Junior Certificate students’ achievement scores in mathematics do not differ across schools in Botswana according to location.
- H0: There is a relationship between Botswana Junior Certificate students’ achievement in mathematics and the socio-economic status of their parents.
- H1: There is no relationship between Botswana Junior Certificate students’ achievement in mathematics and the socio-economic status of their parents.
- H0: Gender is associated with Botswana Junior Certificate students’ achievements in mathematics.
- H1: Gender is not associated with Botswana Junior Certificate students’ achievements in mathematics.
LITERATURE REVIEW
Student achievement is affected by many factors from different sources such as personal, home, community, and school factors (Akyüz, 2014). A multilevel modeling study using the Trends in International Mathematics and Science Study (TIMSS) in 2011 for eighth grade in Turkey, Singapore, the USA, and Finland provides some insights into multilevel effects on students’ performance in mathematics.
The results showed that the TIMSS 2011 mathematics scores of eighth-grade students were positively affected by self-confidence in mathematics, home educational resources at the student level, and school composition by students’ economic background at the school level in all countries in the study.
Empirical evidence has shown that students’ background characteristics (e.g., gender and socio -economic status) are significantly related to their academic achievement. The home background and socio-economic status of the students have been attributed to students’ academic performance (Moloko-Mphale & Mhlauli, 2014). Yinusa & Basil (2008) suggest that the student’s home background influences academic and educational success, while socioeconomic status reinforces the activities and functioning of the teachers and students. Gender differences in the mathematic achievement of high school students have not reached a consistent conclusion so far (Hyde, 1990). Most studies have concluded that boys generally perform better in mathematics tests than girls, but some also show that gender differences in mathematics achievement either do not exist or favour female students (Catsambis, 1994).
Studies have also highlighted that learning strategies have a significant correlation with students’ academic achievements (Zimmerman, 1990; Pokay & Blumenfeld, 1990). Moreover, findings have also shown that learning self-efficacy and academic achievement are closely interrelated (McInerney, Cheng, Mok and Lam, 2012; Lent, Brown and Larkin, 1984). However, it is a paradox in that equally able students, students in high-ability schools or classes have a lower level of learning self-efficacy than those in lower-ability schools or classes, so are likely to experience a decline in academic achievement (Marsh & Hau, 2003; Marsh & O’Mara, 2010). This assertion could have some bearing on the achievement level of JCE students in mathematics because mathematics as a subject requires passion, determination, and learning strategies that could demand a student’s high determination to persevere and keep working to achieve. At the junior secondary school level, some students do not possess that spirit of perseverance and a high level of determination to succeed. Some try and give up easily, hence the resultant effect on academic achievement in mathematics which could be very low and discouraging.
In the study carried out in Pakistan on the analysis of secondary school students’ achievements in the geometrical aspect of mathematics by Akhter & Usman (2018), it was concluded that students’ background characteristics such as gender and locality also contribute to students’ academic achievements in mathematics though not with a high margin. The study showed that girls did better than their male counterparts in geometry while the students in the urban areas did better than those in the rural areas. Concerning the effect of locality on the learning achievements of students in geometry, it is a fact that students in urban areas have facilities about school location factors and the quality of teachers teaching the students, which ultimately contribute to the students’ achievement levels in mathematics. In this case, urban students end up achieving better results in mathematics than students in secondary schools which are situated in rural areas. The assumption is that most teachers who are very good and knowledgeable would prefer to reside in urban areas where there are modern facilities that will help them to facilitate teaching and learning processes more effectively and productively.
Chui and Xihusa (2008) also explored the effect of the availability of adequate books, the number of siblings in the family, and the high socio-economic status of students in mathematics achievement among secondary school students. The findings showed that students with better facilities performed better in mathematics due to their socio–economic status more than other students who do not have equal access to such facilities. In a study carried out by Erdogon ,Baloglu and Kesici (2011) on the effect of gender on students’ academic achievement in mathematics, their findings revealed that girls are better than boys in geometry. Maliki, Ngban &Ibu (2009) in a study carried out in Nigeria on the analysis of student’s performance in junior secondary school mathematics, examined the influence of gender, school location, and school type on the academic achievement of secondary school students in mathematics.
The findings showed that in the 2006 junior secondary school exam, male students performed better than their female counterparts in mathematics. The same study also revealed that students from rural area secondary schools performed better than those from urban areas, while those from private secondary schools performed better than those from public schools. Looking at the different studies discussed above, it could be concluded that different factors from different environmental locations and circumstances could play some major role in influencing and determining secondary school students’ academic achievements in mathematics.
METHOD
This study is an exploratory study that utilized the TIMSS 2015 data. Different factors at student and school levels were explored through the Multilevel (Hierarchical) Linear Model (HLM) to predict mathematics achievement. This study used the data for tenth-grade students from the Trends in International Mathematics and Science Study (TIMSS) 2015 assessment, one of the largest international comparative studies of mathematics and science achievement to date. TIMSS is an international database that has been collected by the International Association for the Evaluation of Educational Achievement (IEA) every four years since 1995 and is designed to reveal trends in the mathematics and science achievement of students. TIMSS 2015 is the sixth and most recent one in the series. In addition to measuring the mathematics and science achievement of fourth- and eighth-grade students, TIMSS 2015 collected information from students, teachers, and school principals about mathematics and science curricula, instruction, home contexts, and school characteristics and policies in more than 60 countries around the world.
RESULTS
Multilevel (Hierarchical) Linear Model
Hierarchical Linear Model (HLM) is a complex form of Ordinary Least Squares (OLS) regression that is used to analyze variance in the outcome variable when the predictor variables are at varying hierarchical levels; for example, a model of student performance that contains measures for individual students, as well as measure for schools within which the students are grouped.
The researchers explained the model with two level-1 predictor variables and one level-2 predictor variables since the analysis used two level-1 predictor variables student home SES (centered around over all mean SES) and Student-Gender, and one level-2 predictor variable (school location).
Unconditional Mean Model (Assume no covariates for both student and school level)
The unconditional mean model facilitates examining variation in outcome variables (mathematics achievement score) across level-2 units (schools).
Level 1 (student level): ![]()
Level 2 (school level): ![]()
This gives the combine model: ![]()
Where:

Level-1 and level-2 errors ( eij and u0j ) follow normal distributions with mean 0 and variance σ2 and r02 , respectively. σ2 is known as the within-group variance and r02 is known as between group variance. The ratio of the between-group variation to the total variance ![]() is defined as the intra-class correlation (ICC or ρ ). Statistically significant ICC value justifies the use of HLM to find the effect of level-1 variables.
is defined as the intra-class correlation (ICC or ρ ). Statistically significant ICC value justifies the use of HLM to find the effect of level-1 variables.
HLM (with two-level predictors and one level-2 predictor)

In the context of our analysis, level-1 and level-2 variables are defined as follows:

This model assumed not only that student achievement score is related to student-level predictors, but also that the relationship between student-level predictor (SES) and achievement scores can vary across schools.
Latent Class Analysis
Latent Class Analysis (LCA) introduced by Lazarsfeld (1950) is a statistical method to identify unobserved (latent) sub-populations of individuals based on their observed values on a set of categorical or nominal indicators in cross-sectional data.
LCA uses maximum likelihood estimation to fit a hypothesized model in which membership in each number of latent classes is related to performance on the included indicators and to produce fitted probabilities of class membership for individuals. The researchers estimate the class membership probabilities (i.e., the probability of an individual’s membership in a certain class) and the item response probabilities conditional upon class membership (i.e., the probability for an individual to provide a certain response to a specific item given that she or he has been classified in a specific latent class). According to the item response probabilities, observations are grouped into classes.
Finding the optimal number of latent classes follows a stepwise process that combines the statistical model fitting indicators Akaike Information Criterion (AIC), Bayesian information criterion (BIC), and model usefulness indicators such as Interpretability of the Classes (IC).
Data Description (study variables)
The data for this study is drawn from the Third International Mathematics and Science (TIMMS) database https://timssandpirls.bc.edu/timss2015/international-database/. The database comprises student achievement results in mathematics and science as well as student, teacher, school, and curricular background questionnaire data for the 39 countries that participated in TIMMS 2015 in the eighth grade and 47 countries in the fourth grade. The data for this study is the tenth grade Botswana students; a total of 5964 (female = 3030, male = 2934) Botswana tenth graders from 159 schools participated in TIMMS 2015.
TIMSS employs a two-stage random sample design, with a sample of schools drawn as a first stage and one or more classes of students selected from each of the sampled schools as a second stage. https://timssandpirls.bc.edu/publications/timss/2015-methods/chapter-3.html
The mathematics assessment framework for TIMSS is organized around two dimensions; a content dimension and a cognitive dimension (I.V.S. Mullis, M.O. Martin, TIMSS 2015 assessment frameworks, Lynch School of Education, Boston College, Chestnut Hill, MA). There were four content domains: number, algebra, geometry, and data, and three cognitive domains: knowing, applying, and reasoning. TIMSS assesses the ability of the whole student body based on many assessment items. However, to keep the individual student burden to a minimum, it administered a limited number of assessment items to each student. As a result, student scores are transformed using Item Response Theory (IRT) into 5-plausible values to characterize student participation in assessment, given their background characteristics. Plausible values represent what the performance of an individual on the entire assessment might have been, had it been observed.
The student mathematics achievement (5-plausible values) was used, and appropriate sampling weights were provided in the data set together with the following student survey questions about student home possessions; computer tablet owned, computer tablet shared, study desk, own room, internet connection, own mobile phone, gaming system, electricity, running water, and television, and student-gender and the survey question about school location; Urban, Suburban, Medium City or Large Town, Small Town or Village, and Remote Rural in school background survey in the statistical analysis.
Socio-Economic Status Operational Definition
Socio-Economic Status (SES) is typically defined as the relative position of an individual or family within a hierarchical social structure, based on their access to, or control over wealth, prestige, and power (Willms & Tramonte, 2019). SES indexes are traditionally obtained through measures characterizing parental educational levels, parental occupation, and home possessions (Hoff & Laursen, 2019). There is, however, no consensus on how to measure SES in a standard manner, because various definitions and operational procedures coexist (Oakes & Rossi, 2003). Mostly, data availability determines the operational definition of SES. The TIMMS student survey questionnaire contains the following 7 questions and 3 country-specific questions about student home possessions; Computer Tablet Owned, Computer Tablet Shared, Study Desk, Own room, Internet connection, Own mobile phone, gaming system, Electricity, Running water, and Television. The last 3-questions are specific to Botswana. Each variable is dichotomous variable value 1 depicting a positive response. Table 2 shows the assets (home-possessions) frequency among students based on answers to survey questions.
Table 2: Assets (home possess) frequency among students.
| Assets | Frequency | Percentage |
| Computer Tablet Owned | 1014 | 14.1 |
| Computer Tablet Shared | 2545 | 41.3 |
| Study Desk | 3713 | 61.7 |
| Own Room | 3346 | 54.6 |
| Internet Connection | 2121 | 33.6 |
| Own Mobile Phone | 3560 | 59.5 |
| Gaming System | 1558 | 24.3 |
| Electricity | 4377 | 73.7 |
| Running Water | 4051 | 67.7 |
| Television | 4678 | 79.4 |
These questions about family possessions are the indicator variables for the student’s home socio-economic status. Therefore, the researchers used latent class analysis with 10 home possession-related indicators to extract student latent class membership in the latent variable student home-SES.
The R-package POLCA in the latent class analysis was used. Based on the smallest Bayesian information criterion (BIC) value, the researchers found 6-classes as the preferred model. The class probabilities of the 6-class model are shown in Table 3. The sum or the mean of the conditional probabilities in each class can be used to recognize the student’s home-SES class. The classes were labeled as Poorest, Poor, Lower-middle, Upper-middle, Rich and Richest based on those mean values 0.1579, 0.4073, 0.4578, 0.6064, 0.7191 and 0.8827 respectively. Class membership share indicates the probability of a student belonging to a certain class. Therefore, 17.5%, 8.6%, 24.3% 13.2%, 30.4% and 5.7% of the students belong to Poorest, Poor, Lowe-middle, Upper-middle Rich and Richest, SES classes respectively.
Table 3: Latent Classes with class membership shares and conditional item response probabilities.
| Poorest | Poor | Lower-middle | Upper-middle | Rich | Richest | |
| Class membership share | 17.5% | 8.6% | 24.3% | 13.2% | 30.4% | 5.7% |
| Computer Tablet Own | 0.0429 | 0.0974 | 0.0148 | 0.1837 | 0.2323 | 0.656 |
| Computer Tablet Shared | 0.0864 | 0.2849 | 0.1857 | 0.7112 | 0.6719 | 0.7313 |
| Study Desk | 0.335 | 0.7926 | 0.5828 | 0.6441 | 0.7615 | 0.8467 |
| Own Room | 0.2309 | 0.6295 | 0.463 | 0.0968 | 0.9795 | 0.9383 |
| Internet Connection | 0.027 | 0.2277 | 0.0907 | 0.6322 | 0.5186 | 0.9262 |
| Own Mobile Phone | 0.2461 | 0.6339 | 0.4262 | 0.6657 | 0.8528 | 0.9311 |
| Gaming System | 0.0366 | 0.2377 | 0.059 | 0.328 | 0.3748 | 0.8254 |
| Electricity | 0.1187 | 0.1429 | 1 | 0.9657 | 0.9852 | 0.9942 |
| Running Water | 0.2331 | 0.5893 | 0.7562 | 0.8635 | 0.815 | 1 |
| Television | 0.2218 | 0.4367 | 1 | 0.973 | 0.999 | 0.9774 |
| Mean | 0.1579 | 0.4073 | 0.4578 | 0.6064 | 0.7191 | 0.8827 |
Exploratory Data Analysis
The bar chart in Figure 1 shows the distribution of the student population in the sample concerning SES and Gender.
The bar chart in Figure 2, shows the distribution of student population in the sample for SES and School location. Every location consists of students from each SES level. However, a high proportion of lower middle, poor, and poorest students are concentrated in small towns and remote rural areas.
The boxplots in Figure 3 show the mathematics achievement score (1st -plausible value) for each SES class. The average achievement score is increasing as you move from poorest to richest. However, there is a significant overlap in achievement scores ….
The boxplots in Figure 4 show the mathematics achievement score (1st -plausible value) for school locations. There is a somewhat different average level with a significant overlap in scores.
The boxplots in Figure 5 show the mathematics achievement score (1st -plausible value) with respect to gender.

Figure 1: Distribution of Students with respect to SES and Gender

Figure 2: Distribution of students with respect to SES and School Location.

Figure 3: Student math-achievement score in each SES class.

Figure 4: Student math-achievement score with respect to school location
1
Figure 5: Student math-achievement score with respect to Gender
Multilevel Analysis – Results
Research Question 1: What is the relationship between Botswana Junior Certificate students’ achievement in mathematics and the location of the school?
Table 4: Results of the Null model
| Fixed Effects | Estimate | St. Error | T-stat | P-value |
| Intercept: Y00 | 394.4 | 2.14 | 184.8 | < 0.0001 |
| Variance Components | ||||
| Residual (eij): σ2 | 5345 | 43.8 | 122.1 | < 0.0001 |
| Intercept (uoj): T02 | 1805.9 | 309.5 | 5.83 | < 0.0001 |
Unconditional mean model results implied that the population of student achievement scores yij has an estimated mean 394.4 and standard deviation ![]() and population of school means βoj has an estimated mean 394.4 and standard deviation of
and population of school means βoj has an estimated mean 394.4 and standard deviation of ![]() . The interclass correlation .252 is statistically significant, p-value (< 0.05). Therefore, the null hypothesis that there is no difference in achievement scores across the schools is rejected. This significantly large inter-class correlation justifies the use of multilevel modeling in our statistical analysis. Also, a large value of ρ means, there are a lot of differences between schools so the school a student belongs to has a significant effect on student achievement score. We can interpret 0.252 as the correlation between the achievement scores for two randomly selected students in the same school. However, there is more variation in achievement scores within the schools (5345.3) than among different schools (1805.9).]
. The interclass correlation .252 is statistically significant, p-value (< 0.05). Therefore, the null hypothesis that there is no difference in achievement scores across the schools is rejected. This significantly large inter-class correlation justifies the use of multilevel modeling in our statistical analysis. Also, a large value of ρ means, there are a lot of differences between schools so the school a student belongs to has a significant effect on student achievement score. We can interpret 0.252 as the correlation between the achievement scores for two randomly selected students in the same school. However, there is more variation in achievement scores within the schools (5345.3) than among different schools (1805.9).]
Research Questions 2&3: SES and Gender related to mathematics achievement?
Table 5: Results of the model with student-level variable SES

To access the effect of student-level predictors (SES, Gender), the data was added sequentially. Table 5 shows the results of the multilevel model with student-level variable SES. The fixed effect of SES is 13.70 and statistically significant. The estimate of the variance component of SES is 31.6 with a p-value 0.007, hence, the null hypothesis that the slope of SES does not vary across schools is rejected. Next, the student-level variable Gender was added to the multilevel model and it was found that Gender does not vary across schools. Since Gender has the same effect on the mathematics achievement of all students across the schools, the model with two student-level predictors SES & Gender with random intercept and random SES slope was adopted. The results are shown in Table 6; the fixed effect of both SES (Y10= 14.20) and Gender (Y20= -18.27) are statistically significant, also, the variance components of both intercept (p-value < 0.0001) and SES slope (p-value = 0.0065) are statistically significant.
Table 6: Results of the model with student level variables; SES and Gender

To find the effect of school location, the researchers created 4-dummy variables; Suburban, Medium City or Large Town, Small Town or Village, and Remote Rural making Urban the reference location. Considering the multilevel model with interactions (SES & Location) and (Gender and Location) it was found that none of the interactions are statistically significant. Therefore, the researchers settled with the multilevel model without interaction in student-level variables and school location. The results of the multilevel model with student and school-level variables without interaction are given in Table 7.
Table 7: Results for the model with two student variables and one school variable

School locations in Suburban (p-value = 0.42) and Medium City or Large Towns (p-value = 0.85) are not statistically significant. That means, given SES value and Gender, on average, students’ achievement in mathematics in suburban or Medium City or Large Town schools is not different from those of Urban schools. However, school locations in Small towns or villages (– 19.76) and Remote Rural (- 37.62) are statistically significant. That means, controlling SES and Gender, on average; students in a Small Town or Village school score 19.76 points below that of an Urban school; students in a Remote Rural score 37.62 points below that of Urban schools.
Also, it could be seen that SES and gender do have significant effects on students’ mathematics achievement scores. The fixed estimate for Sex (Y20= -17.7) means, on average, male students’ achievement score is 17.7 less than that of female students (the baseline group, Sex = 0), holding SES and school location constant.
The meaning of fixed estimate for SES (Y10= 11.6) is a little different because the SES slope varies across schools. Figure 6 shows that schools with above-average intercepts have steeper slopes. ….
The fixed estimate for SES (Y10= 11.6) can be explained as follows: consider two students identical in gender going to schools in identical locations having the same average SES slope, then the student with one unit higher SES value on the average score 11.6 higher than the other student.

Figure 6: Intercepts vs SES-Slope plot based on 1st plausible value
On average, female students in the richest socioeconomic group going to urban schools have the highest mathematics achievement score, and male students in the poorest socioeconomic group going to remote schools have the lowest mathematics achievement score. On average, this difference can be as big as (37.62: urban – remote), (17.7, female – male), (SES: 5*11.6 = 58) 113.32 points.
CONCLUSIONS AND RECOMMENDATIONS
Mathematics is one of the essential subjects in schools which plays a pivotal role in determining students’ career choices and success. A good academic performance in mathematics, therefore, signals the beginning of that successful career envisaged by anyone who wishes to pursue a career in any science and math-based disciplines. This study adopted an exploratory research approach to analyse the multilevel of students’ and schools’ variables responsible for differences in mathematics achievements in secondary school students, using evidence from the TIMSS 201’5 –Botswana data. TIMMS represents –Trends in International Mathematics and Science Study. The analysis aimed to examine the impact of the Socioeconomic status of students’ parents, location of schools, and gender on Botswana Junior Certificate Students’ mathematics. The results of the analysis which were obtained using a multilevel Hierarchical Linear Model (HLM) revealed that the performance of Botswana Junior Certificate students in mathematics was positively influenced by their self-confidence in mathematics, students’ socio-economic background, the educational resources available to the students at home and students’ gender. The study, therefore, recommends some interventions to help improve students’ self–efficacy and confidence in mathematics, effective utilization of mathematics teachers’ feedback, and the use of academic advisers and mentors to guide and propel students’ progress in mathematics.
REFERENCES
- Akhter, N., & Usmani, A. A. (2018). Analysis of Secondary School Students’ Achievements in Geometrical Part of Mathematics. Journal of Educational Research, 21(2), 147-163.
- Akyüz, G. (2014). The effects of student and school factors on mathematics achievement in TIMSS 2011.
- Botswana Examination Council. (2014). Junior certificate examination results publication report. Retrieved from http://www.bec.co.bw/results/results-summary.
- Catsambis, S. (1994). The path to math: Gender and racial-ethnic differences in mathematics participation from middle school to high school. Sociology of Education, (67)199–215
- Chui, M. & Xihua,Z.(2008).Family and Motivation Effects on Mathematics Achievements: Analysis of Students in 41 Countries. Learning and Instruction,18(4) 321- 336.
- Erdoğan, A., Baloğlu, M., & Kesici, Ş. (2011). Gender differences in geometry and mathematics achievement and self-efficacy beliefs in geometry. Eurasian Journal of Educational Research, 43, 91-106.
- Gallagher, A. M., & Kaufman, J. C. (2005). Gender Differences in Mathematics: What We Know and What We Need to Know. Cambridge University Press.
- Hoff, E., & Laursen, B. (2019). Socioeconomic status and parenting In Bornstein MH (Ed.), Handbook of parenting. Vol. 2. Biology and ecology of parenting (pp. 421–447).
- Hyde, J. S., Fennema, E., & Lamon, S. J. (1990). Gender differences in mathematics performance: a meta-analysis. Psychological bulletin, 107(2), 129-139.
- Lazarsfeld, P. F. (1950). The obligations of the 1950 pollster to the 1984 historian. Public Opinion Quarterly, 14(4), 617-638.
- Lent, R. W., Brown, S. D., & Larkin, K. C. (1984). Relation of self-efficacy expectations to academic achievement and persistence. Journal of counseling psychology, 31(3), 356-356.
- Maliki, A. E., Ngban, A. N., & Ibu, J. E. (2009). Analysis of students’ performance in junior secondary school mathematics examination in Bayelsa State of Nigeria. Studies on Home and Community Science, 3(2), 131-134.
- Mareka, G. (2016). Comparative analysis of the predictive validity of Botswana 2012 and 2013 JCE results using 2009 and 2010 PSLE grades in mathematics.
- Marsh, H.W & Hau. K.T. (2003). Big-Fish-Little-Pond effect on academic self-concept: A cross-cultural (26-country) test of the negative effects of academically selective schools. Pedagogy of Psychology, (58) 364-371.
- Marsh, H.W & O’Mara, A.J. (2010). Long-term total negative effects of school-average ability on diverse educational outcomes: Direct and indirect effects of the big-fish-little-pond effect. Pedagogy of Psychology. (24)51–72.
- McInerney, D. M., Cheng, R. W. Y., Mok, M. M. C., & Lam, A. K. H. (2012). Academic self-concept and learning strategies: Direction of effect on student academic achievement. Journal of Advanced Academics, 23(3), 249-269.
- Mphale, L. M., & Mhlauli, M. B. (2014). An Investigation on students’ academic performance for junior secondary schools in Botswana. European Journal of Educational Research, 3(3), 111-127.
- Oakes, J. M., & Rossi, P. H. (2003). The measurement of SES in health research: current practice and steps toward a new approach. Social science & medicine, 56(4), 769-784.
- Pokay, P., & Blumenfeld, P. C. (1990). Predicting achievement early and late in the semester: The role of motivation and use of learning strategies. Journal of educational psychology, 82(1), 41-50.
- Venson-Moitoi, P. (2014, May 15). Mathematics and science vital to development. Botswana Daily News, 2.
- Willms, J. D., & Tramonte, L. (2019). The measurement and use of socioeconomic status in educational research. The SAGE handbook of comparative studies in education, 289-304.
- Yinusa, M. A., & Basil, A. O. (2008). Socio-economic factors influencing students’ academic performance in Nigeria: Some explanation from a local survey. Pakistan Journal of Social Sciences, 5(4), 319-323.
- Zimmerman, B. J. (1990). Self-regulated learning and academic achievement: An overview. Educational psychologist, 25(1), 3-17.