
Relationship of Mainstream Traffic Operating Speed Towards Percentage of Heavy Vehicle During Entering and Exiting Meru Tunnel: A Case Study Meru-Menora Tunnel
- Muhammad Nazirul Syahmi Norzali
- Muhammad Akram Adnan
- Norliana Sulaiman
- Tuan Badrol Hisham Tuan Besar
- 178-191
- Mar 28, 2024
- Education
Relationship of Mainstream Traffic Operating Speed Towards Percentage of Heavy Vehicle During Entering and Exiting Meru Tunnel: A Case Study Meru-Menora Tunnel
Muhammad Nazirul Syahmi Norzali1, Muhammad Akram Adnan2, Norliana Sulaiman3, Tuan Badrol Hisham Tuan Besar4
1Selia Selenggara Selatan Sdn Bhd, Ayer Keroh, Melaka, Malaysia
2,3School of Civil Engineering, College of Engineering, Universiti Teknologi MARA, Shah Alam, Selangor, Malaysia
4Faculty of Business Management, UiTM Cawangan Selangor
DOI: https://dx.doi.org/10.47772/IJRISS.2024.803013
Received: 05 February 2024; Revised: 20 February 2024; Accepted: 25 February 2024; Published: 28 March 2024
ABSTRACT
This study was conducted to compare the 85th percentile or can be known as operating speed of entering and exiting the Meru Tunnel with the presence of heavy vehicle. The study focusses on the effect of percentage of heavy vehicle in the mainstream traffic towards the behaviour and speed on the surrounding vehicle. The case study location was located at Meru-Menora Tunnel, Perak on the southbound which is a two-lane highway with a design standard of mountainous terrain rural expressway R6 by using the radar and laser gun for the spot speed study analysis. The study recorded the spot speed study data with the classification of each vehicle for further analysis at four different location which is at 50 m approaching Meru Tunnel, entering Meru Tunnel, exiting Meru Tunnel, and 50 m leaving Meru Tunnel. The obtained data was analysed by using statistical software called Minitab 21 and Microsoft Excel software. From the analysis, regression analysis was done for Time Mean Speed exiting Meru Tunnel for each lane which is lane 1 and lane 2. Two regression model was produced from the Minitab software which shows the relationship of percentage of heavy vehicle towards the entering and exiting traffic speed from Meru Tunnel. The results show that with presence of higher percentage of heavy vehicle in the mainstream traffic, the overall traffic speed was reduced during entering and exiting Meru Tunnel. The study also shows the effect of tunnelling towards the surrounding traffic speed where road tunnels reduce the speed of traffic due to the confine space in the tunnel and a limited vision in the tunnel affecting the driving behaviour of the traffic.
Keywords: operating speed, heavy vehicle, tunnel, statistical analysis, regression analysis.
INTRODUCTION
According to Moridpour et al., (2014), the presence of heavy vehicle in the mainstream traffic gives a greater impact compared to passenger cars in a macroscopic and microscopic aspects because of the high potential of interference causes from the heavy vehicles towards surrounding vehicles. The presence of heavy vehicles in the mainstream although with only a small percentage may affect the traffic flow negatively during higher traffic volume. The study stated that heavy vehicle may causes physical and psychological effects towards surrounding vehicles where the physical characteristics of heavy vehicles such as length, size, and loads combine with the operational characteristics such as the acceleration, deceleration, and manoeuvrability give negative impact to traffic especially during heavy traffic area. Although the percentage of heavy vehicles increases on highway and expressway, there are still not many attentions being taken seriously into this matter which resulting in more passenger experience psychological disadvantages because of the operational capabilities of heavy vehicles in terms of speed, acceleration, and deceleration. The study stated that the passenger vehicle tries to avoid being in the vicinity of heavy vehicles and try to give a large gap in between the heavy vehicles ahead. The lane changing behaviour of passenger vehicles increases due to the presence of heavy vehicle in the mainstream due to the physical and operational characteristic of heavy vehicles. A large amount of lane changing behaviour may also increase the number of potential accidents which can affect the overall safety of traffic condition. The case study at Meru-Menora Tunnel with the title of ‘Relationship of Mainstream Traffic Operating Speed Towards Percentage of Heavy Vehicle During Entering and Exiting Terowong Meru’ was conducted to study the entering and exiting speed changes of passenger vehicles with the presence of heavy vehicles in the mainstream traffic. The study was conducted on the South Bound which is at Meru Tunnel for four different location such as 50m before approaching the tunnel, entering the tunnel, exiting the tunnel, and 50m after exiting the tunnel. The study was conducted by using radar guns and laser guns to capture the vehicle speed during the time of study to obtain the spot speed data for analysis. The vehicle classification also was recorded to allow the study of heavy vehicles in the mainstream which affected the mainstream traffic speed. The data was collected within 5 minutes interval from 12.30 p.m. until 1.50 p.m. The vehicle classification system used for this study are from Road Traffic Volume criteria established by the Highway Planning Division of the Ministry Works which consists of six categories from passenger car to motorcycle. Figure 1 shows a team at 50m before entering the Meru Tunnel site for data collection process.
PROBLEM STATEMENT
Road tunnels have lower crash rates compared to surface roads. (Yeung and Wong, 2014) However, traffic accidents in road tunnels are of great concern due to their potential for catastrophic outcomes. According to Nussbaumer, (2007), a study found fatality rates to be more than double in bi-directional tunnels as compared to unidirectional tunnels, due to a higher risk of head-on collisions with vehicles from opposing directions. Fortunately, for practical reasons urban road tunnels carry unidirectional traffic in each tube, thus greatly reducing the possibility of head-on collisions. The presence of higher number of heavy vehicles in the mainstream traffic affecting the mainstream speed during entering and exiting Meru Tunnel. The higher percentage of heavy vehicle not only affecting the speed of surrounding traffic but also increase the risk of accidents due to physical and operational characteristics such as the length, size, acceleration rate of heavy vehicle, and deceleration rate of heavy vehicle. The presence of heavy vehicle in the mainstream also limits the vision of passenger vehicle that following the heavy vehicle and affecting the psychological aspect of the surrounding drivers.
OBJECTIVE
- To identify the Time Mean Speed entering Meru Tunnel with the presence of heavy vehicle in the mainstream.
- To identify the Time Mean Speed exiting Meru Tunnel with the presence of heavy vehicle in the mainstream.
SCOPE OF WORK
The data collection process was conducted at two different sessions and at four different locations during daytime on 16 December 2023. The first session was in the morning from 12.30 pm – 1.30 pm. The second session was from 1.35 pm – 2.35 pm but due to unexpected heavy rainfall, the study had to stop at 1.50 pm. The data was collected in the interval of 5 minutes. The four location consists of four team which is for 50 m approaching Meru Tunnel, Entering Meru Tunnel, 50 m leaving Meru Tunnel, and Exiting Meru Tunnel. Each team was equipped with radar gun and laser gun for data collection processes. The collected data was used to analyze the relationship of mainstream traffic operating speed towards percentage of heavy vehicle during entering and exiting Meru Tunnel. The data obtained from the study then was analysed by using statistical software which is Minitab 21 version and Microsoft Excel software.
LITERATURE REVIEW
Behaviour of Traffic Towards the Presence of Heavy Vehicles in the Mainstream Traffic
According to Moridpour et al., (2014), the physical characteristics of heavy vehicles such as the length and size may causes physical and psychological effects on surrounding traffic. A study was done between heavy vehicles and passenger vehicles to determine the effect of heavy vehicles towards surrounding traffic. The study was done by classifying the heavy vehicles into two classes based on length which is heavy vehicles with length equal or more than 15 m as heavy trucks and heavy vehicles with length less than 15 m light trucks. From the study, the relationship between front and rear space gaps and relative speed with the presence of heavy vehicles towards surrounding traffic. The study shows the front space gaps of heavy trucks are larger than light trucks and passenger vehicle because due to the limited speed and manoeuvrability of heavy trucks. The larger space gaps happened due to the heavy truck driver’s safety precaution where the drivers tend to keep larger distance to their front vehicle to allow some space and time for the driver to slow down or break in emergency. This is also due to the deceleration capabilities of heavy trucks due to higher loads which causes a higher amount of inertia produced from the heavy trucks. The rear space gap of heavy trucks also shows a larger space compared to others vehicle due to the safety concerns of passenger vehicles during following or speeding on the rear of heavy trucks and also due to limited vision of passenger’s vehicle during following heavy vehicles which interfere the decision making of passenger vehicle to act accordingly. Next, the study also stated that the speed of heavy trucks are lower compare to the speed of passenger vehicle the front or rear due to the operational limitation of heavy vehicle such as the acceleration, deceleration, and manoeuvrability which makes it hard for the heavy trucks to adjust their speed according to the speed of other passenger vehicle on the front. Heavy trucks may be difficult to adjust their speed according to the surrounding vehicle which makes the majority of heavy trucks drive at a constant speed compare passenger vehicles which usually adjust their speed according to the speed of surrounding vehicles. Heavy trucks influence the surrounding traffic characteristic due to the large space gaps between heavy trucks and passenger vehicles and the slower operational speed of heavy trucks compare to the surrounding vehicles which affect the overall traffic performance when the percentage of heavy vehicle increases.
Driving Behaviour in Road Tunnels
A study of driving experiment by using driving simulator at CRISS laboratory was conducted by Calvi et al. (2012), which study the effect of road tunnelling towards driving behaviour. From the study, it was found that the road tunnelling did affect the driving behaviour which the driving speed of vehicle entering the tunnel decreases compared to driving behaviour on open terrain without tunnelling. The study also stated that vehicle lateral position in the tunnel moves away from the tunnel walls due to the confine space in the tunnel. The study also stated that the vehicles in the tunnel experience discomfort during driving in the tunnel due to the limited space available and limited vision compared to open terrain roadways which can be one of the main reasons that may contribute to accidents. There are many other studies that have been done such as by Shimojo et al. (1995) which uses driving simulator to study the relationship between tunnel cross section and information signages that indicates the remaining tunnel length. Hirata et al. (2006) studied about the safety awareness of the drivers in the tunnel when they are being informed there is an accident occurred in the tunnel. Törnros (2000) analysed the effects of several tunnel wall patterns on simulated driving behaviour. Although no significant effect of wall pattern was found, drivers drove at significantly lower speeds in the tunnels compared to surface roads. Kircher and Ahlstrom (2012) investigated the effects of tunnel design and lighting on driver performance in a driving simulator and found light-coloured walls were more important than strong illumination to keep drivers’ visual attention on the road ahead
METHODOLOGY
Location of the Study Area
The study was conducted at the Meru-Menora Tunnel (North Bound – South Bound) situated on the North-South Expressway in Perak. Constructed in accordance with the R6 design standard, this tunnel boasts a noteworthy infrastructure comprising four lanes. Specifically, two of these lanes are exclusively dedicated to facilitating traffic flow in each direction, contributing to the establishment of an efficient and wellorganized transportation system. With a considerable length spanning 800 meters and an impressive clearance of 5 meters, the Meru-Menora Tunnel emerges as a pivotal element within the regional transportation network. The meticulous planning of its design and layout is geared towards ensuring the seamless and secure passage of vehicles moving in both the North and South directions. In terms of regulatory measures, a posted speed limit of 90 kilometers per hour governs the movement of vehicles within this tunnel. This limit is a crucial aspect of upholding safety standards and optimizing traffic flow. Its implementation is carefully calibrated to strike a balance between the need for expeditious travel and the imperative of maintaining a secure environment for all commuters navigating through the tunnel.
Instruments used in the study
Throughout the course of this research initiative, the precision of data acquisition was facilitated by deploying a laser meter detector integrated with state-of-the-art LIDAR technology. This sophisticated instrument functions by emitting imperceptible pulses that interact with oncoming vehicles. Through the meticulous analysis of the time required for the reflected light to return, the detector is capable of promptly and precisely calculating the speed of these vehicles. LIDAR, an acronym for Light Detection and Ranging, represents a remote sensing technology that harnesses laser light to measure distances with unparalleled accuracy. Within the framework of this study, the laser meter detector emerged as an indispensable tool for capturing real-time speed data. Its proficiency in emitting imperceptible pulses ensures the non-intrusive monitoring of vehicles, facilitating inconspicuous and effective data collection. Figure 1 offers a visual portrayal of the laser meter detector specifically employed in this research. The illustration highlights the technological intricacies and design elements that empower the device to adeptly capture and process data pertaining to vehicle speed. The integration of LIDAR technology significantly elevates the precision and dependability of speed measurements, thereby augmenting the overall robustness of the study’s findings and analytical outcomes.
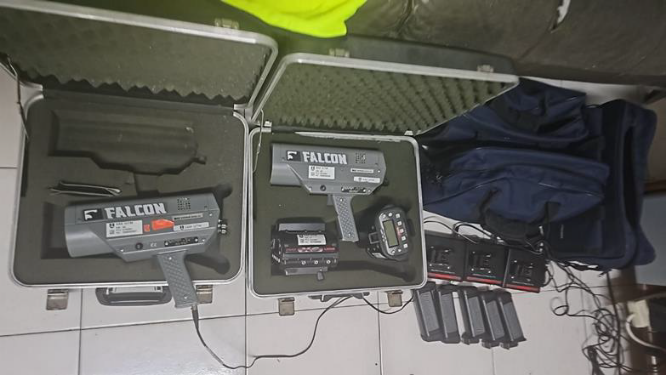
Figure 1: Radar Gun & Laser Gun for the Spot Speed Study at Meru Tunnel
Data Collection
The research was conducted on December 16, 2023, and transpired in two distinct sessions. The initial session spanned from 12:30 pm to 1:30 pm, with a brief intermission, followed by a resumption from 1:40 pm to 1:55 pm. Two specific locations were chosen for the study, one in proximity to the tunnel entrance and the other moving away from the tunnel. The systematic collection of speed data occurred at both locations at five-minute intervals, with a meticulous differentiation based on vehicle classifications and lanes, facilitated through visual observation. In pursuit of the study objectives, six vehicle classifications were identified based on the Road Traffic Volume Measure (RTVM). The lanes were strategically divided into two categories: the first lane, positioned near the shoulder, and the second lane, closer to the median. This segmentation laid the groundwork for a comprehensive analysis of speed variations among diverse vehicle types and lane positions, providing a nuanced understanding during specific time intervals on the designated date.
Data Analysis
The data analysis for this spot speed study involved a comprehensive process of recording and tabulating speed data, employing Microsoft Excel as the analytical tool. Each distinct five-minute interval was treated as an individual event for analysis. To derive meaningful insights into the vehicular speed patterns, calculations for the Time Mean Speed (TMS) were carried out. The computation of TMS entails summing up the measured speeds recorded within a specific interval and subsequently dividing this sum by the total number of vehicles measured during that time window. This meticulous approach not only allowed for a detailed examination of speed variations but also provided a holistic understanding of the average speed characteristics over the entire duration of the study. By treating each interval as a unique event, the analysis aimed to capture the nuances and fluctuations in speed data, contributing to a more nuanced and accurate portrayal of the spot speed dynamics at the study location. The utilization of Microsoft Excel facilitated not only efficient data management but also enabled the application of various statistical measures to enhance the precision and reliability of the findings. The data analysis process was designed to uncover valuable insights into the temporal patterns and distribution of speeds, forming a crucial foundation for the overall interpretation of the spot speed study results.
RESULTS AND ANALYSIS
85th Percentile and 95th Percentile Speed Analysis
Spot speed data recorded from the study is used to analyze the 85th percentile speed analysis and 95th percentile speed analysis which can be represented as the operating speed and design speed of the selected case study. Table 1 shows the tabulated data obtained from the spot speed study and being classified into speed class and frequency. From the tabulated table, a graph of 85th percentile and 95th percentile was plotted in Figure 2 and Figure 3. From the graph of 85th percentile and 95th percentile, the operating speed obtained was around 82.67km/h and the design speed obtained was around 86.02 km/h. As stated in previous section, the case study at Meru Tunnel is identified as rural expressway using R6 design standard as stated in ATJ 8/86 (Pindaan 2015) as shown in Table 2, the appropriate design speed on R6 rural expressway for mountainous terrain are 80 km/h.
Table 1: Spot Speed Study data tabulated for 85th percentile and 95th percentile study
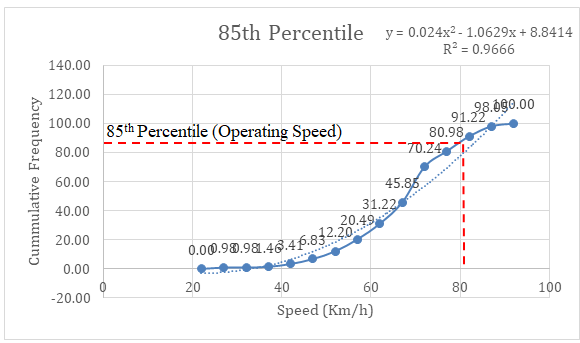
Figure 2: 85th percentile graph
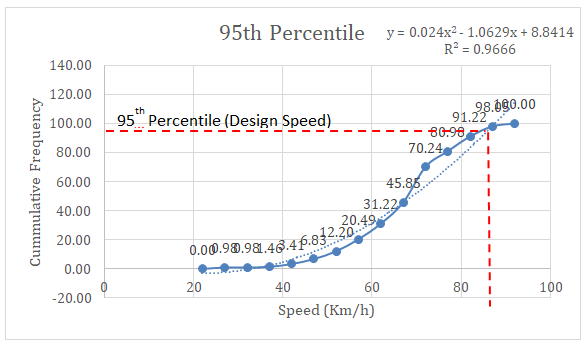
Figure 3: 95th percentile graph
| Design Standard | Design Speed (km/hr) | ||
| Terrain | |||
| Flat | Rolling | Mountainous | |
| R6 | 120 | 100 | 80 |
| R5 | 100 | 80 | 60 |
| R4 | 90 | 70 | 60 |
| R3 | 70 | 60 | 50 |
| R2 | 60 | 50 | 40 |
| R1 | 40 | 30 | 20 |
Table 2: Design Speed for rural area at multiple terrain type (ATJ 8/86, Pindaan 2015)
Relationship between mainstream traffic operating speed and percentage of heavy vehicle
According to ATJ 8/86 (Pindaan 2015), operating speed is the highest overall speed at which a driver can travel on a given road under favourable weather and prevailing traffic conditions without any exceeding the design speed on a section-by-section basis. According to Malaysia Highway Capacity Manual (2011), Time Mean Speed (TMS) is the arithmetic mean of the speeds observed at some designated point along the road also referred to as the average spot speed. Time mean speed can be computed as the sum of the measure spot speeds divided by the number of measurements. The individual speeds of vehicles passing a point are recorded and averaged arithmetically. Based on the empirical data collected at the case study location as tabulated in Table 3, the relationship between mainstream traffic operating speed and percentage of heavy vehicle was analysed as shown in Figure 4 and Figure 5 that indicates relationship between TMS Exit Lane 1 with percentage of heavy vehicle and TMS Exit Lane 2 with percentage of heavy vehicle. Meanwhile, the analysis was continued by using a statistical software called Minitab and the result obtained is shown in descriptive analysis and regression analysis section below.
| TMS NS Enter Lane 1 | TMS NS Enter Lane 2 | TMS NS Exit Lane 1 | TMS NS Exit Lane 2 | %HV Enter |
| 72.32 | 81.71 | 63.60 | 77.38 | 27.78 |
| 65.60 | 74.92 | 60.18 | 73.96 | 27.27 |
| 65.07 | 84.10 | 60.41 | 70.03 | 25 |
| 65.67 | 84.10 | 61.81 | 74.48 | 21.05 |
| 68.78 | 79.47 | 66.13 | 76.17 | 24.24 |
| 47.87 | 62.71 | 52.07 | 64.40 | 37.93 |
| 67.88 | 72.73 | 64.00 | 76.30 | 26.09 |
| 70.34 | 85.07 | 65.43 | 80.48 | 29.55 |
| 58.23 | 72.19 | 58.61 | 73.31 | 14.71 |
| 63.11 | 74.29 | 61.43 | 74.31 | 23.08 |
Table 3: Empirical Data from Case Study at Meru Tunnel from 12.30 pm to 1.50 pm
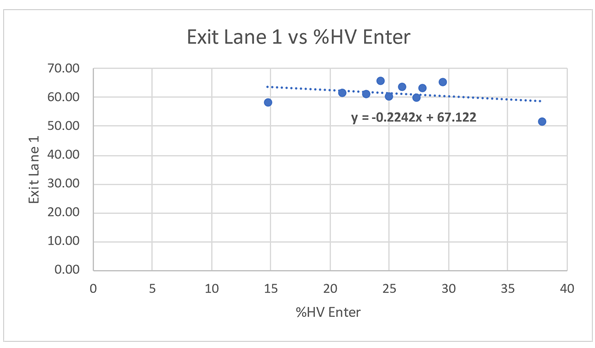
Figure 4: Graph of TMS Exit Lane 1 vs %HV Enter
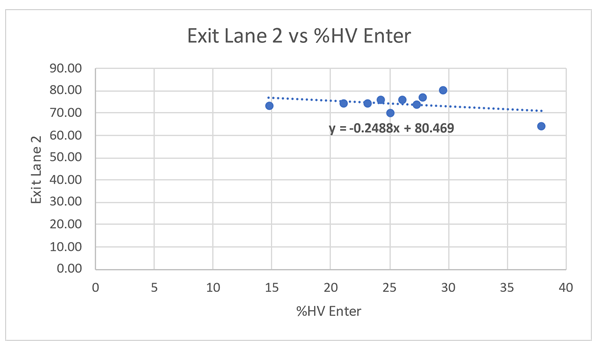
Figure 5: Graph of TMS Exit Lane 2 vs %HV Enter
Descriptive Analysis
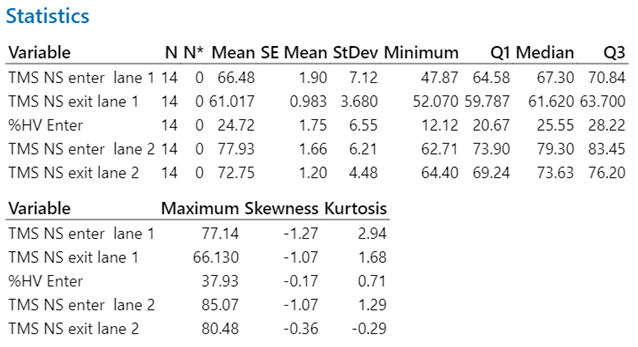
Figure 6: Descriptive Analysis from Minitab
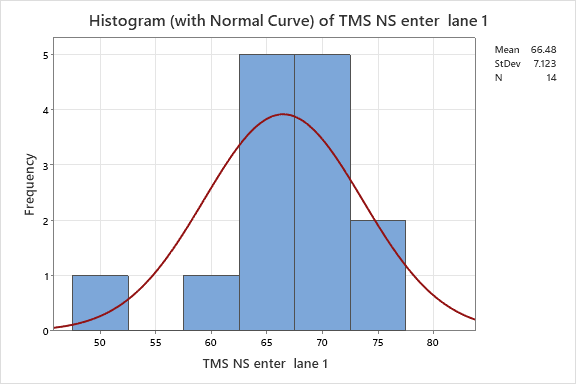
Figure 7: Histogram of TMS Enter Lane 1
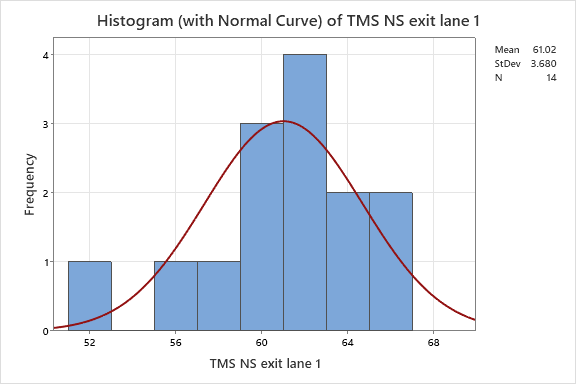
Figure 8: Histogram of TMS Exit Lane 1
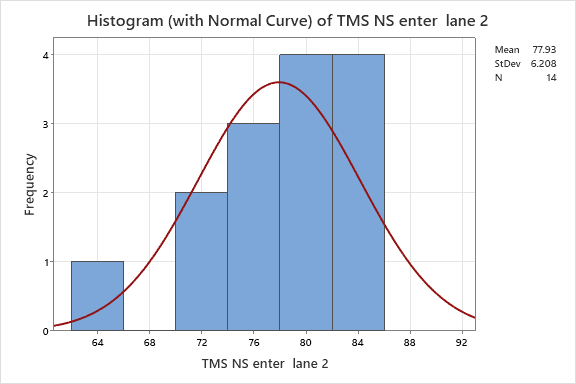
Figure 9: Histogram of TMS Enter Lane 2
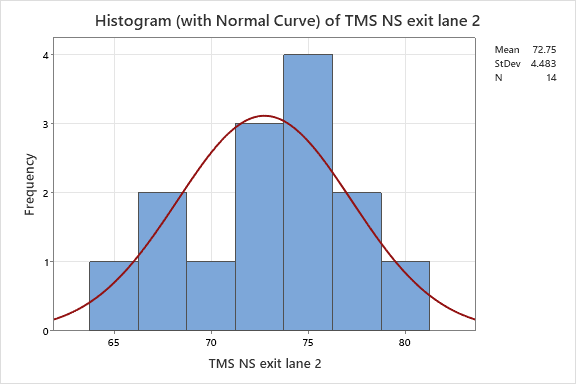
Figure 10: Histogram of TMS Exit Lane 2
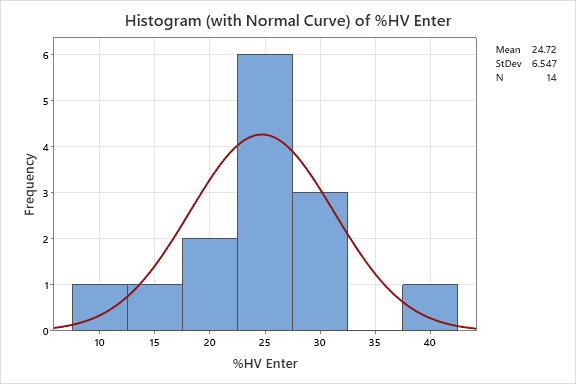
Figure 11: Histogram of %HV Enter
Regression Analysis (TMS Exit Lane 1)
Regression analysis is commonly being used to model the relationship between two or more parameters by using statistical software such as Minitab to produce regression equation related to the selected responses. There are two regression analysis that has been analyse which is for TMS Exit Lane 1 and TMS Exit Lane 2. Equation 1 and equation 2 shows the regression equation for both lane TMS during exiting the Meru Tunnel.
The regression equation for TMS Exit Lane 1 model is shown in equation 1. The equation shows that the coefficient for the predictor variable %HV Enter has a negative sign, implying that an increase in the percentage of heavy vehicle will lead to a decreases in the TMS Exit Lane 1 and TMS Enter Lane 1. Figure 12 shows the percentage of R2 value of this regression equation which already exceed 40%.
TMS Exit Lane 1= 33.4 + 0.500 TMS Enter Lane 1 – 0.189 %HV Enter (1)
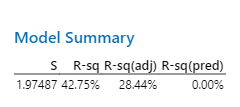
Figure 12: Model Summary of Regression Analysis TMS Exit Lane 1
Regression Analysis (TMS Exit Lane 2)
The regression equation for TMS Exit Lane 2 model is shown in equation 2. The equation shows that the coefficient for the predictor variable %HV Enter has a negative sign, implying that an increase in the percentage of heavy vehicles will lead to a decrease in the TMS Exit Lane 2 and TMS Enter Lane 2. Figure 13 shows the percentage of R2 value of this regression equation which already exceed 40%.
TMS Exit Lane 2= 48.8 + 0.366 TMS Enter Lane 2 – 0.113 %HV Enter (2)

Figure 13: Model Summary of Regression Analysis TMS Exit Lane 2
DISCUSSION
Based on the regression analysis, it has shown that the TMS Enter Lane 1 and TMS Enter Lane 2 is significant. This indicates that with the presence of heavy vehicle in the mainstream traffic, the heavy vehicle has influenced the surrounding traffic speed due to the physical and operational characteristics. Physical characteristic includes the length, size, and loads of the heavy vehicle while operational characteristic includes the speed, acceleration rate, deceleration rate, and time taken for the heavy vehicle to fully stop during emergency braking. Based on the regression equation 1 and regression equation 2, the coefficient for both predictor variable %HV Enter has a negative sign, implying that an increase in the percentage of heavy vehicle will lead to a decrease in the TMS Exit Lane 1, TMS Enter Lane 1, TMS Exit Lane 2, and TMS Enter Lane 2. This shows that with presence of higher percentage of heavy vehicle in the mainstream traffic, the speed from the passenger vehicle on surrounding will be affected. The higher the percentage of heavy vehicle in the mainstream, the slower the traffic speed altogether which can lead to congestion and reduces the Level of Service (LOS) of the traffic. This will also increase the traffic volume when the percentage of heavy vehicle increases and also reduces the flowrate of the traffic. The higher percentage of heavy vehicle in the mainstream traffic at the case study location greatly affecting the traffic speed during entering and exiting Meru Tunnel as shown in the regression equation 1 and regression equation 2. For example, by using regression equation 1 with percentage of heavy vehicle at 27.78%, the TMS Exit Lane 1 obtained from calculation is 64.31 km/h and when calculated by using percentage of heavy vehicle at 14.71%, the TMS Exit Lane 1 obtained is 59.73 km/h. This shows that by using higher percentage of heavy vehicle will result in lower TMS Exit Lane 1 value. This proves that the hypothesis stated in early section can be accepted as the higher percentage of heavy vehicle did affect the overall traffic speed.
RECOMMENDATIONS AND CONCLUSION
There are a few recommendations can be suggested based on the site observations and findings of the study. One recommendation is to install more traffic calming elements such as the rumble strips and road studs at the case study location because the incoming vehicle is coming from a negative gradient which is from downhill where the speed need to be reduced for safety purposes. Traffic calming is the process of reducing the physical and social impacts of traffic through the reduction of traffic speeds and volumes. Traffic calming can be involved by using direct intervention using physical devices or other management techniques or they may involve more fundamental social changes that result in different travel choices and driver behaviour. In conclusion, based on the study, it has been proven that the percentage of heavy vehicle in the mainstream traffic did affecting the surrounding traffic speed where the higher percentage of heavy vehicle resulting in reduction of speed during entering and exiting Meru Tunnel. The effect of tunnelling plus the presence of heavy vehicle at the case study also reduces the speed during exiting Meru Tunnel. This can be proved when the operating speed calculated before entering Meru Tunnel is around 82.67 km/h and after exiting the Meru Tunnel the speed reduces to 64.31 km/h as stated in the example above.
REFERENCES
- ATJ 8/86. (2015). A Guide on Geometric Design of Roads. Ibu Pejabat JKR Malaysia
- Brodie, L., Lyndal, B., & Elias, I. J. (2009). Heavy vehicle driver fatalities: Learning’s from fatal road crash investigations in Victoria. Accident Analysis & Prevention, 41(3), 557–564. https://doi.org/10.1016/j.aap.2009.02.005
- Calvi, A., De Blasiis, M. R., & Guattari, C. (2012). An empirical study of the effects of road tunnel on driving performance. Procedia – Social and Behavioural Sciences, 53, 1098–1108. https://doi.org/10.1016/j.sbspro.2012.09.959
- Chen, D., Ahn, S., Bang, S., & Noyce, D. (2016). Car-following and Lane-changing behaviour involving heavy vehicles: Transportation Research Record: Journal of the Transportation Research Board, 2561(1), 89–97. https://doi.org/10.3141/2561-11
- Highway Capacity Manual. (2011). Highway Capacity Manual. Highway Planning Unit Ministry of Works Malaysia
- Moridpour, S., Mazloumi, E., & Mesbah, M. (2014). Impact of heavy vehicles on surrounding traffic characteristics. Journal of Advanced Transportation, 49(4), 535–552. https://doi.org/10.1002/atr.1286
- Moridpour, S., Sarvi, M., Rose, G., & Mazloumi, E. (2011). Lane-changing decision model for heavy vehicle drivers. Journal of Intelligent Transportation Systems, 16(1), 24–35. https://doi.org/10.1080/15472450.2012.639640
- Roh, C.-G., Park, B.-J., & Kim, J. (2017). Impact of heavy vehicles on highway traffic flows: Case study in the Seoul metropolitan area. Journal of Transportation Engineering, Part A: Systems, 143(9). https://doi.org/10.1061/jtepbs.0000077
- Sarvi, M. (2011). Heavy commercial vehicles‐following behaviour and interactions with different vehicle classes. Journal of Advanced Transportation, 47(6), 572–580. https://doi.org/10.1002/atr.182
- Yeung, J. S., & Wong, Y. D. (2014). The effect of road tunnel environment on car following behaviour. Accident Analysis & Prevention, 70, 100–109. https://doi.org/10.1016/j.aap.2014.03.014