
The Influence of Supply Chain Responsiveness Elements on Order Fill Rate in Apparel Industry. A Case Study of Apparel Shops in Harare CBD.
The Influence of Supply Chain Responsiveness Elements on Order Fill Rate in Apparel Industry. A Case Study of Apparel Shops in Harare CBD.
Fadzai Nyaude1, Davison Maunganidze2
1Bindura University of Science Education Alumni, Zimbabwe
2Global Diplomatic Forum (GDF) Member
DOI: https://dx.doi.org/10.47772/IJRISS.2024.807053
Received: 15 June 2024; Accepted: 25 June 2024; Published: 01 August 2024
ABSTRACT
The study was focusing on the influence of supply chain responsiveness elements on order fill rate in apparel industry. Three dimensions were proposed and tested. The main objective of the study was to determine the influence of supply chain velocity on order fill rate for apparel shops and develop a framework model that could be used by the apparel industry to improve their supply chain velocity so that they can meet customer demand on time. Other objectives of the study were to determine the influence of supply chain visibility on order fill rate and describe how apparel shops can improve their visibility. The other objective was to determine the influence of supply chain versatility and order fill rate. Causal research design was used to test the relationship between the variables. The sample size used was 151 apparel shops. The study utilized quantitative data collection procedures such as questionnaire. Questionnaire was distributed in person. The Statistical Package for Social Sciences (SPSS) version 20 and STATA14 quantitative software packages were used to analyze quantitative data. The results of the data were presented in the form of tables. The study revealed that supply chain responsiveness elements which are supply chain visibility and supply chain versatility has a positive influence on order fill rate. The findings showed that apparel shops should make all efforts in making sure that necessary resources are available to quickly and efficiently meet customer demand in uncertain markets and also make sure that actors in the supply chain have access to or share information which they consider as key or useful to their operations. However, the study revealed that supply chain velocity has a negative influence on order fill rate. This can happen if the focus on speed results in sacrificing accuracy and quality in order fulfillment.
Key Words: Supply chain responsiveness, Supply chain, Order fill rate, Supply chain visibility, Supply chain versatility.
INTRODUCTION
In the current scenario of a constantly evolving supply chain, enhancing performance has emerged as a crucial factor for suppliers, manufacturers and retailers to attain and maintain their competitiveness. A number of organization, including Dell, Walmart, Samsung, Lenovo and Toyota have adopted various tools for performance management to support their supply chain strategies as suggested by (Beamon & Balcik, 2008). The success of a company is ultimately dependent on the effectiveness of its supply chain which refers to the network of individuals, organizations, resources, activities and technologies involved in the creation and sale of a product. Supply chain aim to meet customer demands (Chopra & Meindl, 2010). To keep up with the ever- increasing pace and size of the global market, supply chain managers must be flexible. One of the most effective ways to accomplish this is by increasing inventory velocity. This ensures that demand outstrips supply and that businesses can benefit from changing customer needs that are distributed across various regions. To remain competitive, businesses must be equipped to meet the increasing demand for faster delivery times while also tackling the challenge of minimizing marketing costs. This entails taking a proactive and strategic approach to supply chain management and resource allocation in order to streamline operations, maintain healthy margins and invest in cutting- edge product development to secure a secure market position.
Chopra and Meindl (2012), the primary goal of a supply chain is to optimize the overall value generated at each stage of the process, which is closely linked to the profitability of the organization. By developing an efficient and effective supply chain management system, companies can enhance their customer satisfaction levels and ultimately gain competitive advantage. Therefore, supply chain management plays a crucial role in a company’s overall corporate strategy, aiding in the enhancement of its productivity and profitability (Gunasekaran,
Patel & McGaughey, 2004). It encompasses all the activities involved in fulfilling a customer demand from manufacturing, and sourcing to transportation, warehousing, and even the end customer. In this sense, the supply chain involves a range of parties, not just the manufacturer or supplier (Chopra and Meindl, 2016).
The second hand clothing market is thriving amidst the decline of the textile industry (Mpofu, 2013). As locally produced clothing has become relatively expensive compared to imported items.
Khan (2014) reported that China is the world’s largest producer and exporter of clothing and textile products, while Zimbabwe is experiencing an influx of second hand clothing, significantly impacting the local market (Nyoni, 2017). This competition has even forced some local manufacturers to shut down their operations. According to the Zimbabwe clothing Association (2011) in 2000 there was 495 clothing companies employing 20000 people in Zimbabwe, however, the number reduced to 296 companies and 9000 employees in 2011.This highlights the need to revive the sector as it is essential for employment creation and being labor intensive. The United States of America, Canada and UK are the primary sources of second hand clothes, while retail giants such as Edgars, Truworthy and Topics are facing stiff competition due to the sale of second hand clothing at significantly lower prices. Most people are importing cheap clothing from South Africa also.
Problem Statement
The apparel industry is facing many challenges. Big companies in the industry like Edgar’s, Topics and Trustworthy are recording many cases of customer complaints that are related to order fillment processes and delays in the supply chain processes. These mostly included customers receiving the wrong item or a damaged item, after long waiting for the product. These developments resulted in monetary costs incurred by these companies to replace the product. Worse still, the consumers ended up cutting business with these companies. There is delay in delivery of stock such that they normally receive their merchandise when they are off season and out of stock. The industry is also facing stiff competition from second clothing which are offered on cheap prices.
Objectives of the Study
The research sort
- To determine the influence of supply chain velocity on order fill rate
- To determine the influence of supply chain visibility on order fill rate
- To determine the influence of supply chain versatility on order fill rate
- To make recommendations that enhances higher order fill rate
Research Hypothesis
In order to achieve the objectives, the following hypothesis were used:
H1: There is a relationship between supply chain velocity on order fill rate.
H2: There is a relationship between supply chain visibility on order fill rate.
H3: There is a relationship between supply chain versatility on order fill rate.
RESEARCH METHODOLOGY
The researchers used casual research design because the research seeks to find the influence of supply chain responsiveness on order fill rate. Lanchester (2005), is of the opinion that causal studies are a sort of conclusive studies and Mahotra (2007), cemented that its major focus is to authenticate reason of the results of relationships. As if the notion that supply chain responsiveness has an influence on order fill rate is not justifiable, the researchers had to test the relationships and ensure validity of the causal study to be tested, determining the reliability of the results from the large population. The target population of the study constituted the managers and salespersons from 25 years and sample of 250 (City of Harare rotten raw business licensing department) apparel shops in Harare. The researchers used paper-based questionnaire (see appendix) which were distributed to firm managers. Research ethics were taken into consideration when designing the questionnaire as the research was aiming to gather valid data. Questionnaires were used as they maintain anonymity and confidentiality thereby encouraging the respondents to give accurate and valid responses. Secondary data on supply chain responsiveness was obtained from previous related research documents. To measure supply chain responsiveness types which are supply chain velocity, supply chain visibility, the researchers used a seven point likert scale adopted from (Mandal, Sarathy, Korasiga and Bhattacharya and Dastidar, 2016).To measure supply chain versatility the researcher used a seven point likert scale adopted from (Leonczuk, Ryciuk, Szymczak and Nazarko, 2019). The information gathered from surveys was examined and then displayed in tables using Statistical Package for Social Science (SPSS), a popular data analysis software that transforms raw data into easily understandable and valuable insights. Validity was assessed through the pattern matrix. Additionally, the data was evaluated for reliability and all variables surpassed the minimum threshold. A regression analysis was performed and linearity was assessed using the ANOVA table, while multi-collinearity was assessed using variance inflation factor. Homoscedasticity assumption was tested using the Levene test of equality. The Shapiro-Wilk test was conducted to verify the normality assumption.
RELATED LITERATURE REVIEW
Theoratical Framework
Supply Chain Velocity and Order Fill
Tsironis and Matthopoulos (2015) define supply chain velocity refers to the ability to perform different actions and activities with speed. Juttner and Maklan (2011) specifies that velocity is the rate at which the supply chain respond to modifications and circumstances occurring in the market. Supply chain innovations, supply chain speed, supply chain dimensions, supply chain adaptability and supply chain empowerment are the supply chain velocity dimensions which were identified by (Dubey, Ali and Venlcatesh, 2014) and (Tukumuhabwa et al, 2015). David Ross (2007) suggested that if manufacturers and consumers are located near to each other, there would be quicker flow of demand signals from the customers to the suppliers, leading to rapid delivery of goods and services to the customers. The crucial indication of customer satisfaction is the fill rate which evaluates how quick customers can expect to receive purchases from a business. Customers believe that companies with high fill rate are more trustworthy and easier to do business with. If a company have a low supply chain velocity this can lead to loss of sales and unhappy customers leading to some customers turning to other suppliers.
The theory of constraints supports the hypothesis that there is a relationship between supply chain velocity and order fill rate. The theory of constraints is an organizational change and process improvement methodology developed by (Goldratt, 1984). I t is based on the idea that every complex system has at least one constraint that limits its ability to achieve more of its goals.
Identifying and managing the constraints an organization can maximize their performance and efficiency. The core philosophy of theory of constraints is that the performance of any system is limited by its weakest links, and this means that a system, whether it is on organization, a process or a product can only achieve its maximum performance when all of its components are working together optimally. The theory of constraints uses a structured approach to identify the bottleneck in the system, develop strategies to manage it and measure the impact of the strategies. Therefore, companies should identify and eliminate any bottlenecks in the supply chain that preventing it from achieving maximum velocity. By doing so the company can improve the flow of goods through the supply chain leading to higher order fill rate. Therefore, we say supply chain velocity has a statistically significant impact on order fill rate.
The methodology of Just in time can be used to cement the influence of supply chain velocity on order fill rate. The methodology of Just in time is a production strategy that focuses on the efficient use of resources by producing only what is needed, when it is needed and in quantity needed. The just in time approach was developed by Toyota in the 1950s. Toyota sought to reduce waste and increase efficiency by producing only what was needed and, in the quantity, needed. The idea behind just in time is to eliminate waste by reducing amount of inventory on hand, reducing lead times and using fewer resources to produce a given quantity of product Therefore, methodology of Just in time reduce inventory cost, improves efficiency and allows companies to respond quickly to customer demand (Bhagwatt, 2002). Just in time methodology suggest that a company should maintain the minimum amount of inventory and deliver the right product to the right place at the right time. This helps to reduce inventory cost and improve supply chain velocity leading to higher order fill rate. Therefore, we can hypothesize that there is relationship between supply chain velocity and order fill rate.
Supply Chain Visibility and Order Fill Rate
According to Barrat and Oke (2007) supply chain visibility as the degree to which participants in a supply chain possess or exchange information that they deem valuable or useful to their operations and that they anticipate will be advantageous to all parties involved. To ensure the effectiveness of supply chain visibility, it is essential that data is easily accessible, provided in a timely manner, accurate and delivered in a format that effectively communicates all necessary information (Pettit, 2008). Supply chain visibility can be used to resolve the issues of supply chain disruptions and also helps in decision making such that there will effective decision making to support normal operations (Carvalho et al, 2012). Pettit (2008) supply chain visibility dimensions includes information technology, information exchange, business intelligence gathering and knowledge of asset status. Oakden (2019) enhanced supply chain visibility within intricate supply chains results in fewer interruptions, heightened customer satisfaction and reduced costs. A supply chain visibility initiative enables product teams to identify and address shortcomings in the supply chain such as inventory shortages or order fulfillment difficulties, before they escalate into significant issues (Oakden, 2019).
The Network theory can be applied to support the hypothesis that supply chain visibility has a significant impact on order fill rate. According to Idous and Wilson (2000), a network is a graph with nodes and edges possess qualities. Rutherford Aris developed network theory in 1965. It is network theory seen as describing the interactions between a company’s stakeholders, suppliers, clients, or the buyer are involved (Soramaki, 2015). Because of the interconnection of the world’s economies, the supply chain system is within a network that is complex. Despite the members’ high levels of independence, they work together on financial, Information and materials flow resilience in the supply chain a result of the existence of hub businesses and networks (Hearnshaw and Wilson, 2013). The network theory, in addition to their interactions with direct partners, businesses also rely on a wider network of connections with supply chain companies. To gain competitive edge, (Tang, 2013) suggests that businesses must coordinate their supply chain networks effectively and efficiently. Chichsand, Watson, Walker, Radnor and Johnston (2012) argued that the focus of network theory in supply chain is to establish trust- based, long term relationships among firms in the supply network. The theory emphasizes the behavioral and social aspects of the relationship, including interpersonal and inter-firm connections. Network theory provides an analysis of these relationships through financial, technical, and social perspectives to facilitate sustainability decision making (Chichsand et al., 2012). Network theory is crucial to optimizing and managing the supply chain network, as it offers improved methods of security in the supply chain and provides reference and guidance for effectively constructing the supply chain network to enhance performance (Yongxi, 2014).In summary , the practical significance of network theory lies in its ability to optimize and manage the supply chain network by offering enhanced security and effective construction methods to improve the performance chain system. Ramanathan and Gunasekaran (2014) used the network theory and optimization models to design and analyze supply chain network for a manufacturing company. Therefore, the network theory can be used to improve the order fill rate and reduce supply chain risks, so we can say supply chain visibility has a statistically significant impact on order fill rate
The theory of information integration support that there is a relationship between supply chain visibility and order fill rate. The theory of information integration is a general framework used to explain how people combine multiple sources of information when making decisions. It was developed by Simon and Chase (1973). The theory states that when making decisions, people integrate multiple sources of information to form a mental representation of the situation. This mental representation is then used to guide decision making. Gigerenzer and Goldstein (1996) suggest that the theory of information integration is based on the assumption that people use a variety of mental processes to combine information from multiple sources. These processes include categorization, integration and abstraction. Categorization involves breaking down information into components that more easily understood. Integration involves combining separate pieces of information into a single mental representation. Finally, abstraction involves extracting the most important pieces of information from mental representation. The theory has been applied to a variety of decision-making processes such as financial decision making, medical decision making and political decision (Kahneman and Tversky, 2000). Therefore, this theory can be used to improve supply chain visibility by integrating information from multiples sources. This includes integrating data from suppliers, customers and other shareholders. By doing so the organization can gain a more comprehensive view of the entire supply chain and make better decision which will enhance better performance and customer satisfaction.
Supply Chain Versatility and Order Fill Rate
Given evolving market demands and customer needs, a supply chain must remain adaptable and capable of modifying its operations. Thus, the ability of a supply chain to be flexible and adaptable is essential for obtaining and sustaining a competitive advantage, referred to as supply chain versatility (Beamon, 2008). According to Lee (2004) he defined supply chain versatility as the ability of a supply chain to quickly and cost effectively adapt to changes in the customer demand, market conditions, and other external and internal factors. It involves the ability to quickly and efficiently adjust the various elements of a supply chain in order to meet the changing needs of customers. This includes ability to adjust production processes inventory level, distribution, logistics and other components of the supply chain. The company should be able to maintain the operational continuity of the supply chain in particularly unfavorable conditions of the environment for example high level of inflation, unstable political conditions and natural disasters.
The resource-based theory was developed by Barney and Grant (1991). The authors argue that an organization’s resources are the basis of its competitive advantage. The theory suggests that an organization ability to out- perform its competition depends on the resources at its disposal. This includes tangible resources such as capital, land, technology, knowledge, skills and reputation. Many technology companies have used the resource they possess to create a competitive advantage; by investing in research and development and they have developed new products and services that allowed them to outpace their competitors. By that applying the resource-based theory some companies were able to create and exploit new opportunities in their markets and also they are successfully navigating changing market conditions (Grant, 1992). Therefore, resource-based theory suggest that companies should focus on their internal resources and capabilities to create a more versatile supply chain. Companies can use their resources to develop innovative products and services, building better relationship with suppliers and develop more efficient process, therefore we can supply chain versatility has a statistically significant impact on order fill rate.
The Resource dependency theory supports that there is relationship between supply chain versatility and order fill rate. The Resource dependency theory was first created by Pfeffer and Salanick in 1978. The resource dependency theory is a framework that seeks to explain the behavior of organizations and how they interact with their external environment. Amy, Michael and Brian (2009) argue that organizations are dependent on external resources such as raw materials, customers or information in order to survive and thrive. The resource dependency theory argues that the level of dependence of organization on external resources can be a critical factor in their decision making and behavior. This theory is highly relevant to supply chain versatility and order fill rate, as supply chain management involves coordinating and managing the flow of goods, services, and information between suppliers, manufactures, distributors and customers. In the context of supply chain management, Resource dependency theory suggests that organizations need to establish strong relationships with their suppliers and other external partners to ensure a consistent and reliable supply of resources that are critical for their operations. This includes raw materials, components, finished products, transportation, logistics and other resources that are required to meet customer demand and maintain high levels of order fill rate. Apparel shops must invest in building strong and effective supplier relationship, develop contingency plans and backup resources to mitigate risks and disruptions in the supply chain, and continuously monitor and improve their supply chain processes to optimize efficiency and order fill rate. Additionally, apparel shops may need to consider diversifying their supplier base, reducing their reliance on a single supplier or region and exploring new sources of supply and technological innovations that can enhance their supply chain versatility. By adopting a proactive and strategic approach to supply chain management, organization can increase their resilience, adaptability and competitiveness in a dynamic and complex business environment. Therefore, we can conclude that there is positive relationship between supply chain versatility and order fill rate.
Michael Porters Value chain supports that there is relationship between supply chain versatility and order fill rate. The value chain was developed by Michael Porters in early 1980’s. Michael Porter’s value chain model was created to help companies identify methods to maximize customer value. The model consists of nine activities that contribute to value creation, including five primary and four supporting activities (Porters, 1998). The primary activities are inbound logistics, which involves managing the flow of raw materials or goods into the business, operations, which entails the conversion of inputs into finished products or goods. Outbound logistics, which involves the process of shipping out final products, marketing and sales , which focuses on providing goods that customers are willing to purchase and services, which play a role in maintain According to Porter (1998) the support activities in a value chain consist of procurement , which involves the acquisition of raw materials and other necessary inputs for creating valuable activities .The technology development activity , which comprises of research and development process automation , and relevant technological innovations. Additionally, the human resource management activity encompasses all the tasks associated with recruiting, employee development and compensation. Lastly, the firm infrastructure activity focuses on finances and quality management, which can contribute to an organization’s cost position, providing them with a competitive advantage. Overall, every activity within the value chain plays a vital role in creating a solid foundation for an organization’s competitive advantage.
Figure 1: PORTER’S VALUE CHAIN
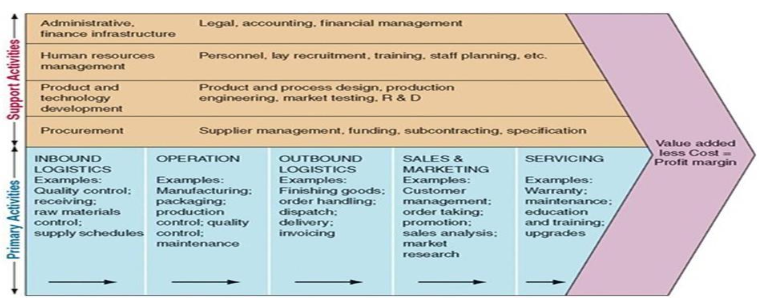
SOURCE (PORTER 1998, 46 modified)
The support activities are handled mostly in specialized departments and occasionally in other departments. According to Porter (1998) the success of a firm depend on how well each department perform its work and how well inter- department activities are handled. It is important for the department to focus on the interest of both customer and company. There in terms of supply chain versatility the value chain model can help companies to identify areas where they can improve their ability to respond quickly to changes in demand or supply chain disruptions and enhance customer satisfaction. The value chain model emphasizes the importance of flexibility and adaptability in supply chain. By being able to quickly respond to changes in demand or disruption in the supply chain, companies can improve their order fill rates and maintain high levels of customer satisfaction Therefore, we can say there is a positive relationship between supply chain versatility and order fill rate.
Empirical Evidence
Supply Chain Velocity and Order Fill Rate
There is a relationship between supply chain velocity on order fill rate. A study by Jamaludin, Fauzi & Nugraha (2021) was conducted to investigate how supply chain management affects the competitive advantage and performance of Small to Medium Enterprises (SMEs) in Bandung city, West Java. The study assessed various supply chain management factors, including technology utilization, supply chain speed, customer contentment, and integration of supply chain and inventory management. The indicators of competitive advantage measured are price, quality, time to market and sales growth, while financial and operational performance indicators were used to measure company performance. Structural Equation Modeling (SEM) with AMOS software version 20 is the analytical method used to test the hypothesis. The study involved 150 participants from Small to Medium businesses in Bandung, West, and Java. The findings suggested that supply chain management had a notable and positive impact on the company’s competitive advantage. Moreover, having a competitive advantage was also found to have a significant and favorable influence on the company’s performance. Therefore, we can say that there is a positive relationship between supply chain velocity and order fill rate.
Mentzer et al (2001) conducted a study to examine the impact of supply chain velocity on customer value and firm performance. The study was based on a survey of 298 supply chain professionals from various industries. The authors found that supply chain velocity has a significant positive impact on customer value and firm performance. Specifically, they found that firms with higher supply chain velocity are better to meet customer needs and expectations, resulting in higher levels of customer satisfaction and loyalty. In addition, firms with higher supply chain velocity are able to achieve higher levels of operational efficiency and cost savings, resulting in improved firm performance.
The study by DHL’s (2019) on resilient supply chain speed and agility in times of disruptions aimed to understand the impact of disruptions on supply chain resilience and identify best practices for building and maintaining resilient supply chains. The study surveyed 267 logistics and supply chain professionals across various industries and regions. The study found that disruptions are increasingly common and have significant negative impacts on supply chains including increased costs, delays and lost revenue. However, companies with resilient supply chains are better able to mitigate the impact of disruptions and recover more quickly. The study identified several key factors that contribute to supply chain resilience, including proactive risk management, strong supplier relationships, robust IT systems and a culture of collaboration and continuous improvement. Companies that prioritize these factors are better equipped to anticipate and respond to disruptions, and are more likely to maintain a competitive advantage.
The study by Ivanov and Sokolov (2014) aimed to investigate the impact of supply chain performance on business performance, specifically in terms of financial and operational measures. The authors conducted a literature view and analyzed empirical data from various industries and countries to identify the key factors that affect supply chain performance and its impact on business performance. Based on their analysis, the authors found that supply chain performance has a significant impact on financial and operational measures,
such as revenue growth, cost reduction, inventory turnover and delivery performance. They also identified several key factors that contribute to supply chain performance including supply chain integration, information sharing, supplier selection, and logistics management. The study highlights the importance of effective supply chain management in achieving business success, particularly in today’s global and highly competitive market.
Supply Chain Visibility and Order Fill Rate
Asamoah, Asare- Bediako & Jacqueline (2023) conducted a research on how supply chain visibility impacts the performance of Ghana Health Service’s supply chain. The study focused on Kumasi Metro Health Directorate and used questionnaires to collect data. The data was analyzed using both descriptive and inferential statistics. The study used descriptive statistics such as mean, standard deviation, frequencies, and percentages. It also conducted regression analysis to determine how supply chain visibility affects supply chain performance. The study found that the Kumasi Metro Health Directorate utilizes information exchange and sharing, asset status knowledge utilization, and enhanced electronic dissemination as measures to improve supply chain visibility. The research discovered that having visibility into the supply chain has a beneficial impact on the supply chain performance of Kumasi Metro Health Directorate. The majority of survey participants showed adequate knowledge of the methods employed to implement supply chain visibility in the organization. Therefore, we can hypothesis that there is a positive relationship between supply chain visibility on order fill rate.
Somapa, Cools and Dullaert (2018) conducted a systematic review of supply chain literature to identify the features and effectiveness of visibility in supply chain processes, and to determine the metrics that can measure these aspects in business operations. Their literature review aimed to offer a better understanding of supply chain visibility. The effectiveness and metrics of supply chain visibility are determined by a process- oriented approach that links the visibility to enhanced business performance. Their research indicates that supply chain visibility attributes can be measured through the quality, accessibility and usefulness of information. Additionally, the advantages of supply chain visibility go beyond operational efficiency and can impact an organization’s strategic abilities.
Okore & Kibert (2019) the research aimed to investigate how information sharing affects the supply chain performance of the tourism industry in Kakamega Country. The study focused on exploring the impact of collaboration and networking on supply chain performance in the Western region. The study utilized an explanatory survey approach and involved 459 workers from 4 licensed hotels in Kakamega Country’s tourism (Tourism Regulatory Authority, Western Region, 2016). The study utilized a questionnaire as a research tool and discovered that collaboration has an impact on the performance of the supply chain. Additionally, the study concluded that networking also affects the performance of the supply chain. The research findings showed that sharing information has an impact on the performance of the supply chain in the tourism industry of Kakamega Country. The study recommends that the supply chain department should implement effective networking strategies to improve customer satisfaction and supply chain efficiency. To improve access to information on suppliers and hotel or tour company management, collaboration programs should be established to encourage suppliers to work together and provide customer information to the hotels or tour companies.
Saqib, Saqib & Ou (2020) proposed a supply chain policy emphasizing visibility to address operational issues and improve collaboration among manufacturers, suppliers and customers. Their research findings suggest that achieving supply chain visibility is simpler when sharing information about globally and this primarily requires prioritization and investment. However, this is not the case when it comes to sharing official data about individuals. A social technologies gain more prominence, the importance of supply chain visibility may evolve over time, making it advantageous for supply partners. Therefore, we can conclude that there is a statically relationship between supply chain visibility on order fill rate.
Supply Chain Versatility and Order Fill Rate.
Um (2017) investigated how supply chain agility impacts customer service, differentiation and business performance. To do so, the researcher surveyed 156 manufacturing firms that specialize in high levels of customization. They used equation modelling to assess the proposed model. The findings imply that supply chain agility has a positive impact on customer service and differentiation, but it does not directly affect business performance. Instead, business performance can be enhanced through better customer service and differentiation, which can be achieved by improving supply chain agility. The paper provides guidance to managers on ways to improve their business performance by implementing recommended agile supply chain management practices. Therefore, we can conclude that there is a statistically relationship between supply chain versatility and order fill rate.
Park, Brauncheidel and Sureh (2023) the research proposes a theoretical framework for a company’s supply chain flexibility, which consist of its ability to detect and react to changes. The validity of this model is tested by examining how supply chain flexibility affects business performance. The objective of the research is to validate and verify the theoretical framework of sensing- responding Overboy et al (2006). Additionally, the study aims to expand on the existing research on sensing- responding frameworks to improve supply chain agility. The study used survey research and analyzed the data using the Hayes Process macro’s partial least squares technique and mediation tests. The results indicated that the company’s supply chain agility impacts business performance by mediating cost efficiency and customer effectiveness, thereby establishing its ability to predict future outcomes.
Sanchez & Perez (2005) investigate how the size of supply chain flexibility is linked to the performance of firms in the automotive industry. This was done by conducting a survey on 126 Spanish automotive suppliers during September and October 2003. A structured questionnaire was sent via mail survey to purchasing managers to collect data. The relationship between various dimensions of supply chain flexibility, firm performance and environmental uncertainty was analyzed using Spearman correlation coefficients. Additionally, a multivariate analysis was conducted to study the factors that determine supply chain flexibility. The study shows that there is a direct correlation between a company’s ability to be flexible and their overall performance. The findings suggest that supply chains operating in unpredictable environments with advanced technology and good communication have better flexibility, but lower interdependence among the supply chain participants.
The study conducted by Kamalini Ramadas and Ananth Raman (2013) aimed to investigate the impact of supply chain agility on the relationship between supply chain integration and performance. The authors defined supply chain agility as the ability of supply chain to respond quickly and effectively to unpredictable changes in demand or supply. The authors collected data from 162 manufacturing firms in India through a survey questionnaire. The questionnaire consisted of questions related to supply chain integration, supply chain agility, and supply chain performance. The authors used statistical analysis techniques to analyze the data and test their hypotheses. The results of the study showed that supply chain integration had a positive impact on supply chain performance. However, the authors also found that the relationship between supply chain integration and performance was stronger when the supply chain was more agile. This suggests that supply chain agility can act as a moderator in the relationship between supply chain integration and performance. The authors also found that supply chain agility was positively related to supply chain performance. This suggests that firms that are more agile are better able to respond to changes in demand or supply, which can lead to improved performance.
Research Gap Analysis
Basing on the previous studies which were done by other researchers world-wide, the researchers regarded it possible to continue with present study since it is not a duplicate, and also it is not the first study to be conducted in this area of supply chain responsiveness. The researchers found out that most of the researches were done in countries like Ghana, India and Kakamega country whereas this research is going to be conducted in Zimbabwe. Researchers conducted by those authors focused on manufacturing industries whereas this study focused on apparel industry in Harare CBD only. The researchers found out that most researchers used structural equation modeling (SEM) to analyze the data collected whereas this research is going to use multiple regression to analyze the data collected.
RESEARCH FINDINGS AND DISCUSSION
Response Rate
Different apparel companies in Harare were given questionnaires and their managers were the ones who responded. The sample size was 151 and the table below shows the obtained response rate.
Table 1: Questionnaire rate response
| Frequency | Rate | |
| Questionnaires distributed | 151 | 100% |
| Questionnaires returned | 144 | 96% |
Source: primary data
Demographic Profile Respondents
This section provides details about the managers’ demographic profile which includes information about their gender, age and educational level. The table below shows the results.
Table 2: Profile of response
| Count | Column % | N | ||
| gender | Male female | 68 | 47.2% | |
| 76 | 52.8% | |||
| age | below 20 20 -30
31-40 |
0 | 0.0% | |
| 27
46 |
18.8%
31.9% |
|||
| 41-50 | 41 | 28.5% | ||
| above 50 | 30 | 20.8% | ||
| education | primary education
secondary education diploma degree masters Phd |
0 | 0.0% | |
| 0 | 0.0% | |||
| 34 | 23.6% | |||
| 77 | 53.5% | |||
| 28 | 19.4% | |||
| 5 | 3.5% |
Source: Primary source
The table 2 shows that 52.8% of the respondents were female, while the remaining 47.2% were male. The highest percentage of respondents which is 31.9% fell within the age range of 31-40 years.
Followed by 28.5% fell within the age range of 41-50 years, above 50 years has got 20,8%, 2030 years range has got 18.8% and lastly no respondents has below 20 years. The highest education level among the respondents is degree with 53.5%, followed by diploma at 23.6%. Masters makes up 19.4%, while only 3.5% have a PhD. There were no respondents with primary and secondary education levels.
Scale Dimensionality
Unidimensionality is the existence of exactly one major dimension. In contrast with the conceptual viewpoint, it measures dimensions of the study since they cannot be measured directly like temperature, since such measures only approximates the actual results, it is therefore proper to measure each dimension separately through several items to capture the variance accurately and unbiased. Segars (1997).
Supply Chain Velocity
According to Rachel Hand (2021) supply chain velocity refers to the speed at which activities within the supply chain are completed, as well as the speed at which orders move through the supply chain from processing to arrival on the customers’ doorstep. In this research supply chain velocity was measured using three questions which were employed from (Mandal, Sarathy, Korasiga and Bhattacharya and Dastidar, 2016). The following table shows the factor analysis of supply chain velocity as it was loaded on the SPSS.
Table 3: Factor Analysis results of supply chain velocity
| Item | Loading |
| Our firm’s supply chain can rapidly deal with threats in our environment | .888 |
| Our firm’s supply chain can quickly respond to changes in the business environment | .888 |
| Our firm’s supply chain can rapidly address opportunities in our environment | .819 |
| Factor Analysis Statistics | Value |
| Variance Explained | 83.21% |
| Eigenvalue | 2.511 |
| Kaiser-Mayer-Olkin Measure of Sampling Adequacy | .746 |
| Bartlett’s Test of Sphericity | .000 |
| Reliability (Cronbach’s Alpha) | .902 |
Source: SPSS output
The principal factor analysis was used to examine the scale dimensionality of supply chain velocity shown in table 4.2.1. The data was suitable for factor analysis since the Bartlett’s test of Sphericity was p<0.01 and KMO was .746. The total variance of 83.21% was explained using the single factor. The Cronbach’s reliability was .902 indicated good internal consistency of the scale.
Supply chain Visibility
According to Barrat and Oke (2007) supply chain visibility is defined as the degree to which participants in a supply chain possess or exchange information that they deem valuable or useful to their operations and that they anticipate will be advantageous to all parties involved In this research supply chain velocity was measured using three questions which were employed from (Mandal, Sarathy, Korasiga and Bhattacharya and Dastidar, 2016).
Table 4: Factor Analysis results of supply chain visibility
| Item | Score |
| Our supply chain members have access to inventory order status information for forecasting | .869 |
| Our supply chain members have necessary information system for tracking goods | .759 |
| Our supply chain members have the information for monitoring and changing operations strategy | .545 |
| Variance Explained | 67.95% |
| Eigen Value | 2.039 |
| The Kaiser-Mayer-Olkin Measure of Sampling Adequacy | .651 |
| The Bartlett’s Test of Sphericity Reliability | .000 |
| Overall Reliability | .760 |
Source: SPSS output
The principal factor analysis was used to examine the scale dimensionality of supply chain visibility shown in table 4.2.2. The data was suitable for factor analysis since the Bartlett’s test of Sphericity was p<0.01 and KMO was .651. The total variance of 67.95% was explained using the single factor. The Cronbach’s reliability was .760 indicated good internal consistency of the scale.
Supply Chain Versatility
According to Lee (2004) defined supply chain versatility is the ability of a supply chain to quickly and cost effectively adapt to changes in customer demand, market conditions, and other external and internal factors. In this research supply chain versatility was measured using two questions which were employed from (Leonczuk, Ryciuk, Szymczak and Nazarko, 2019).
Table 5: Factor Analysis results of supply chain versatility
| Factor | Loadings |
| The supply chain can handle non-standard orders and satisfy special customer requirements | 0.757 |
| The supply chain is capable of providing products in different variants | 0.757 |
| Variance Explained | 78.69% |
| Eigen value | 1.574 |
| The Kaiser-Mayer-Olkin measure of sampling adequacy | 0.500 |
| The Bartlett’s test of Sphericity Reliability | 0.000 |
| Cronbach’s Alpha | 0.729 |
Source: SPSS output
The principal factor analysis was used to examine the scale dimensionality of supply chain visibility shown in table 5 The data was suitable for factor analysis since the Bartlett’s test of Sphericity was p<0.01 and KMO was .500. The total variance of 78.69% was explained using the single factor. The Cronbach’s reliability was .729 indicated good internal consistency of the scale.
Validity Tests
The researchers tested the collected data for both convergent and discriminant validity. These types of validity ensure that the measurement includes relevant items that accurately represent the concept being studied, and the results provide an accurate depiction of the topic at hand (Boudreau, Gifen and Staub, 2001). According to Heale and Twycross (2015) validity refers to how accurately a concept is measured.
Convergent Validity
According to Steenkamp and Trijp (2009) convergent validity assesses how consistent or similar individual items are in measuring the same concept, and determines how accurately a test evaluates the intended construct.
Table 6: Convergent validity
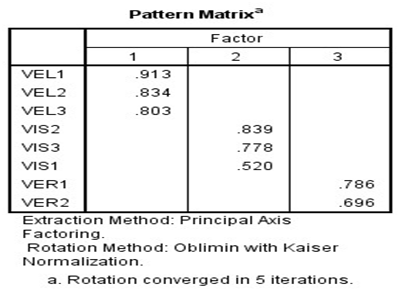
Table 6 displays the pattern matrix indicating the convergence of items within each variable under a single factor. The first factor includes items related to supply chain velocity, the second factor includes items related to supply chain visibility and the third factor includes items related to supply chain versatility.
Discriminant Validity
According to Churchchill (1979) discriminant validity is a distinction obtained between measurements of an underlying concept. Discriminant validity is important in research because it prevent different factors from being mistakenly grouped together.
Table 7: Discriminant validity
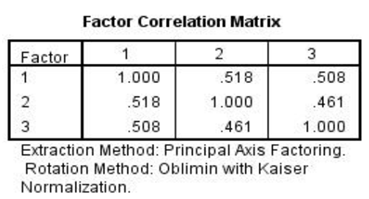
To confirm that the items have distinct characteristics, a factor correlation matrix was employed. The variables were all below 0.8 implying that there is discriminant validity among the items. This suggests that the constructs were measured as intended.
Reliability
Reliability refers to how well the different questions or measurements that relate to a certain concept agree with each other (Churchchill, 1979). The study analyzed the reliability of the data collection instruments to check if the questions used to measure the independent variables were consistent and whether they could accurately predict the order fill rate. The study used Cronbach’s alpha to measure internal consistency with a minimum threshold > 0.7. Eisinga, Grotenhuis &
Pelzer (2013) explained that Cronbach’s alpha determines how closely related a set of items are as a whole. The reliability statistics table displays the value for Cronbach’s alpha.
Table 8: Reliability
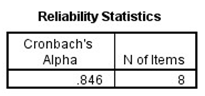
Copper and Schindler (2003) states that the reliability constructs that are considered acceptable must have a score higher than 0.7. The outcomes indicate a reliability level of 0.8 which is higher than 0.7 which suggest a strong internal consistency in relation to the sample, particularly when variables surpass the minimum threshold.
Hypothesis Testing
Multi regression analysis requires the following statistical assumptions: linearity, normality, homoscedasticity and multicollinearity. The results were computed on the SPSS.
Linearity.
Multi regression analysis makes a statistical assumption and seeks to determine whether the relationship between independent variables and the dependent variable is linear or not. A significant deviation value above 0.05 indicates a linear relationship between the dependent variable and independent variables. If the significance deviation is below 0.05, it indicates the absence of a linear correlation between the independent and dependent variable
Table 9: Linearity for supply chain velocity and order fill rate
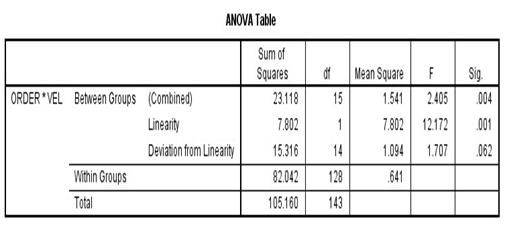
The ANOVA output table indicates that the significant deviation from linearity is .062 which is above the threshold 0.05 p< 001.Hence it can be inferred that there exists a linear correlation between the supply chain velocity and the order fill rate.
Table 10: Linearity for supply chain visibility and order fill rate
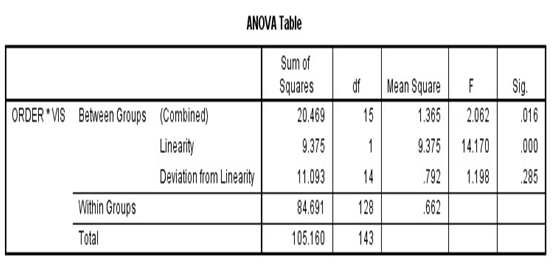
The table indicates that there is a direct correlation between supply chain visibility and order fill rate. This conclusion is supported by the fact that the deviation from linearity is only 0.285, which is not significant enough to indicate a non-linear relationship. Furthermore, the statistical significance of the results is confirmed by a p-value of less than.
Table 11: Linearity for supply chain versatility and order fill rate

The ANOVA output table indicates that the significant deviation from linearity is .319 which is above the threshold of 0.05 p<001. Hence, it can be inferred that there exists a linear correlation between the supply chain versatility and the order fill rate.
Multicollinearity
Multicollinearity in regression analysis happens when two or more predictor variables are strongly correlated with each other, making them redundant in providing unique or independent information in the regression model. This can cause difficulties in fitting and interpreting the regression model, especially when the correlation between variables is high. The variance inflation factor (VIF) identifies multicollinearity by assessing the correlation among predictor variables in a regression model.
Table 12: Multicollinearity
The table above shows variance inflation factor values ranging between 1 and 5 indicate moderate correlation among variables, suggesting that multicollinearity is not a concern in the regression analysis.
Normality
The significance of normality is helpful in comprehending the distribution characteristics and anticipating changes in the dependent variable. A Shapiro- Wilk test was utilized to determine the normality of the data. If the p value is below 0.05 its indicates noteworthy deviation from the normal distribution.
Table 13: Tests of normality
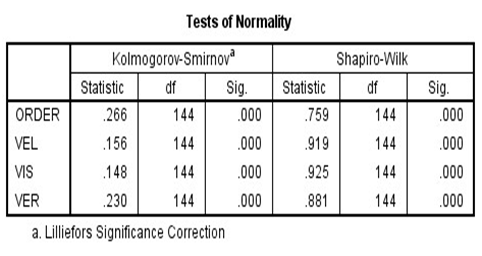
Source: SPSS
Table 13 above shows that the data was not normally distributed between all the variables. The results are all showing significant value of p>.001 which is below 0.05 the minimum threshold of linearity.
Homostedacity
The Levene test for equality of variance examines the assumption that variances are uniform across all samples, particularly when the data is derived from a non –normal distribution test. It is utilized to determine if the variances of two samples are roughly equivalent.
Table 14: Homoscedasticity
| Variable | F | Df1 | Df2 | Sig |
| VEL | 2.405 | 13 | 128 | .004 |
| VIS | 2.062 | 14 | 128 | .016 |
| VER | 3.266 | 8 | 133 | .001 |
Source: primary source
There is a significant result of greater than 0.00, indicating that there is homogeneity of variance. Equal variance is assumed between order fill rate and supply chain visibility of 0.16 which is above .005 indicating equal variance. There is no homogeneity of variance between supply chain velocity and order fill rate because there is a significant value of .004 which is less than 0.00. In addition, there is a less significant result of .001 between supply chain versatility and order fill rate which is less than .05 which means there is no homogeneity of variance in the data
Multiple regression analysis a parametric tool was to be used to analyse the data since the study have one dependent variable and many independent variables. The analysis has assumptions which are linearity, multicollinearity, homoscedasticity, and normality. However, the data failed to meet the normality and homogeneity assumptions of multiple regression analysis and multiple linear regression analysis was used for hypothesis testing.
Hypothesis Tests Results
The study utilized multiple linear regression analysis as a statistical technique to evaluate all the hypotheses. The aim of using multiple linear regression was to determine if there exist a correlation between the dependent variables. If the significance value is less than 0.05, then it implies that the independent variable has a significant impact on the dependent variable, and if the significance value is more than 0.05, then it means that the independent variable does not have a significant impact on the dependent variable.
Table 15: Model summary
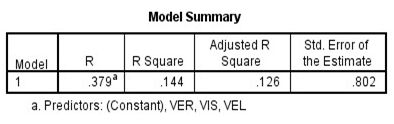
The table above shows the value of R =0.379 whereas the coefficient of determination (R square) is 0.144. This shows that order fill rate is influenced by 14% of supply chain responsiveness elements which are supply chain velocity, supply chain visibility and supply chain versatility.
Table 16: Anova
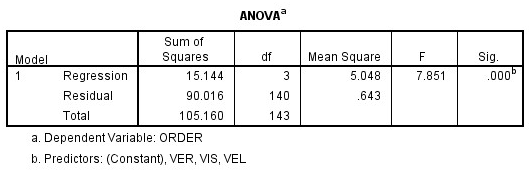
The Anova table illustrates a significance P value of 0.00 which is < 0.05, therefor it can be concluded that multiple regression assumptions can be used to determine a significant relationship between supply chain responsiveness elements and order fill rate. The table shows the F – statistic value of 7.851 which shows that the models where highly significant.
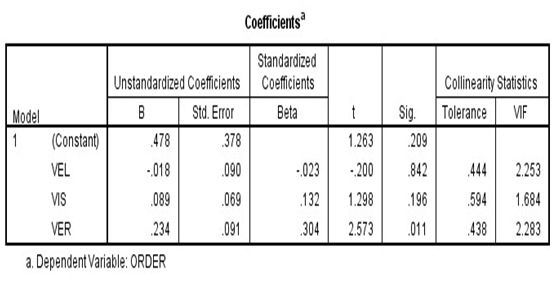
Table 17: Coefficients
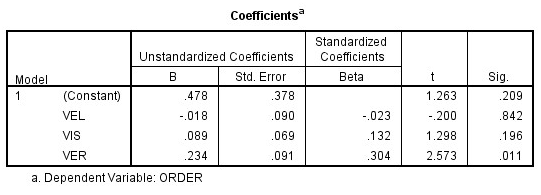
The table above shows that there is an insignificant relationship between supply chain velocity and order fill rate because the (Beta =-.023, p > 0.05 and the t value -.200. The table illustrates that there is an insignificant relationship between supply chain visibility and order fill rate because the (Beta =.132, p > 0.05 and the t value 1.298. The table reveals that there is a significant relationship between supply chain versatility and order fill rate because the (Beta =.304, p< 0.05 and the t value 2.573 therefore we can conclude that there is significant relationship between supply chain versatility and order fill rate.
DISCUSSION
The study aimed at explaining the influence of supply chain responsiveness elements on order fill rate. The supply chain responsiveness elements are supply chain velocity, supply chain visibility and supply chain versatility. The multiple linear regression analysis was used to interpret the hypothesis results. The data failed to meet the normality assumption.
The results showed that there is a negative relationship between supply chain velocity and order fill rate. The reason for this relationship is that companies that focus on increasing supply chain velocity often prioritize speed and efficiency over other factors, such as inventory and order accuracy. This can lead to lower levels of inventory and less time for order processing and verification, which can ultimately result in lower order fill rates. Another reason for a negative relationship is that companies sacrifice quality and this reduce order fill rate. The results are not in with the theory of constraints which suggest that every complex system has at least one constraint that limit its ability to achieve more of its goal. Identifying and managing the constraint an organization can maximize their performance and efficiency. The theory suggest apparel shops should identify and eliminate any bottlenecks in the supply chain that preventing it from achieving maximum velocity. By doing so the company can improve the flow of goods through the supply chain leading to higher order fill rate. Therefore, we can conclude that the theory of constraints was not supported by the findings of the study.
Furthermore, the results showed that there is a positive relationship between supply chain visibility and order fill rate. Apparel shops are encouraged to make sure that participants in a supply chain possess or exchange information that they deem valuable or useful to their operations and that they anticipate will be advantageous to all parties involved. Supply chain visibility projects enables product teams to identify and address shortcomings in the supply chain such as inventory shortages or order fulfillment difficulties, before they escalate into significant issues. The results are in line with the network theory which describe the interactions between a company’s stakeholders, suppliers, clients or the buyer are involved. The application of network theory can enable the development of advanced security measures in the supply chain network, which can significantly enhance the efficiency and performance of the entire supply chain system. The network theory can be used to improve the order fill rate and reduce supply chain risks. The results are similar to a study done by Asamoah, Asare- Bediako & Jacqueline (2023) conducted a research on how supply chain visibility impacts the performance of Ghana Health Service’s supply chain. The study focused on Kumasi Metro Health Directorate and used questionnaires to collect data. The data was analyzed using both descriptive and inferential statistics. The study used descriptive statistics such as mean, standard deviation, frequencies, and percentages. It also conducted regression analysis to determine how supply chain visibility affects supply chain performance. The study found that the Kumasi Metro Health Directorate utilizes information exchange and sharing, asset status knowledge utilization, and enhanced electronic dissemination as measures to improve supply chain visibility. The research discovered that having visibility into the supply chain has a beneficial impact on the supply chain performance of Kumasi Metro Health Directorate. The majority of survey participants showed adequate knowledge of the methods employed to implement supply chain visibility in the organization. Therefore, we can hypothesize that there is a positive relationship between supply chain visibility on order fill rate.
The results showed that there is a positive relationship between supply chain versatility and order fill rate. Apparel shops should be able to quickly and efficiently adjust the various element of a supply chain in order to meet the changing needs of customers. This includes ability to adjust production processes inventory level, distribution, logistics and other components of the supply chain. The results are in line with the Resource based theory which suggest that organization resources are the basis of its competitive advantage. The theory suggests that if apparel shops apply the theory they are able to create and exploit new opportunities in their markets and also they can successfully navigate the changing market conditions. The theory suggest that apparel shops should focus on their internal resources and capabilities to create a more versatile supply chain. Companies can use their resource to develop innovative products and services, building better relationships with suppliers and develop more efficient process. The results are also in line with the study by Sanchez & Perez (2005) investigate how the size of supply chain flexibility is linked to the performance of firms in the automotive industry. This was done by conducting a survey on 126 Spanish automotive suppliers during September and October 2003. A structured questionnaire was sent via mail survey to purchasing managers to collect data. The relationship between various dimensions of supply chain flexibility, firm performance and environmental uncertainty was analyzed using Spearman correlation coefficients. Additionally, a multivariate analysis was conducted to study the factors that determine supply chain flexibility. The study shows that there is a direct correlation between a company’s ability to be flexible and their overall performance. The findings suggest that supply chains operating in unpredictable environments with advanced technology and good communication have better flexibility, but lower interdependence among the supply chain participants.
CONCLUSIONS AND RECOMMENDATIONS
Conclusions: The findings depicted that supply chain responsiveness elements which are supply chain velocity, supply chain visibility and supply versatility has a greater influence on order fill rate. Apparel shops therefore should make all efforts in making sure that necessary resources are available to quickly and efficiently meet customer demand in uncertain market conditions, make sure that actors in supply chain have access to or share information which they consider as key or useful to their operations and which they consider will be of mutual benefit and lastly the apparel shops should improve the flow of goods through the supply chain.
Recommendations
The apparel shops can take the following steps in order to improve their fill rate as well as to enhance order fulfillment efficient by;
- Forecasting demand of their products accurately,
- Establishing efficient inventory management systems,
- Solidifying relationships with vendors and reliable suppliers and,
- Optimizing warehouse operations together with the maintenance of safety stock.
Furthermore, in a bid to ensure a higher order fill rate, Apparel shops are recommended to identify and eliminate any bottlenecks in the supply chain that is preventing it from achieving maximum velocity. By doing so the apparel shops can improve the flow of goods through the supply chain leading to higher order fill rate, However, the findings showed a negative relationship between supply chain velocity and order fill rate meaning that as speed of the supply chain increases, the order fill rate decreases. This can happen if the focus on speed results in sacrificing accuracy and quality in order fulfillment. Therefore, apparel shops are recommended to consider accuracy and quality for them to achieve velocity and order fulfillment.
In line with the conclusions above it is recommended that the apparel shops should make sure that their participants in a supply chain possess or exchange information that they deem valuable or useful to their operations and that they anticipate will be advantageous to all parties involved. To ensure the effectiveness of supply chain visibility, it is essential that data is easily accessible, provided in a timely manner, accurate and delivered in a format that effectively communicates all necessary information Apparel shops should improve their supply chain visibility because they can spot and fix weakness in the supply chain, such as inventory shortfalls or order fulfillment issues before they become major problems. Apparel shops should make sure that they maintain the operational continuity of the supply chain in particularly unfavorable conditions of the environment. Apparel shops should use their resources to develop innovative products and services, building better relationship with supplier and develop more efficient process.
The future research should investigate the influence of supply chain responsiveness which are supply chain velocity, supply chain visibility, supply chain versatility on order fill rate in apparel industry. In addition, researches should also be carried out on other types of the industry to have an appreciation of supply chain responsiveness elements since it is unique and helps companies to gain competitive advantage in the market where competition is stiff. Be that as it may, this research was only dissected to the apparel industry supplying clothes hence the research findings cannot be generalized to other industries due to the nature of the products.
REFERENCES
- Asamoah, K., Asare-Bediako. & Jacqueline, A. (2023). Effects of supply chain visibility on supply chain Performance in Ghana Health Service.The case of Kumasi Metro Health Directorate. Open Journal of Business and Manasereti, 11 437-463
- M., & Oke, A. (2007). Antecedents of supply chain visibility in retail supply chain: A Resource- Based Theory Perspective. Vol 25 PP. 1217-1233
- Barney, J. B., & Grant, R. M. (1991). The resource- based theory of competitive advantage: Implications for strategy formulation. California Management Review, 33(3), 114-135.
- Bhagwat, R., & Sharma, S. (2002). Just-in-time: A tool for cost reduction. Journal of Cost Management, 16(3), 17-24.
- Balcik, B. & Beamon., B.M. (2008). Last mile distribution in humanitarian relief. Journal of Inteligent Transportation System. Vol 11 No.2 PP. 101-121
- Boudreau, M., D. Gifen, and D. W. Straub (2001) “Validation n IS Research: A State-of the- Art Assessment,” MIS Quarterly (25) 1, pp. 1-16
- Carvalho, H., & Azevedo. G. (2012). Agile and resilient approach to supply chain management: Influence on performance and competitiveness. Vol 4 PP. 49 -62.
- Chicksand, D., Watson, G., Walker, H., Radnor, Z. & Johnston, R., (2012). Theoretical perspectives in purchasing and supply chain management: an analysis of the literature. Supply chain management. An International Journal.
- Chopra, S., & Meindl, P. (2010). Supply chain management: Strategy, planning, and operation (4th Ed.). Pearson Education Limited.
- Chopra, S., & Meindl, P. (2012). Supply chain management: Strategy, planning, and operation (5th Ed.). Pearson Education Limited.
- Chopra, S., & Meindl, P. (2016). Supply chain management: Strategy, planning, and operation (6th Ed.). Pearson Education Limited
- Creswell, J. W. (2014) Research Design: Qualitative, Quantitative and Mixed Methods Approaches (4th Ed.). Thousand Oaks, CA: Sage.
- Cooper, D.R., & Schindler, P. S. (2003). Business research methods (8th ed). Boston, MA: McGraw-Hill\Irwin.
- (2019). The Resilient Supply Chain: Speed and Agility in Times of Disruption. Retrieved from https://www.dhl.com/content/dam/dhl/global/core/documents/pdf/glo–core–the–resilientsupply–chain.pdf
- Dubey, R., & Gunasekaran, A. (2014). Mechanics of humanitarian supply chain agility and resilience and its empirical validation. International Journal of Services and Operations Management. Vol 74 PP. 9-12
- Dullaert, N. (2018). Characterizing supply chain visibility –A Literature Review. International Journal of Logistics Management, 29, 308-339.
- Eisinga, R.; Grotenhuis, M.; Pelzer, B., (2013). “The reliability of a two-item scale: Pearson, Cronbach or Spearman-Brown?” International Journal of Public Health.
- Grant, R. M. (1992). Contemporary Strategy Analysis. Oxford, UK: Blackwell.
- Gigerenzer, G., & Goldstein, D. G. (1996). Reasoning the fast and frugal way: Models of bounded rationality. Psychological Review, 103, 650-669.
- Goldratt, E. M. (1984). The goal: A process of ongoing improvement. North River Press
- Gunasekaran, A., Patel, C., & McGaughey, R. E. (2004). A framework for supply chain Performance measurement. International Journal of Production Economics, 87(3), 333–347
- Han, Z. (2016) ‘Research Methodology’. Legal Communication of Chinese Judiciary, pp. 29– 38.
- Heale, R., & Twycross (2015). Validity and reliability in quantitative studies. British Medical (BMJ) Publishers. London, United Kingdom.
- Hearnshaw, E., and Wilson, M., 2013. A complex network approach to supply chain network theory. International Journal of Operations & Production Management.
- Holweg, M. (2005). The three dimensions of responsiveness. International Journal of Operations & Production Management, 25(7), 603-622.
- Idous, and Wilson, (2000). Graphs and Applications. An Introductory Approach. New York:
- Ivanov, D., & Sokolov, B. (2014). Impact of supply chain velocity on supply chain performance. International Journal of Production Economics, 156, 223-234.
- Jamaludin, M., Fauzi, T., & Nugraha, D. (2021). A system dynamics approach for analyzing supply chain industry: Evidence from rice industry. Uncertain Supply Chain Management, 9 (1), 217-226.
- Juttner, U., Maklan S., (2011). Supply Chain Resilience in the Global Financial Crisis: An Empirical Study, Supply Chain Management: An International Journal”, 16 (2011)/4, pp. 246259.
- Kahneman, D., & Tversky, A. (2000). Choices, values, and frames. New York: Cambridge University Press.
- Khan, N.A. (2014). Impediments to JIT implementation in textile industry. International proceedings of economics development and research.
- Ramadas, K., & Raman, A. (2013). The impact of Supply Chain Agility on the relationship between supply chain integration and performance.
- Lanchester, B.S., 2005. Economic Models, University of Southampton, UK
- Lee, H. L. (2004). The triple-A supply chain. Harvard business review, 82(10), 102-113.
- Leedy, P.D., & Ormrod, J. E. (2015). Practical research. Planning and design. Boston, MA: Pearson.
- Leonczuk, D., Ryciuk, U., Szymczak, M., & Nazarko, J. (2019). Measuring performance of adaptive supply chains. SMART Supply Network, 89-110.
- Malhotra, N. K. 2007. Marketing research: An applied orientation, Upper Saddle River, NJ: Pearson Prentice Hall.
- Mandal, S., Sarathy, R., Korasiga, V. R., Bhattacharya, S., & Dastidar, S. G. (2016). Achieving supply chain resilience: The contribution of logistics and supply chain capabilities. International Journal of Disaster Resilience in the Built Environment.
- Nyoni, M. (2012). Influx of second hand clothes chokes textile industry. Newsday, (online) pp. 12. Available at: https\www.newsday.co.zw\2017\07\12\influx-second-hand-clothes-chokes textile.
- Okore, C. A., & Kibert, Y. (2019). Influence of Information sharing on supply chain performance in the tourism industry in the country government of Kakamega, Kenya. The Strategic Journal of Business & Change Management, 6(2) 66-81.
- Oppenheim, A. N. (1992). Questionnaire design, interviewing and attitude measurement. Continuum.
- Park, S., Braunscheidel, M.J. and Suresh, N.C. (2023). The performance effects of supply chain agility with sensing and responding as formative capabilities, “Journal of Manufacturing Technology Management,
- Pettit, T. M. (2008) Supply chain resilience: Development of a conceptual framework, an assessment tool and an implementation process. PhD Thesis. Graduate school of the Ohio State University.
- Preffer, J., & Salancik, G. (1978). The external control of organizations: A resource dependence perspective. California: Stanford University Press.
- Porter, M. E. (1998). Competitive advantage: Creating and sustaining superior performance. Free Press.
- Sanchez, A.M. and Perez, M. (2005), “Supply chain flexibility and firm performance: a conceptual model and empirical study in the automotive industry”, International Journal of Operations and Production Management, Vol. 25 No. 7, pp. 681-700
- Saqib, A. Z., Saqib, K. A., & Ou, J. (2020). Role of visibility in supply chain management. In S.A Rehman Khan, & S.I. Sumer (Eds) Modern perspectives in Business Applications. Intech open.
- Saunders, M., Lewis P., Thornhill, A. (2005) Research methods for business students
- Saunders, M. N. K., Lewis, P. and Thornhill, A., (2009). Research Methods for Business Students 5th Edition. London: Pearson Education.
- Segars, A. (1997), ‘Assessing the Unidimensionality of measurement: A paradigm and illustration within the context of information systems research’, Omega 25(1), 107121.
- Simon, H. A., & Chase, W. G. (1973). Skill in chess. American Scientist, 61, 394-403.
- Steenkamp, J. B.E., van Trijp, H, C.M. (2009). Global branding: A perspective on the challenges and opportunities. International Journal of Research in Marketing, 26(2), 89-97.
- Somapa, S., Cools, M., & Dullaert, W. (2018). Characterizing supply chain visibility –A Literature Review, International Journal of Logistics Management, 29, 308-339.
- Soramaki, K. (2015). Network theory in finance. Journal of Network Theory in Finance.
- Stevens, S. S. (1946). On the theory of scales of measurement. Science, 103(2684), 677-680
- Tang, X. L. (2013). Vulnerability evaluation of multimedia subsystem based on complex network,” Journal of Multimedia.
- Tsironis, L. K., & Matthopoulos, P. P. (2015). Towards the identification of important strategic priorities of the supply chain network. Business Process Management Journal, 21 (6), 1279–1298
- Tukumuhabwa, B.R., & Stevenson, M. (2015). Supply Chain Resilience: definition review and theoretical foundation for further study. International Journal of Production Research. Vol 10 PP. 1-33.
- Um, J. (2017). The impact of supply chain agility on business performance in a high level customization environment. Operations management research, 10. Pp.10-19.
- Yongxia, L. (2014). Networked analysis approach of supply chain network. Journal of Networks.