
Analysis of Environmental Factors Affecting the Quality of Life of Residents in Ikwerre Local Government Area of Rivers State, Nigeria
- Franklin Eze Aribodor
- Dr. Jenny Ntamark
- 51-62
- Jun 28, 2024
- Urban and Regional Planning
Analysis of Environmental Factors Affecting the Quality of Life of Residents in Ikwerre Local Government Area of Rivers State, Nigeria
Franklin Eze Aribodor* & Dr. Jenny Ntamark
Department of Urban and Regional Planning, University of Uyo, Uyo, Nigeria
*Corresponding Author
DOI: https://doi.org/10.51244/IJRSI.2024.1106005
Received: 18 April 2024; Revised: 14 May 2024; Accepted: 18 May 2024; Published: 28 June 2024
ABSTRACT
This study analysed the environmental factors that affect quality of life in Ikwerre Local Government Area of Rivers State, Nigeria. The study was guided by three research questions and hypotheses. The study adopted a qualitative and quantitative survey research design. The population of the study area was 469,788 persons, as projected in the 2022 population. A sample of 400 respondents was selected to represent the population of Ikwerre local government area. The sample size was determined using the Taro Yamane formula, while stratified random sampling was used to pick the respondents. Quantitative data from the questionnaires was coded and entered using Statistical Package for Social Sciences (SPSS) version 25. Frequency, percentages, means, and standard deviation were used to answer the research questions, while the hypotheses were tested using analysis of variance (ANOVA), linear regression, and multiple regression at the 0.05 level of significance. The study revealed, among others, that multiple regression coefficient (R) was 0.44 and 0.41, indicating a moderate and significant relationship between the environmental factors and the quality of life of residents in Ikwerre Local Government Area of Rivers State respectively. Furthermore, there is no significant variation in residents’ perceptions of the quality of life across localities in Rivers State’s Ikwerre Local Government Area (sig. = 0.00 > 0.05, F = 4.17, df = 382). Based on the findings, the environmental implication of the study is that it will motivate environmentalists to maintain green space, natural settings, and man-made recreational resources, such as walking trails, cycling areas, and swimming pools, which are advantageous to physical activity and quality of life.
Keywords: Quality of life, perception, environmental factors, green space, recreational facilities
INTRODUCTION
The term quality of life (QOL) was coined in the United States after World War II. At first, it meant “the good life” and was limited to having or not having typical consumer goods. Good QOL meant affluence—having a car, a house of one’s own, or other commodities. It was a “have” category. The concept gradually evolved, and its range widened to encompass life satisfaction, the realisation of one’s needs and aspirations, and modifying one’s environment to better cope with them. In other words, the QOL concept gradually evolved from “have” to “be.” Consequently, a high quality of life was reserved for the healthy. Only a healthy society, so the argument went, could produce material and cultural goods and enable people to use them, achieving a high level of development that is the mark of a better quality of life (Pacione, 2003).
QOL has also been defined as an individual’s appraisal of his/her own life situation within a specific time span (Chris and Kathy, 2006). In other words, it is the review of a piece of one’s life which takes place between the human subject on the one hand and the things which have an result on him/her from the external environment and the internal environment (his/her own body) on the other hand. The concept, Quality of Life, (QOL) encompasses the basic conditions of life, including adequate food, shelter, and safety, as well as “life enrichers”, which are based on the individual’s values, beliefs, needs and interests. Measuring quality of life entails an assessment of quality within people’s lives and enhancement of the things that that already, or could, add quality to people’s lives. It also infers a deliberate action to improve the things that currently detract from quality of people’s lives (WHO-IACCID, 2000).
The search for quality of life, particularly in the city, has occupied post-industrial and predominantly urbanized societies (such as the United States of America and Great Britain) for more than 40 years. This has led to drive to measure the concept of QOL in urban areas (Senecal, 2002) who argued that, the concept of quality of life, as applied to the urban environment, is usually understood in two ways. The first concerns the living environment and involves the patterns of advantages, disadvantages and opportunities that affect each citizen through accessibility to services, facilities and amenities. Other elements of the living environment include economic vigour and social interest, which enclose an infinite number of specific issues, notably, the quality and affordability of housing. The second approach relates to the natural environment in urban spaces. This approach holds that such factors as air, water, soil quality; and the amount of available green space affect the ways we live (Senecal, 2002). Senecal (2002) further added that other aspects that may be used to identify quality of life include aesthetic value, satisfaction with one’s home, and patterns of governance and there are also issues of perception that take into account people’s experiences in the city, the routes they travel, and the sensory quality of their surroundings.
Nowadays, cities have become the target of quality of life measurement since they display contemporary culture, ranging from technological development to social progress. Indeed, the process of urban planning and environmental management is aimed at raising quality of life, especially with regard to improvement of facilities and services that fulfil socio-economic needs such as education, health, housing, entertainment, and safety. The natural environment from evolution was divinely structured to meet the needs, interest and healthy living condition of man devoid of hazardous consequences. However, human insatiable needs necessitated by the thirst for economic empowerment has negatively impacted on the environment.
Human activities geared towards improvement of the environment and quality life that meets international standard of industrialization have resulted in the alteration of the natural landscape and ecosystem. Consequently, the pre-industrialization peaceful relationship between the environment and human existence, now poses threat to the quality of life. From peripheral, lateral and analytical perspectives, daily human efforts for economic empowerment and improved quality and healthy living condition through incursion into natural environment have negatively impacted on quality of life (Susniene and Jurkauskas, 2009).
In the same vein, human unguided practices, mal-administration, inappropriate legislation and instability of interest in the environment have led to unguided combustion, noise pollution, indiscriminate blockage of drainages, pollution, wrong sitting of life stock farms among others. The widespread of these sharp, unguided and greedy practices has threatened the quality of life of people in the environment. The interest of this study was to investigate how the level of quality of life of the residents, the environmental factors, and the residents’ perceptions of quality of life influence the quality of life of residents of Ikwerre Local Government Area. The level of quality of life entails not only the availability of basic human needs but also the level of the overall well-being of individuals in terms of physical health, mental health, social relationships, and personal fulfilment. The environmental factors include the quality of air, water, and land, as well as access to green spaces and recreational facilities. Lastly, residents’ perceptions of quality of life entail their subjective evaluation of their well-being and satisfaction with their living conditions, which is often influenced by factors such as safety, community engagement, and cultural opportunities in the local government area. Understanding and addressing these factors is crucial for creating sustainable and equitable communities that promote the quality of life for all residents, regardless of their socioeconomic status, gender, educational level, or religion. Based on these, researcher tends to investigate the environmental attributes that affect the quality of life of residents in Ikwerre Local Government Area of Rivers State.
STATEMENT OF PROBLEM
The dependence on the environment for support for human life is integral to our survival and has been since the beginning of time. The environment practically shapes the quality of our lives, as it influences our access to food and water, safe housing, and other amenities necessary for a life of dignity. As such, today, our environment continues to experience numerous challenges posed by modern industry and technology, such as climate change, air pollution, waste disposal, resource depletion, and so on, which have had devastating effects on ecosystems and the well-being of people, particularly those in low-income communities who are often unable to access the resources that would allow them to adapt and protect themselves against the worsening impacts of these changes. As such, assessment of the quality of the environment has become a priority when determining the quality of life in any area.
Ikwerre Local Government Area, just like other areas in Rivers State, Nigeria, is facing immense environmental challenges. With its rise in population as a result of rural-urban migration, Ikwerre Local Government Area is facing disturbances to the natural environment caused by increased human activity. According to Gaibie and Davids (2009), the area grew from 5,000 people in 1915, two years after its inception, to 79,634 in 1953, and to 179,563 in 1963. Also, the 1991 census listed the city’s population as 440,399, and the 2006 census estimated it at 541,115. The population was projected from the census figure of 2006 to a population of 963,373 in 2010, thus giving an indication of impressive population growth over the years.
Consequently, the problems that accompany such growth in an area like Ikwerre LGA, which is largely rural with few developed urban areas, are numerous, ranging from population increase, occupancy ratio, inadequate housing to overcrowding and traffic congestion, which result in deteriorating environmental quality such as air and water pollution. Some of the problems these could pose to the quality of human life include increase economic growth, growing demand of jobs, lack of housing and schools, lack of infrastructure leading to poor living, political turmoil, a decrease in air quality due to pollution caused by increased vehicle traffic, an increase in water pollution caused by the use of contaminated or untreated water for domestic use, an increase in crime rates due to the influx of people to the area, and a strain on infrastructure due to the high demand for services such as electricity and waste management.
Environmental factors like air and water pollution can have a negative impact on public health, leading to an increase in the risk of diseases such as respiratory illness, cancer, and other serious illnesses. Irrespective of these health issues, the Rivers State government has not taken sufficient steps to address these issues in a timely manner. For example, despite the formation of a task force to combat illegal crude refining, which has resulted in the spread of black soot in the atmosphere, which is known to cause respiratory illnesses, the actions of both local and state governments have been ineffective in curbing the activities of these illegal refineries and improving the quality of the air in the area.
With these challenges posing a very serious threat to the quality of life in Ikwerre LGA, there is an urgent need for effective planning and development strategies that take into consideration the needs of all stakeholders. However, to achieve that, the first step is to carry out an analysis of the quality of life in the area in order to identify the root causes of these problems and then develop targeted solutions that can be implemented to improve the quality of life in Ikwerre LGA. It is against this backdrop that the study investigated the environmental factors that affect quality of life in Ikwerre Local Government Area of Rivers State, Nigeria.
THE STUDY AREA
The Ikwerre Local Government Area is located along the coast of southern Nigeria at latitudes 5°0’0”N and 6°50’0”E and longitudes 5°10’0”N and 7°0’0”E. It is one of the burgeoning urban centres in the Niger Delta region. The northern border of Ikwerre Local Government Area is shared with Imo State, and the southern border is shared with Obio/akpor Local Government Area in Rivers State. It is bounded in the west by the Emuoha Local Government Area of Rivers State and east by the Etche Local Government Area of Rivers State. Environmental services in the Ikwerre local government area have taken account of the aspects of human health (including quality of life) that are determined by physical, chemical, biological, social, and psychosocial factors in the environment. Environmental health services help in creating and maintaining good public health and environmental quality within the Ikwerre local government area, ensuring such basic health requirements as the availability of clean water, clean air, safe food, etc. for the citizenry.
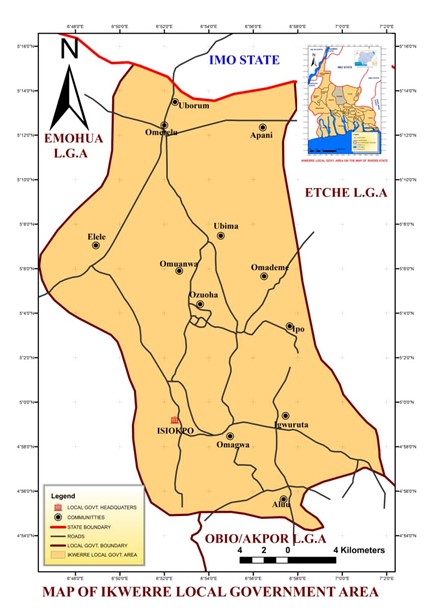
Figure 1: Map of Ikwerre Local Government Area showing the study areas
Source: https://www.researchgate.net/figure/map-of-rivers-state-showing-its-coastal-location
REVIEW OF RELATED LITERATURE
The meaning of the phrase “urban quality of life” differs a good deal as it is variously used but, in general, it is intended to refer to either the conditions of the environment in which people live (air and water pollution, or poor housing, for example), or to some attribute of people themselves (such as health or educational achievement) (Pacione, 2003). Lotfi and Solaimani (2009) stated that a number of researchers have reviewed literature on Quality of Life (QOL) and there is general agreement that a meaningful definition of QOL must recognize that there are two linked dimensions to the concept, namely a psychological one and an environmental one.), (Lotfi and Solaimani, 2009) argue that “a person’s QOL is dependent on the exogenous (objective) facts of his or her life and the endogenous (subjective) perceptions he or she has of these factors and of himself or herself.” There are two sets of indicators for measuring quality of life with which most of the researchers are agreed. The first set comprises objective indicators which refer to the objective and visible aspects of urban life and are defined by different elements, for example the number of hospitals in a city, unemployment rate, the volume of crime and the area of urban green spaces. The second set comprises subjective indicators which try to measure and quantify the citizens’ satisfaction with those objective attributes (Lotfi and Solaimani, 2009).
Green space in urban areas constitutes an environmental determination to improve both physical and psychological health, enhance the quality of living and resilience in urban areas and promote sustainable lifestyles among urban residents (WHO, 2017). It provides access to nature and scenic beauty in urban areas, which may influence physical health (Van, Cerin, Conway, De Bourdeaudhuji, Owen, Kerr, Cardon, Frank, Saelens and Sallis, 2012) psychological health (Dadvand, bartoll, Basagana, Dalmau-Bueno, Martines, Ambros, Cirach, Triguero-Mas, Gascon and Borell, 2016) and environmental health (De Sousa, 2006). The distance to green space has been emphasised as an important factor that affects health. Public spaces in neighbourhoods with man-made recreational resources, such as walking trails, cycling areas and swimming pools, are advantageous to physical activity and contribute to overall feelings about the community and QOL (Ferrans, Zerwic, Wilbur and Larson, 2005).
Okogor (2022) investigated the effects of environmental quality on human health status in Nigeria using the Ordinary Least Square estimation techniques. The findings indicate the existence of a long-run relationship between health as measured by life expectancy and the explanatory variables included. The outcome also demonstrates that CO2 emissions, an indicator for environmental quality significantly reduce life expectancy. More so, income and the linear combination of access to improved water source and access to improve sanitary facility significantly improves life expectancy. In the light of foregoing, consequently, this research recommends that it is important for the Nigerian government to strengthen environmental regulations meant to improve people’s access to a better water supply and sanitary facilities along improved income aimed at bettering health status.
Hall (2008) considered valuation of amenities in urban neighbourhoods and satisfaction with both those neighbourhoods and life in general. First, rents were used to estimate neighbourhood amenities price in San Jose, which explained 39 percent of the standardized variation in rents. Some districts ranked very high in housing characteristics but poorly in neighbourhood amenities, while others ranked poorly in housing characteristics but high in neighbourhood amenities, suggesting that policy measures might reduce inequality in urban areas through improving neighbourhood amenities. Second, the paper explored differences in the valuation of amenities by calculating prices in different urban areas. In more sparsely populated urban areas, distance to national parks was less important, but distance to primary roads became more important. Finally, housing and safety satisfaction represented the key components of life satisfaction.
METHODOLOGY
This study used a survey research design because it allowed the researcher to shed light on current issues or problems through a data collection process that allowed the researcher to describe the situation more thoroughly. The method also described or identified “what” participants believed, felt, or did in relation to the topic under study. The suitability of the design is that it affords the researcher the opportunity to integrate the qualitative and quantitative methods of data collection and analysis.
The population of the study entails households in Ikwerre LGA, Rivers State. According to the data available at the time of this study, the population was made up of an estimated 469,788 people living in 78,269 households in Ikwerre LGA (Source: LGA Demographic Report, 2022).
Using the population projection formula Pt = Po (1+ r)n and a population growth rate of 3.2%, the 1991 population was projected to 2022 as shown in the table below;
Pt = Po (1+ r)n
Where Pt = population year to be projected, 2022
Po = population base year, 1991
1 = constant
r = population growth rate
n = number of years the projection period cover
Table 5.1 Zones and Population Distribution
| Population Distribution | ||||
| Zones | Towns | 1991 | 2022 | Sample Size |
| Zone A | ||||
| 1 | Omerelu | 9450 | 25090 | 21 |
| 2 | Apani | 5659 | 15025 | 13 |
| 3 | Ubima | 10800 | 28674 | 24 |
| 4 | Elele | 40000 | 106201 | 36 |
| Zone B | ||||
| 1 | Umuanwa | 9250 | 24559 | 39 |
| 2 | Isiokpo | 8733 | 23186 | 46 |
| 3 | Ozuoha | 14100 | 37436 | 32 |
| 4 | Igwuruta | 22200 | 58942 | 50 |
| Zone C | ||||
| 1 | Omademe | 9050 | 24028 | 20 |
| 2 | Omagwa | 9500 | 25223 | 30 |
| 3 | Ipo | 7750 | 20577 | 18 |
| 4 | Aluu | 10950 | 29073 | 33 |
| Zone D | ||||
| 1 | Umuoji | 4300 | 11417 | 7 |
| 2 | Umuayemele | 3200 | 8496 | 7 |
| 3 | Umuope | 3300 | 8762 | 7 |
| 4 | Uturu | 3300 | 8762 | 7 |
| 5 | Uborum | 3200 | 8496 | 7 |
| 6 | Umudiala | 2200 | 5841 | 5 |
| Total | 177,442 | 469,788 | 400 | |
Source: Researcher’s Projection, 2022
Example; Population projection of Umuanwa town from 1991 to 2022 where the base population is given as 9450
Pt = Po (1+ r)n
Pt = 9250[1 + 3.2/100]31
= 9250[1 + 0.032]31
= 9250[1.032]31
= 9250[2.65503723437]
= 24559(Projected population of Umuanwa to 2022)
Primary data consisted of household surveys, interviews, and field observations. A carefully designed questionnaire was used for collecting data for the study, among respondents in the selected communities using the systematic sampling technique. 400 copies of structured questionnaires were administered to the selected households. The questionnaire was structured to measure the effect of socioeconomic attributes and environmental attributes on the quality of life among residents in Ikwerre Local Government Area of Rivers State. Secondary Data consisted of sources such as journal articles, the internet, papers presented at conferences, and reports from ministries, government agencies, and environmental agencies. Population figures for the study area were obtained from the National Population Commission (NPC) in Rivers State, while population estimates and sample size were statistically determined.
Quantitative data from the questionnaires was coded and entered using Statistical Package for Social Sciences (SPSS) version 25. Research questions were answered using descriptive statistics such as frequency, percentages, means, and standard deviation, while hypotheses were tested using multiple regression analysis and analysis of variance (ANOVA) at the 0.05 level of significance
FINDINGS AND DISCUSSION
1. Level of Quality of Life of the Residents in Ikwerre Local Government Area
The result showed that the total satisfaction of the residents in the Ikwerre local government area of Rivers State is below average, with significant areas of improvement needed in infrastructure, economic opportunities, environmental sustainability, security and safety, social cohesion, and access to basic amenities. However, the tested hypothesis one revealed that there is a significant variation in the level of quality of life of the residents in the Ikwerre local government area. These findings imply that the quality of life of the residents is not uniform and that there are certain areas or groups within the community that may be experiencing a higher or lower quality of life than others.
Table 1: Mean distribution of the level of quality of life of the residents in Ikwerre local Government Area
| S/N | Items | Respondents ( n = 400) | |||||||
| VH | H | L | VL | Mean | Std. D | Rank | Decision | ||
| 1. | Access to basic amenities such as clean water, electricity, and healthcare | 38 | 31 | 188 | 143 | 1.91 | 0.90 | 8th | Disagree |
| 2. | Availability of quality education for all age groups | 29 | 43 | 187 | 141 | 1.90 | 0.86 | 9th | Disagree |
| 3. | Sustainable economic opportunities and employment | 21 | 161 | 123 | 95 | 2.27 | 0.88 | 5th | Disagree |
| 4. | Adequate infrastructure, including roads and transportation | 95 | 61 | 153 | 91 | 2.40 | 1.08 | 4th | Disagree |
| 5. | Access to markets for goods and services | 114 | 235 | 27 | 24 | 3.10 | 0.76 | 2nd | Agree |
| 6. | Social cohesion among members of the community | 36 | 29 | 194 | 141 | 1.90 | 0.88 | 9th | Disagree |
| 7. | Environmental sustainability and conservation efforts | 23 | 72 | 171 | 134 | 1.96 | 0.86 | 6th | Disagree |
| 8. | Security and safety of residents | 43 | 36 | 175 | 146 | 1.94 | 0.94 | 7th | Disagree |
| 9. | Sustainable agricultural system | 189 | 140 | 59 | 12 | 3.27 | 0.82 | 1st | Agree |
| 10. | Efficient waste management and sanitation systems | 36 | 205 | 76 | 83 | 2.49 | 0.92 | 3rd | Disagree |
| Grand Mean | 2.31 | ||||||||
Source: Field Data (2022)
(Criterion Mean = 2.5, Mean: 1.0-2.49 =Disagree, 2.5-4.00=Agree
VH= Very High H= high L= low VL= very low
The findings are consistent with the study of Wokekoro and Owei (2014), which revealed from their study that residential quality of life was low with garbage on the streets. There was no street lighting, and periodic flooding occurred in the neighbourhoods. The study revealed that 16.4% of the residents were unhappy with their residential quality of life, and 49.2% of the residents perceived their neighbourhoods to be of medium quality.
2. Environmental Factors Affecting the Quality of life of Respondents in the Ikwerre Local Government Area
The result showed that the majority of the respondents in the Ikwerre local government area are aware of the negative impact of air pollution, inadequate waste management, and poor urban planning on their quality of life. However, water pollution and deforestation, among others, seem to have a lesser impact on their quality of life compared to other environmental factors. Furthermore, the tested hypothesis three revealed that there is a significant relationship between the environmental factors and the quality of life of residents in the Ikwerre Local Government Area.
Table 2: Environmental factors affecting the quality of life of residents in Ikwerre Local Government Area
| S/N | Villages | AP | WP | DEF | SE | IWM | CC | NP | LB | PUP | OS | n |
| 1. | Omerelu | 20 | 7 | 8 | 3 | 16 | 2 | 9 | 9 | 14 | 0 | 21 |
| 2. | Apani | 12 | 7 | 6 | 1 | 10 | 2 | 5 | 5 | 8 | 0 | 13 |
| 3. | Ubima | 23 | 7 | 10 | 5 | 17 | 2 | 10 | 10 | 15 | 0 | 24 |
| 4. | Elele | 31 | 14 | 16 | 6 | 23 | 4 | 12 | 12 | 19 | 0 | 33 |
| 5. | Umuanwa | 37 | 14 | 16 | 6 | 29 | 4 | 16 | 16 | 25 | 0 | 39 |
| 6. | Isiokpo | 43 | 21 | 20 | 6 | 35 | 6 | 18 | 18 | 29 | 0 | 46 |
| 7. | Ozuoha | 30 | 11 | 12 | 6 | 23 | 2 | 13 | 13 | 21 | 0 | 32 |
| 8. | Igwuruta | 48 | 17 | 24 | 9 | 35 | 6 | 19 | 19 | 29 | 0 | 50 |
| 9. | Omademe | 18 | 9 | 8 | 3 | 15 | 2 | 8 | 8 | 13 | 0 | 20 |
| 10. | Omagwa | 29 | 12 | 16 | 6 | 20 | 4 | 10 | 10 | 16 | 0 | 30 |
| 11. | Ipo | 17 | 7 | 8 | 3 | 13 | 2 | 7 | 7 | 11 | 0 | 18 |
| 12. | Aluu | 31 | 14 | 15 | 5 | 24 | 4 | 13 | 13 | 20 | 0 | 33 |
| 13. | Umuoji | 7 | 0 | 1 | 1 | 6 | 0 | 4 | 4 | 6 | 0 | 7 |
| 14. | Umuayemele | 6 | 7 | 3 | 0 | 7 | 2 | 3 | 3 | 5 | 0 | 7 |
| 15. | Umuope | 7 | 0 | 5 | 1 | 2 | 0 | 1 | 1 | 2 | 0 | 7 |
| 16. | Uturu | 6 | 3 | 0 | 0 | 7 | 0 | 5 | 5 | 7 | 0 | 7 |
| 17. | Uborum | 7 | 4 | 6 | 1 | 4 | 2 | 1 | 1 | 2 | 0 | 7 |
| 18. | Umudiala | 6
(1.6%) |
0 | 2 | 2 | 4 | 0 | 3 | 3 | 4 | 0 | 6 |
| Total for Yes | 378 | 154 | 176 | 66 | 290 | 44 | 157 | 157 | 246 | 0 | ∑400 | |
| % of Yes | 94.5% | 38.5% | 44% | 16.5% | 72.5% | 11% | 39.25% | 39.25% | 61.5% | 0 | ||
| Total for No | 22 | 246 | 224 | 334 | 110 | 356 | 243 | 243 | 154 | 400 | ||
| % of No | 5.5% | 61.5% | 56% | 83.5% | 27.5% | 89% | 60.75% | 60.75% | 38.5% | 100 |
Source: Field Data (2022) [Displayed Responses were for those who indicated “Yes”]
| AP= Air pollution | WP= Water pollution | DEF= Deforestation |
| SE= Soil erosion | IWM=Inadequate waste management | CC= Climate change |
| NP= Noise pollution | LB= Loss of biodiversity | PUP= Poor urban planning |
| OS= Oil spills |
The implication of the environmental factors on the quality of life of residents in the area suggests that not much attention has been given to addressing water pollution and deforestation in the area, despite their potential impact on the health and well-being of the residents. The result was supported by Sahin et al. (2019), whose study revealed that because of the high level of obsolescence and physical deterioration in the locality, there is usually a very low level of economic conditions and a poor social life that takes place in such locality.
3. Residential Perception of the Quality of Life in Ikwerre Local Government Area
The result showed that the overall perception of the quality of life in Ikwerre Local Government Area of Rivers State is below average, with the respondents indicating dissatisfaction with various aspects of their livability, particularly in the aspect of education, healthcare, sanitation, security, employment opportunities, government support, and political stability. Furthermore, the tested hypothesis four revealed that there is evidential variation in the residential perception on quality of life in Ikwerre Local Government Area.
Table 3: Mean distribution of residents’ perception of the quality of life in Ikwerre Local Government Area
| S/N | Items | Respondents ( n = 400) | |||||||
| SA | A | D | SD | Mean | Std. D | Rank | Decision | ||
| 1. | The level of security in my community is satisfactory | 38 | 31 | 188 | 143 | 1.91 | 0.90 | 6th | Disagree |
| 2. | There is tolerable basic amenities such as water and electricity | 103 | 116 | 105 | 76 | 2.62 | 1.07 | 2nd | Agree |
| 3. | The road network in my area is adequate | 86 | 150 | 90 | 74 | 2.62 | 1.02 | 2nd | Agree |
| 4. | The cost of living is relatively affordable | 140 | 84 | 114 | 62 | 2.76 | 1.10 | 1st | Agree |
| 5. | There are reasonable employment opportunities in my area | 26 | 16 | 199 | 159 | 1.77 | 0.81 | 8th | Disagree |
| 6. | The healthcare system in my area is up to standard | 36 | 29 | 194 | 141 | 1.90 | 0.88 | 7th | Disagree |
| 7. | The educational system in my area is up to standard | 23 | 72 | 171 | 134 | 1.96 | 0.86 | 4th | Disagree |
| 8. | The level of cleanliness and sanitation in my community is satisfactory | 43 | 36 | 175 | 146 | 1.94 | 0.94 | 5th | Disagree |
| 9. | There is a high level of political stability in my area | 13 | 12 | 215 | 160 | 1.70 | 0.68 | 10th | Disagree |
| 10. | The level of government support and intervention in my community is commendable | 12 | 35 | 197 | 156 | 1.76 | 0.74 | 9th | Disagree |
| Grand Mean | 2.09 | ||||||||
Source: Field Survey, 2022
(Criterion Mean = 2.5, Mean: 1.0-2.49 =Disagree, 2.5-4.00=Agree
The findings are consistent with the study of Wokekoro and Owei (2014), which revealed from their study that residential quality of life, was low with garbage on the streets. There was no street lighting and periodic flooding occurring in the neighbourhoods. The study revealed that 16.4% of the residents were unhappy with their residential quality of life and 49.2% of the residents’ perceived neighbourhoods to be of medium quality. Also, the result was supported by Sahin et al. (2019), whose study revealed that because of the high level of obsolescence and physical deterioration in the locality, there is usually very low level of economic conditions and poor social life that takes place in such locality.
CONCLUSION
The result of the study stated that the quality of life in Ikwerre Local Government Area of Rivers State is poor. The outcome, however, can be directly or indirectly attributed to factors like the extent of availability of portable water, electricity availability, the quality and reliability of the government, the quality of recreational facilities, the cleanliness of the area, and access to waste disposal facilities, among others. With respect to the brisance of these challenges on the quality of life of residents, it is imperative for the Rivers State government, especially the Ikwerre Local Government Council, to initiate action to address such environmental challenges. Presently, there seems to be little or no evidence that the Rivers State government has established policies and programmes for addressing such environmental challenges to the satisfaction of the people.
RECOMMENDATIONS
With the findings in this study, it proposes that; The Ikwerre Local Government Council should focus their efforts on providing basic infrastructure and services such as communication systems, fire station, gas systems, public works, transportation systems, educational centres/school systems, power, water supply systems, health facilities, and improved sanitation in order to enhance the gratification residents in the area. The Ikwerre Local Government Council should take proactive steps to mitigate the impact of these environmental hazards by improving the drainage systems, regulating toxic emissions from industrial facilities, and increasing public awareness about proper waste disposal and management.
REFERENCES
- Adedimeji, A.A and Odutolu, O. (2007) Care support and quality of life outcomes among persons living with HIV in the HAART Era; http://www.hsph.harvard.edu
- Chor,H. C., and Wai, F. K.,(2006). Influence of school accessibility on housing values Journal of Urban Plan Development., 132 (3), 120-128
- Chris, L., Jim, H and Kathy, T (2006) What makes a city livable? Social Indicators Research 6(2), 17-26.
- Dadvand, P.; Bartoll, X.; Basagana, X.; Dalmau-Bueno, A.; Martinez, D.; Ambros, A.; Cirach, M.; Triguero-Mas, M.; Gascon, M.; Borrell, C. (2016). Green spaces and General Health: Roles of mental health status, social support, and physical activity. Int, 91(3), 161–167.
- De Sousa, C.A. (2006). Unearthing the benefits of brownfield to green space projects: An examination of project use and quality of life impacts. Local Environ. 11(2), 577–600.
- Ferrans, C.E.; Zerwic, J.J.; Wilbur, J.E.; and Larson, J.L. (2005). Conceptual model of health-related quality of life. Nurs. Scholarsh, 37(3), 336–342.
- Gaibie, F. and Davids, Y. D. (2009). Quality of life among South Africans. A Paper Presented at the IX ISQOLS Conference on Quality of Life Florence Italy 19-23, July
- Hall,L, J., Madrigal, R., and Robalino, J.(2008). Quality of life in urban neighborhoods in Costa Rica. Inter-American Development Bank, Latin American Research Network, Research Network Working Paperiadb.org/res/publications/pubfiles#R-563.
- Lotfi, S., and Solaimani, K. (2009). An assessment of urban quality of life by using analytic hierarchy process approach (Case study: Comparative study of quality of life in the North of Iran). Journal of Social Sciences 5(2), 123-133.
- Marmot, M., and Wilkinson, R. G., (2006). Social determinants of health. Oxford University Press.
- Okogor,C. (2022). Effects of environmental quality on human health status in Nigeria. AUDOE, 18(5), 227-239
- Oyeleke, A.I., and Tangwe, P.T. (2017). Factors influencing quality of life among rural populace in Nigeria. Journal of Economics and Behavioral Studies, 9(3), 133-140.
- Owczarek, K. (2010) Concept Of Quality Of Life, Medical University Of Warsaw, Warsaw Poland. www.researchgate.net
- Pacione, M. (2003). Urban environmental quality and human wellbeing—a social geographical perspective. Landscape and Urban Planning (65) 19–30.
- Senecal, G. (2002). Urban spaces and quality of life: Moving beyond normative approaches. Environmental Research Journal, 4(3) 222-228.
- Song, Y. and Knaap, G. (2004). Measuring the effects of mixed land uses on housing values. Reg. Urban Econ., 34 , 663-680
- Susnienė, D., and Jurkauskas, A. (2009). The concepts of quality of life and happiness – correlation and differences. Engineering Economics, 7(3), 58-66.
- Van Dyck D, Cerin E, Conway TL, De Bourdeaudhuij I, Owen N, Kerr J, Cardon G, Frank LD, Saelens BE, and Sallis JF (2012). Perceived neighbourhood environmental attributes associated with adults’ transport-related walking and cycling: Findings from the USA, Australia, and Belgium. Int J Behav Nutr Phys Act, 9(2), 70-83.
- WHO-IASSID WORK PLAN (2000). Quality of life its conceptualization measurements and application: A Consensus Document. The special interest research group on quality of life. The International Association for the Scientific Study of Intellectual Disabilities.
- World Health Organisation (2017). Urban green spaces: A Brief for Action, 2017. https://www.euro.who.int/en/health-topics/environment-and-health/urbanhealth/publications/2017/urban-green-spaces-a-brief-for-action.
- Wokekoro, E. and Owei, O.B. (2006). “Environmental Indicators of Derelict Housing in Nigerian Cities case Study of Port Harcourt, Rivers State. A Paper Presented at the International Conference on Infrastructure Development and the Environment (ICIDEN), Abuja Nigeria. September 10 – 15, 2006.