
Exploring the Extent to which Primary Healthcare (PHC) Workers are Satisfied with the Nature of Services Provided to Clients in Abia State, Nigeria
- Elekeh, Rosemary Ichita
- Uka-Kalu, Ezinne C.
- Elekeh Benjamin O.
- 566-575
- Aug 8, 2024
- Health
Exploring the Extent to Which Primary Healthcare (PHC) Workers are Satisfied with the Nature of Services Provided to Clients in Abia State, Nigeria
*1Elekeh, Rosemary Ichita; 1Uka-Kalu, Ezinne C.; 2Elekeh Benjamin O.
1Department of Public Health, Abia State University, Uturu
2National Open University of Nigeria.
*Corresponding Author
DOI: https://doi.org/10.51244/IJRSI.2024.1107043
Received: 13 June 2024; Revised: 25 June 2024; Accepted: 29 June 2024; Published: 08 August 2024
ABSTRACT
Primary health care (PHC) is the backbone of a health system. It refers to “essential healthcare” that is based on scientifically sound and appropriate technology. PHC is the initial point of contact with the health care system for most Nigerians. This study aimed to assess the level of satisfaction of PHC workers as regards the natures of the services provided to clients in Abia State, Nigeria. The study employed a descriptive cross-sectional survey design in exploring the satisfaction level of primary healthcare workers on the nature of services rendered to clients in Abia State primary healthcare centers. A semi-structured questionnaire which was self-administered was used to collect information from 486 healthcare providers in the selected PHCs across the senatorial zones studied. The educational qualification distribution of the PHCs staff in the zones showed that a good number of the participants 155 (34.9%) came from zone 1, p<0.05 and the workers included a mix of doctors, nurses, and other heathcare workers. Healthcare workers distribution in the senatorial zones showed that medical officers were only 9 (1.9%) medical officers, and this was recorded in zone 2, p<0.05. A good number 203 (43.4%) of the participants who had more years of experience were in the age group of 11-19, p<0.05. Overall, the level of satisfaction among workers and the supply of essential drugs was found to be statistically significant across Zones in Abia State.
Keywords: Primary healthcare; Healthcare workers; Services satisfaction; Abia State.
INTRODUCTION
Usually, the quality of healthcare services of health workers in primary healthcare centers (PHCs) can increase the level of utilization of the services and thereby, improve the health status of people in the communities. According to Gyuse et al. (2018), the types and nature of healthcare services provided by most PHCs affect the rate of utilisation of the services. Realizing that the goal of PHCs is to provide acceptable, accessible, and affordable health care services to individuals in their communities, the researchers suggested that PHCs should maintain the recommended service standards that will justify the efficiency and effectiveness of the services provided. However, the extents to which the minimum standards for the effective and efficient provision of healthcare services to clients in primary healthcare centres are followed are not clear. This is why it is necessary to assess the extent to which healthcare services provided in PHCs are utilised to achieve optimum health care and a reduction in mortality rates of preventable diseases in society. In Nigeria, inadequate financing often mars healthcare service delivery and management, resulting in lower levels of coverage and quality services (Abdulraheem et al., 2012). As a result, many writers have criticised the effectiveness of Nigeria’s health system for years. For example, studies conducted by Christian Aid in some selected states in Nigeria in 2015 found that some PHCs provide less than 20% of health care services to potential clients because some facilities are either in states of disrepair, absent, or obsolete. These have made referral systems almost nonexistent, resulting in individuals seeking health care services at the terminal stages of their disease conditions.
The fact that Nigeria’s primary health care system doesn’t meet the minimum standards for effective health service delivery (Quartz, 2018) is one of the biggest problems in the country’s health sector. As a result, primary healthcare service delivery appears to be atrocious. Studies showed that Nigeria’s primary healthcare system remains among the worst-performing health systems globally (Ananaba, 2018). This is because of the low coverage of promotional and preventive interventions in most primary healthcare centres due to a lack of adequate resources. Thus, the present study explored the opinions of the primary healthcare workers on their perceptions of the nature and quality of services provided to various clients in the study area.
METHODOLOGY
The study was conducted in the PHCs in the Abia State of Nigeria. Hence, the population of the study consisted of the PHC centres and their healthcare workers in Abia State. Abia State is one of the thirty-six (36) states located in the southeast part of Nigeria (Aga, 2009). Abia is mainly populated by the Igbo ethnic group. The Igbo people, who are one of the indigenous peoples of the southeast part of Nigeria, make up 95% of the population. Their traditional language, Igbo, is in widespread use. English is also widely spoken and serves as the official language in governance and business. Abia State has three (3) senatorial zones, namely, Abia South, Abia Central, and Abia North, with seventeen (17) local government areas (LGAs) scattered across the senatorial zones.
However, within the 17 LGAs, there are 571 PHCs in these zones. Specifically, the Abia South senatorial zone comprises the Aba North local government area (9 PHCs), the Aba South local government area (32 PHCs), the Obingwa local government area (35 PHCs), the Osisioma local government area (25 PHCs), the Ugwunagbo local government area (19 PHCs), the Ukwa East local government area (22 PHCs), and the Ukwa West local government area (30 PHCs). Abia Central comprises the entire geographical areas of Ikwuano Local Government Area (36 PHCs), Isiala-Ngwa North Local Government Area (37 PHCs), Isiala Ngwa South Local Government Area (37 PHCs), Umuahia North Local Government Area (39 PHCs), and Umuahia South Local Government Area (33 PHCs), with a total of 182 PHCs within these LGAs. While Abia North comprises the entire geographical areas of Arochukwu Local Government Area (69 PHCs), Bende Local Government Area (29 PHCs), Isuikwuato Local Government Area (41 PHCs), Ohafia Local Government Area (37 PHCs), and Umu-Nneochi Local Government Area (31 PHCs), with a total of 217 PHCs within its LGAs.
A cross-sectional descriptive survey study was used to assess the quality and nature of healthcare services in PHCs. Hence, a quantitative research method was adopted. The sample for the study is made up of 486 health workers, comprising a total of six healthcare workers in each of the selected PHCs. The techniques for selecting the sample were simple random sampling procedure and quota. From the 3 senatorial zones studied, simple random sampling by balloting was used to select 3 LGAs in each of the zones. This means that a total of 9 LGAs were selected for the study. From each of the 3 LGAs, chosen in each zone, 9 PHCs were selected in each LGA, giving a total of 27 PHCs studied in a zone. This implies that 81 PHCs were used for the study. A semi-structured questionnaire was used to obtain data from the 486 health workers on the nature and quality of healthcare services in their respective PHCs. The questionnaire was constructed in a way that it sought information on the extent to which PHC workers are satisfied with the nature of services they provide, and suggestions for improvement. The study was conducted between 2021-2023.
The method of data collection was self-administered questionnaire. The contents of the questionnaire were critiqued by professional experts in Public Health. This means that the instrument was subjected to face, content, criterion, and construct-related validity to determine whether the instrument will collect the required information. Thereafter, clarity and appropriateness of the questions to elicit accurate information that enabled the researcher to address the research aim were done to ascertain the reliability of the instrument. In doing so, a test- retest method was done using 20 healthcare workers that were not part of the sample for study. Twenty sets of the questionnaire were self-administered to the 20 healthcare workers. The questionnaire was analysed and all ambiguities noticed in the questions were fine-tuned for clarity. Thereafter, the fine-tuned questions were also self- administered to another 20 health workers not part of the study group. The data collected were compared with the initial one to see the consistency in the responses. The two scores obtained were used to compute the correlation co-efficient which gave the estimate of the reliability of the instrument. Quantitative data collected was analysed with the aid of the Statistical Package for Social Sciences (SPSS) version 26 and relevant descriptive statistics were used. The frequency distributions of all relevant variables were represented in tables and charts. Mean and standard deviation were calculated, and the test of significance was carried out using the appropriate statistical test with statistical significance set at a p-value of less than 0.05.
RESULTS AND DISCUSSIONS
A total of 486 health workers were recruited for the study with a response of rate of 468 (96.3%). Table 1 shows the distribution of the Local Government Areas by their different zones. Abia South, which is zone 1 consist of Aba North, Aba South and Ugwunagbo LGAs. Abia Central which is Zone 2 and comprises of Umuahia North, Umuahia South and Ikwuano LGAs. Abia North, which is Zone 3 comprises of Bende, Isiukwuato and Ohafia LGAs.
Table 1: Local Government Areas (LGAs) by zones studied.
| LGA/Zones | Abia South | Abia Central | Abia North | Total |
| Zone 1 | Zone 2 | Zone 3 | ||
| Local Government Areas (LGA) | Aba North | Umuahia North | Bende | 3 |
| Aba South | Umuahia South | Isiukwuato | 3 | |
| Ugwunagbo | Ikwuano | Ohafia | 3 | |
| Total | 3 | 3 | 3 | 9 |
Table 2: Level of education of health workers in the PHCs by zones.
| Variable/Zones | PHCs
zone 1 |
PHCs
zone 2 |
PHCs
zone 3 |
Total | Asymptotic significance | |
| Primary | Frequency | 0 | 9 (5.6%) | 0 | 9 (1.9%) | 0.000 |
| Percentage | 0% | 100.0% | 0% | 100.0% | ||
| Secondary | Frequency | 3 (%1.9) | 15 (9.3%) | 6 (4.0%) | 24 (5.2%) | |
| Percentage | 12.5% | 62.5% | 25.0% | 100.0 | ||
| Tertiary | Frequency | 152 (98.1%) | 138 (85.2%) | 145 (96.0%) | 435 (92.9) | |
| Percentage | 34.9% | 31.7% | 33.3% | 100.0% | ||
| Total | Frequency | 155 (100.0%) | 162 (100.0%) | 151 (100.0%) | 468(100.0%) | |
| Percentage | 33.1% | 34.6% | 32.3% | 100.0% | ||
Finding from Table 2 shows that majority of the health workers 435 (92.9%) had tertiary education and 9 (1.9%) health workers which were found in zone 2 had primary education. This was statistically significant, p<0.05.
Table 3: Years of work experience of health workers in the zones.
| Years. of experience | PHCs
zone 1 |
PHCs
zone 2 |
PHCs
zone 3 |
Total | Asymptotic significance | |
| ≤10 years | Frequency | 18 (11.6%) | 47 (29.0%) | 20 (13.2%) | 85 (18.2%) | 0.000 |
| Percentage | 21.2% | 55.3% | 23.5% | 100.0 | ||
| 11 – 19 years | Frequency | 70 (45.2%) | 60 (37.0%) | 73 (48.3%) | 203 (43.4%) | |
| Percentage | 34.5% | 29.6% | 36.0% | 100.0% | ||
| ≥20 years | Frequency | 67 (43.2%) | 55 (34.0%) | 58 (38.4%) | 180 (38.5%) | |
| Percentage | 37.2% | 30.6% | 32.2% | 100.0% | ||
| Total | Frequency | 155(100.0%) | 162(100.0%) | 151(100.0%) | 468(100.0%) | |
| Percentage | 33.1% | 34.6% | 32.3% | 100.0% | ||
Table 3 shows that 203 (43.4%) health workers had 11 to 19 years of working experience while 85 (18.2%) health workers had equal and less than 10 years of working experience. This was statistically significant, p-<0.05.
Table 4: Distribution of health workers’ professions in the PHCs by zones.
| Distribution of HW | PHCs Zone 1 | PHCs
zone 2 |
PHCs
zone 3 |
Total | Asymptotic significance | |
| Medical Doctors | Frequency | 0 | 9 (5.6%) | 0 | 9 (1.9%) | 0.000 |
| Percentage | 0.0% | 100.0% | 0.0 | 100.00% | ||
| Community Health officers | Frequency | 33 (21.3%) | 25 (15.4%) | 50 (33.1%) | 108 (23.1%) | |
| Percentage | 30.6% | 23.1% | 46.3% | 100.0% | ||
| Nurses/Mid-wives | Frequency | 43 (27.7%) | 47 (29.0%) | 40 (26.5%) | 130 (27.8%) | |
| Percentage | 33.1% | 36.2% | 30.8% | 100.0% | ||
| SCHEW | Frequency | 55 (35.5%) | 43 (26.5%) | 47 (31.1%) | 145 (31.0%) | |
| Percentage | 37.9% | 29.7% | 32.4 | 100.0 | ||
| Pharmacy | Frequency | 15 (9.7%) | 20 (12.3%) | 9 (6.0%) | 44 (9.4%) | |
| Percentage | 34.1% | 45.5% | 20.5% | 100.0% | ||
| JCHEW | Frequency | 0 | 5 (3.1%) | 5 (3.3%) | 10 (2.1%) | |
| Percentage | 0.0% | 50.0% | 50.0% | 100.0% | ||
| Environmental officer | Frequency | 9 (5.8%) | 13 (7.4%) | 0 | 21 (4.5%) | |
| Percentage | 42.9% | 57.1% | 0.0% | 100.0% | ||
| Total | Frequency | 155 (100.0) | 162(100.0%) | 151(100.0%) | 463(100.0%) | |
| Percentage | 33.1% | 34.6% | 32.3% | 100.0% | ||
Findings in Table 4 shows that there were no medical officers in zones 1 and 3 and only 9(1.9%) medical officers were recorded in zone 2. A good number of the health workers 145 (31.0%) employed were Senior Community Health Extension Workers (SCHEW) while 9 (1.9%) health workers were Medical Officers. This was statistically significant, p<0.05. Figure 1 shows compound bar charts for all the health workers in the PHCs by zones one simple bar chart which represents medical officers in the PHCs by zone 2. The tallest bar chart was seen among Community health extension workers while the smallest bar chart was seen among the Junior health extension workers.
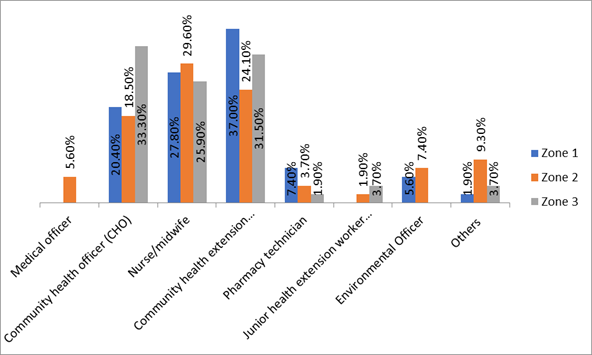
Figure 1: Percentage Distribution of Profession of the PHCs Workers in Abia State (Source: PHCs Survey, 2022).
Table 5: Health workers and level of satisfaction with PHC services by zones.
| Variables | Proportion | PHCs
zone 1 |
PHCs
zone 2 |
PHCs zone 3 | Total | Asymptotic significance | |
| Satisfaction with staff strength | Agree | Frequency | 49(31.7%) | 80(49.4%) | 31(20.5%) | 160 (34.2%) | 0.000 |
| Percentage | 30.6% | 50.0% | 19.4% | 100.0% | |||
| Disagree | Frequency | 106 (68.4%) | 82(50.6%) | 120 (79.4%) | 308 (65.8%) | ||
| Percentage | 34.4% | 26.6% | 40.0% | 100.0% | |||
| Total | Frequency | 155 (100.0%) | 162 (100.0%) | 151 (100.0%) | 468 (100.0%) | ||
| Percentage | 33.1% | 34.6% | 32.3% | 100.0% | |||
| Satisfied with supply of Essential drugs | Agree | Frequency | 116 (76.8%) | 106 (67.1%) | 102 (69.3%) | 324(71.0%) | 0.009 |
| Percentage | 35.8% | 32.7% | 31.5% | 100.0% | |||
| Disagree | Frequency | 35 (23.2%) | 52 (32.9%) | 45 (30.6%) | 132(29.0%) | ||
| Percentage | 25.4% | 49.3% | 25.4% | 67(14.7%) | |||
| Total | Frequency | 151 (100,0%) | 158 (100.0%) | 147 (100.0%) | 456(100.0) | ||
| Percentage | 33.1% | 34.6% | 32.2% | 100.0% | |||
| Satisfied with power supply | Agree | Frequency | 81 (52.2%) | 88 (54.3%) | 50(33.1%) | 219 (46.8%) | |
| Percentage | 37.0% | 40.2% | 22.8% | 100.0% | |||
| Disagree | Frequency | 74 (47.7%) | 74 (45.7%) | 101 (66.9%) | 249 (53.2%) | ||
| Percentage | 29.7% | 29.7.9% | 40.6% | 100.0% | |||
| Total | Frequency | 155(100.0%) | 162(100.0%) | 151(100.0%) | 468(100.0%) | ||
| Percentage | 33.1% | 34.6% | 32.3% | 100.0% | |||
Findings in Table 5 shows that 324 (71.0%) health workers agreed that they are satisfied with the supply of essential drugs while 160 (34.2%) health workers agreed that satisfaction with staff strengths, p-<0.05.
Table 6: Responses from PHC workers on the level of satisfaction with services they provide to clients.
| Variables | Proportion | PHCs
zone 1 |
PHCs
zone 2 |
PHCs
zone 3 |
Total | Asymptotic significance | |
| Satisfied with patient behaviour | Agree | Frequency | 41 (26.4%) | 52 (32.0%) | 18 (11.9%) | 111(23.7%) | 0.000 |
| Percentage | 36.9.% | 46.8% | 16.3% | 100.0% | |||
| Disagree | Frequency | 114 (73.6%) | 110 (67.9%) | 133 (88.1%) | 357 (76.3%) | ||
| Percentage | 30.0% | 38.5% | 31.5% | 100.0% | |||
| Total | Frequency | 152(100.0%) | 162(100.0%) | 151(100.0%) | 468(100,0%) | ||
| Percentage | 33.1% | 34.6% | 32.3% | 100.0% | |||
| Satisfied with the available equipment | Agree | Frequency | 60(39.7%) | 94 (58.0%) | 64 (42.4%) | 218 (47.0%) | 0.002 |
| Percentage | 27.5% | 43.1% | 29.4% | 100.0% | |||
| Disagree | Frequency | 91 (60.3%) | 68 (42.0%) | 87(57.6%) | 246 (53.0%) | ||
| Percentage | 37.0% | 27.6% | 35.4% | 100.0% | |||
| Total | Frequency | 151 (100.0%) | 162 (100.0%) | 151 (100.0%) | 464 (100.0%) | ||
| Percentage | 32.5% | 34.9% | 32.5 | 100.0% | |||
| Satisfied with Laboratory diagnostic services | Agree | Frequency | 48 (30.9%) | 84 (51.9%) | 45 (29.8%) | 177 (37.8%) | 0.000 |
| Percentage | 27.1% | 47.5% | 25.4% | 100.0% | |||
| Disagree | Frequency | 107 (69.0%) | 78 (48.1%) | 106 (70.2%) | 291 (62.1%) | ||
| Percentage | 36.7% | 26.8% | 36.3% | 100.0% | |||
| Total | Frequency | 155 (100.0%) | 162 (100.0%) | 151 (100.0%) | 468 (100.0%) | ||
| Percentage | 33.1% | 34.6% | 32.3% | 100.0% | |||
Findings in Table 6 shows that 218 (47.0%) PHC workers agreed that they were satisfied with the available equipment, p<0.05.
Table 7: PHC workers and level of satisfaction with PHCs environment by zones.
| Variables | Proportion | PHCs
zone 1 |
PHCs
zone 2 |
PHCs zone 3 | Total | Asymptotic significance | |
| Satisfied with the hygienic conditions of PHC environment | Agree | Frequency | 67 (44.1%) | 78 (48.7%) | 48 (32.4%) | 193 (42.0%) | 0.003 |
| Percentage | 34.7% | 40.4% | 24.9% | 100.0% | |||
| Disagree | Frequency | 85 (55.9%) | 82 (51.3%) | 100 (67.6%) | 267 (58.0%) | ||
| Percentage | 31.8% | 30.7% | 37.5% | 100.0% | |||
| Total | Frequency | 152(100.0%) | 160(100.0%) | 148(100.0%) | 460(100.0%) | ||
| Percentage | 33.0% | 34.8% | 32.2% | 100.0% | |||
| Satisfied with water supply in the PHC | Agree | Frequency | 133 (85.8%) | 87 (53.7%) | 98 (64.9%) | 318 (67.9%) | 0.000 |
| Percentage | 41.8% | 27.4% | 30.8% | 100.0% | |||
| Disagree | Frequency | 22 (14.2%) | 75 (46.3%) | 53 (35.1%) | 150 (31.9%) | ||
| Percentage | 14.7% | 50.0% | 35.3% | 100.0% | |||
| Total | Frequency | 155(100.0%) | 162(100.0%) | 151(100.0%) | 468(100.0%) | ||
| Percentage | 33.1% | 34.6% | 32.3% | 100.0% | |||
| Satisfied with the availability of Personal protective equipment (PPE | Agree | Frequency | 110 (70.9%) | 124 (76.5%) | 101 (66.9%) | 335 (71.6%) | 0.113 |
| Percentage | 32.8% | 37.0% | 30.2% | 100.0% | |||
| Disagree | Frequency | 45(29.0%) | 38 (23.5%) | 50 (33.1%) | 133 (28.5%) | ||
| Percentage | 33.8% | 28.6% | 37.6% | 100.0% | |||
| Total | Frequency | 155(100.0%) | 162(100.0%) | 151(100.0%) | 468(100.0%) | ||
| Percentage | 33.1% | 34.6% | 32.3% | 100.0% | |||
Findings on Table 7 shows that 318 (67.9%) PHC workers agreed that they were satisfied with satisfied with water supply in the PHCs, p<0.05.
Table 8: PHC workers and level of satisfaction with staff supervisions by zones.
| Variables | Proportion | PHCs
zone 1 |
PHCs
zone 2 |
PHCs
zone 3 |
Total | Asymptotic significance | |
| Satisfied with extent of staff supervision | Agree | Frequency | 129 (83.3%) | 141 (87.1%) | 135 (90.6%) | 405 (86.9%) | 0.000 |
| Percentage | 31.9% | 34.8% | 33.3% | 100.0% | |||
| Disagree | Frequency | 26(16.8%) | 21 (13.0%) | 14 (9.4%) | 61 (13.1%) | ||
| Percentage | 42.6% | 34.4% | 23.0% | 100.0% | |||
| Total | Frequency | 155(100.0%) | 162(100.0%) | 149(100.0%) | 466(100.0%) | ||
| Percentage | 33.3% | 34.8% | 32.0% | 100.0% | |||
Findings in Table 8 shows 405 (86.9%) health workers agreed that they were satisfied with the extent of staff supervision they provided to clients, p-<0.05.
Findings from this study show that majority of the health workers 435 (92.9%) had tertiary education while only 9 (1.9%) health workers had primary education. The fact that majority of the healthcare workers 92.9% had tertiary education indicate that a good number of the health workers in the PHCs are academically qualified to perform their responsibilities as well as to understand the technicalities involved in their jobs. This finding is similar to those of Uchendu et. al. (2018) and Omoleke et al. (2021) where majority of the health workers had tertiary education.
From the findings of this study, some number 203 (43.4%) of the health workers had long time of working experience up to 11 to 19 years. This contrasts with the study of Omoleke et al. (2021) where all the health workers had fewer years of working experience. The differences in years of working experience may be due to their location of study as this was done in Northwestern Nigeria. It is expected that the longer the work experience of a health workers, the greater the work output, effectiveness and efficiency, the health worker will display.
This study shows that majority of the PHCs lacked medical officers. Some numbers of the health workers 145 (31.0%) employed in PHCs were Senior Community Health Extension Workers (CHEW). The fact that most of the PHCs lacked medical officers shows inadequacies in managing critical cases. This is against PHCs operation where at least medical officers should be resident to manage critical cases and make referrals when necessary. Since majority of healthcare workers are employed in the PHCs are mainly CHEW, this may indicate that they are likely the grade of health workers managing most of cases in PHCs. In this case, one wonders how referrals are made.
This indicated that category of health workers may be the staff handling all health conditions even though they may be above their competences. The findings in these studies portray that in most PHCs management and referral of some cases may be difficult. These underscore the need to engage competent healthcare workers who will provide healthcare services in the PHCs. The findings in these studies are in line with a study in Niger State Nigeria by Koce et al. (2019) and in Iran, by Hamed et al. (2022) where there were acute shortages of human resources. The fact that a good proportion of the healthcare workers were not satisfied with staff strength and patient behaviour shows that the workers may be overworked. This is possible since majority of the workers in PHCs were mainly community health extension workers with little or no presence of other healthcare workers. However, some of the health workers were satisfied with extent of staff supervision, availability of personal protective equipment (PPE) as well as water and power supply in the PHCs. These findings are in consonance with those of Adeyinka et al. (2021), Ofili et al. (2017), Ayamolowo et al. (2018), where they also reported satisfaction with some services observed with PHCs.
CONCLUSION
The level of satisfaction among workers and the supply of essential drugs was found to be statistically significant across Zones in Abia State. The study has provided insights into the perceptions and attitudes of the general population towards primary healthcare services in Abia State. This information is useful for healthcare providers as they strive to improve the quality of care and increase patient satisfaction. For example, healthcare providers need to improve their communication skills, increase community engagement, and address the cultural and social factors that affect the utilization of healthcare services. By understanding PHC workers’ satisfaction levels, policymakers can identify areas where services are lacking or excelling. This information can help in addressing gaps in service provision and improving overall healthcare quality. Insights into worker satisfaction can reveal the need for additional training or professional development programs. Satisfied workers are often better performers, leading to improved client outcomes. Data-driven insights from the study can guide the formulation of policies that address the real needs and challenges faced by PHC workers, leading to more effective healthcare delivery.
REFERENCES
- Abdulraheem, I. S., Olapipo, A. R. & Amodu, M.O. (2012). Primary Health Care services in Nigeria: Critical issues and strategies for enhancing the use by the rural communities. Journal of Public Health and Epidemiology.;4:5–13. 52.
- Adeyinka, A., Esther, O. O. & Omobola Y. O. (2021); Job Satisfaction and Intention of Primary Healthcare Workers to Leave: A Cross-Sectional Study in a Local Government Area in Lagos, Nigeria. Global Journal of Health Science. 13(4) ISSN 1916-9736 E-ISSN 1916-9744 Published by Canadian Center of Science and Education.
- Aga, C. (2009). Nigeria: State by State. Lulu. com.
- Ananaba, A., Sadiq, F. U. & Piron, L. (2018, June 5). Health Finacing in Nigeria. Retrieved from www.perlnigeria.net/storage/casestudies: http://www.perlnigeria.net/storage/casestudies/June2018/vfspJJOnqo 5EVzDF8DnT.pdf.
- Ayamolowo, J. S., Irinoye, O. & Oladoyin, M. A. (2018). Job Satisfaction and Work Environment of Primary Health Care Nurses in Ekiti State, Nigeria: an Exploratory Study. Internanational Journal of Caring Sciences, 531.
- Gyuse, A. N., Ayuk, A. E., & Okeke, M. C. (2018). Facilitators and barriers to effective primary health care in Nigeria. African Journal of Primary Health Care & Family Medicine, 1-3.
- Hamed, R., AliAkbar, H., & Somayeh, N., (2022). A qualitative study of challenges affecting the primary care system performance: Learning from Iran’s experience. Open Access https://doi.org/10.1002/hsr2.568
- Koce, F., Randhawa, G. & Ochieng, B. (2019). Understanding healthcare self-referral in Nigeria from the service users’ perspective: a qualitative study of Niger state. BMC Health Serv Res 19, 209. https://doi.org/10.1186/s12913-019-4046-9.
- Ofili, A. N., Asuzu, M. C., Isah, E. C. & Ogbeide, O. (2017). Job satisfaction and psychological health of doctors at the University of Benin Teaching Hospital. International Journal of Occupational Medicine.54(6): 400-403. https://doi.org/10.1093/occmed/kqh081
- Omoleke, S. A., Usman, N., KanmodI, K. k. & Ashiru, M. M. (2021). Medical waste management at the primary healthcare centres in a northwestern Nigerian State: Findings from a low-resource setting. Published by Elsevier Ltd on behalf of The Royal Society for Public Health.
- Quartz (2018). Nigeria Has Become The Poverty Capital Of The World. Retrieved from https://qz.com/africa/:https://qz.com/africa/1313380/nigerias-has-the-highest-rate-of-extreme-poverty-globally/
- Uchendu, O. C., Ilesanmi, O. S. & Olumide, A. E. (2018). Factors influencing the choice of health care providing facility among workers in a Local Government Secretariat in Southwestern Nigeria. Annals of Ibadan Postgraduate Medicine. 11(2): 87-95.