
Urban Renewal Strategies as a Tool for Enhancing the Quality of Life of residents in Diobu, Port Harcourt, Nigeria
- Bright Godfery Ameme
- Ikezam Innocent Weje
- Emmanuel Chigozie Dike
- 491-499
- Mar 19, 2025
- Environment
Urban Renewal Strategies as a Tool for Enhancing the Quality of Life of residents in Diobu, Port Harcourt, Nigeria
Bright Godfery Ameme1, Ikezam Innocent Weje1, Emmanuel Chigozie Dike1
1Department of Urban and Regional Planning, Rivers State University, Nkpolu-Oroworukwo, Port Harcourt, Nigeria
DOI: https://doi.org/10.51244/IJRSI.2025.12020042
Received: 28 November 2024; Revised: 03 February 2025; Accepted: 06 February 2025; Published: 07 March 2025
ABSTRACT
Urbanization has become a defining global trend since the 20th century, with significant population shifts from rural to urban areas. By 2050, approximately 68% of the world’s population is projected to reside in urban areas, driven primarily by rapid urbanization in Asia and Africa. This demographic transformation presents critical challenges, including urban decline, infrastructure obsolescence, and socio-economic disparities, which necessitate innovative urban renewal strategies. Urban renewal, encompassing the restoration and revitalization of urban spaces, aims to address these challenges while improving physical, social, and economic conditions. Sustainable development, aligned with the United Nations Sustainable Development Goal 11, is essential to ensure these efforts contribute to long-term urban quality of life. This study examines the urban decay and renewal prospects in Diobu, a densely populated low-income neighbourhood in Port Harcourt, Nigeria. With over 80% of its housing stock dating back to the mid-20th century, Diobu faces challenges such as overcrowding, inadequate infrastructure, poor waste management, and high crime rates. Through a cross-sectional survey design and mixed-methods approach, data were collected from 374 households across three sub-areas: Mile 1, Mile 2, and Mile 3. Findings reveal poor living conditions, characterised by inadequate facilities and environmental degradation. Despite these challenges, a notable proportion of residents expressed attachment to the area, citing social networks and affordability. The study proposes an urban renewal strategy incorporating a 25–30-year phased redevelopment plan. Central to this initiative is the establishment of the Diobu Urban Renewal Authority (DURA), tasked with managing redevelopment, compensation, and resettlement to minimize displacement and social disruption. The integration of sustainable practices, such as enhanced infrastructure, green spaces, and economic revitalization, is vital. By aligning urban renewal efforts with community needs, this framework aims to transform Diobu into a liveable, resilient, and inclusive urban environment.
Keyword: Urban renewal, quality of life, Neighbourhood area, redevelopment
INTRODUCTION
Urbanization became the dominant way of life in the twentieth century as urban growth led to an increasing proportion of the global population residing in urban areas. Since the 1980s, the rapid trend of urbanization has become a noteworthy phenomenon in both developed and developing nations, emerging as a global concern due to the expansion of large urban agglomerations (Agbola, 2007). According to the United Nations Human Settlements Programme (2004), approximately 50% of the world’s population resides in urban areas. This figure is projected to rise to 60% by 2030. In 2018, the United Nations Department of Economic and Social Affairs (UNDESA) reported a significant increase in the global urban population, from 751 million in 1950 to approximately 4.2 billion in 2018. At present, urban areas house about 55% of the global population, with projections indicating that this proportion will increase to 68% by 2050. Moreover, it is estimated that urbanization, combined with rapid population growth, could add an additional 2.5 billion people to the global urban population by 2050, with nearly 90% of this increase occurring in Asian and African countries (UNDESA, 2018).
Urban renewal is a systematic process of transforming assets and restoring urban areas (Sun & Hong, 2017). Antonio Zumelzu (2021) identified three key historical phases of urban renewal. The first phase, in the early 1930s, was marked by physical determinism, focusing on improving the urban environment. The second phase, starting in the 1960s, emphasized neighbourhood rehabilitation to address social issues. The third phase, beginning in the 1970s, adopted a business-oriented approach to revitalizing city centres, prioritizing economic development. Urban renewal initiatives typically involve physical changes to the urban environment aimed at improvement. These changes can include infrastructure development, the creation of green spaces, the establishment of economic hubs, and the replacement of abandoned buildings with new ones. Local legislation often regulates urban renewal projects, setting specific guidelines for urban planning and management based on the scale and location of the renewal.
The primary goal of urban renewal is to address urban challenges and achieve long-lasting improvements in a city’s physical, environmental, social, and economic conditions (Roberts & Sykes, 2000). In practice and theory, urban renewal combines social welfare improvements, business redevelopment, and sustainable development objectives. As urban areas face increasing challenges such as environmental pollution, social fragmentation, economic recessions, and the deterioration of urban functions, urban renewal has garnered global attention (Almeida et al., 2018; Tin & Lee, 2017; Zheng, Shen, & Wang, 2014). Urban renewal initiatives aim to improve infrastructure, enhance land value, reduce environmental degradation, and revitalize urban economies (Peng et al., 2015; Ho et al., 2012). These initiatives should align with sustainable development principles, as outlined in the United Nations Sustainable Development Goal 11 and the New Urban Agenda. Implementing sustainable development at the neighbourhood level is crucial because neighbourhoods are the foundational components of urban areas (Rohe, 2009; Choguill, 2008). Most redevelopment projects begin at this spatial scale, making neighbourhoods essential for fostering sustainable urban development (Sharifi & Murayama, 2013).
The concept of urban quality of life highlights the complex interplay between city management, neighbourhoods, and residents. It depends on the interconnected components of urban spaces and their impact on residents’ lives (Sertutxa et al., 2014). Urban quality of life is assessed through both subjective and objective measures. Subjective measures focus on individuals’ perceptions and experiences, while objective measures rely on quantifiable indicators of physical and social conditions (Tsuyoshi Takano et. al (2023). These assessments consider housing, employment, green spaces, public transport, family income, safety, sanitation, and the built environment (Teklay, 2012). Indicators provide critical insights into changes in quality of life over time. Examples include the availability of open spaces (Luttik, 2000), accessibility to health facilities (Leby & Hashim, 2010), and access to essential services such as schools and hospitals (Furtado, 2011). Effective urban renewal initiatives can significantly enhance the quality of life by addressing these indicators.
Urban renewal initiatives profoundly affect urban spaces and the quality of life of residents (Serag et al., 2013). For instance, in Diobu, Port Harcourt, urban decline has resulted in deteriorated physical infrastructure, loss of social cohesion, and a high prevalence of social issues such as crime, alcoholism, and juvenile delinquency. At least 80% of the housing stock in Diobu dates to the 1950s and 1960s. Baadom Livinus E (2019), leading to widespread obsolescence, overcrowding, inadequate waste management, poor access roads, and insufficient social services. This combination of physical and social challenges has classified Diobu as a slum. To address these challenges, urban renewal initiatives in Diobu should focus on physical, social, and economic transformations to improve neighbourhood conditions, enhance quality of life, and promote sustainable development. By prioritizing neighbourhood-scale interventions, urban renewal can effectively contribute to achieving long-term sustainability goals.
MATERIAL and METHOD
Study Area
The study area is located in Diobu community, which includes Rumuwoji (Mille 1), Mgbundukwu (Mile 2), and Nkpolu-Oroworukwo (Mile 3). This is located at latitudes 4.772152 and 4.78817, and longitudes 6.994514 and 6.99064 (see Figure 1). Diobu is one of the major indigenous enclaves within the urban fabric of Port Harcourt. According to the 1991 population census, the population of the city of Port Harcourt was 406,738 (National Population Commission, 1992), of which 65% were squatters (Obinna et al., 2010). In addition to the socio-economic pathological conditions that characterised them (including a high crime rate, urban gangs, and juvenile delinquency), these settlements were not planned, had deplorable housing, lacked space, and were not provided with basic services (Obinna et al., 2010). Diobu was a densely populated area, mostly regarded as low-income (Wokekoro & Inyang, 2007). The study area is home to numerous traditional markets, small grocery stores, and the major roads, which used to be in bad condition (Kio-Lawson & Dekor, 2014) but have been periodically improved upon by successive administrations of Rivers State.
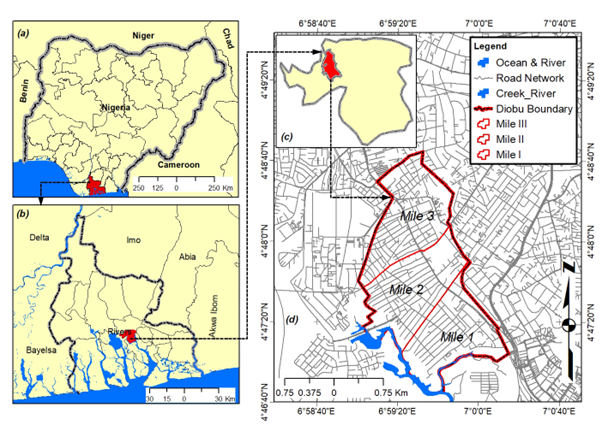
Figure 1. Map showing (a) Nigeria (b) Rivers State with LGA (C) Port Harcourt City LGA (d) Study Area
Methods
This study utilised a cross-sectional survey design, which is a type of observational research that analyses data across a sample population at a specific point in time. The fundamental purpose of this approach is to identify characteristics that are present among participants but cannot be employed to establish cause-and-effect relationships between various variables. In order to achieve the overall aims and objectives of this study, a mixed-methods research approach is adopted (Cresswell, 2014). This mixed-method approach includes a quantitative approach, which accounts for (a) a survey of the conditions of the housing stock and (b) a sample survey of households to obtain residents’ socio-demographic attributes and their perceptions of living conditions. The qualitative component entails interviewing key informants, such as the directors and senior staff of Development Control at the Rivers State Ministry of Physical Planning and Urban Development.
In order to ascertain the total building stock in the study area, a preliminary residential building (housing unit) survey was carried out by ground truthing through the use of a handheld Global Positioning System (GPS) and Google Earth imagery of the study area. This enabled the study to identify building usage in the entire study area and number code them appropriately. found that the total number of residential buildings (i.e., clusters of households) in Diobu (Miles 1, 2, and 3) was 5,745 (Figure 2), distributed as shown in Table 1. The average number of households per building was found to be six.

Figure 2. Sampling Map, Showing Sample Points
Table 1. Distribution of Residential Buildings (Household Clusters) in the Neighbourhoods of the Study Area
| S/No. | Study Neighbourhoods | Number of Residential Buildings | % |
| 1 | Mile 1 | 2,057 | 35.8 |
| 2 | Mile 2 | 2,539 | 44.2 |
| 3 | Mile 3 | 1,149 | 20 |
| Total | 5,745 | 100 |
Also, this study adopted a cluster sampling approach (Julia Simkus. 2023). This approach leverages probability sampling, a widely used approach for studying wide populations, especially those that are geographically widespread. 374 buildings (household clusters) were selected out of a total of 5,745, representing a sampling fraction of 6.5%. We studied one randomly selected household in each of the 374 selected buildings (clusters of households), meaning that on average, we selected one household out of the six that make up a building or cluster of households. In order to pick the specific buildings to be studied in each neighbourhood. Reference was made to the ordered list of buildings obtained during listing (i.e., the sampling frame). Thus, in the first neighborhood (Mile 1), through the application of the Taro Yamane formula, it had been established that 134 buildings should be studied out of 2,057, i.e., a 1 in 15 sample. At this point, the systematic probability sampling approach J(ulia Simkus. 2023) was employed. This entailed making a random start in the ordered list of buildings for Mile 1 and picking the 15th item thereafter to determine the specific buildings to be studied and achieve the total sample size. Same applied to Miles 2 and 3; also see their locations in the Sampling Map (Figure 2) above.
RESULTS AND DISCUSSION
Socio-Demographic Attributes of Respondents
The study found a middle-aged population in the study area, with 59.4% aged less than 30 years and 49.4% concentrated in the active age cohorts of 20–59 years. The corresponding national population figures for 2022 were 70% and 41.3% (https://www.populationpyramid.net/nigeria/2022/), NPC (2022), suggesting that the national population was more bottom-heavy, i.e., there was more concentration of the population in the active age cohorts in the study area than in the national population, as should be the case in a migrant population.
The cosmopolitan nature of the population was demonstrated by the fact that seven (7) states of the Nigerian Federation were represented. Residents were mainly post-civil war immigrants, following the exodus from the area during the civil war years of 1967–1970. At present, the study area of Diobu is essentially a land of “strangers” because the Ikwerre indigenes of Oro-Abali (Mile 1), Mgbundukwu (Mile 2), and Nkpolu-Oroworukwo (Mile 3) have been gradually but inexorably absorbed into the urban fabric, and it has become increasingly difficult for them to engage in their traditional cultural practices such as dancing, wrestling, masquerading, etc. Modernization and urbanization have introduced a plethora of other social activities.
The rate of unemployment, 45%, was high, significantly higher than the national average of 37% (Nigerian Economic Summit Group, 2003). Female and male unemployment stood at 39.7% and 50.4%, respectively, also higher than the corresponding national averages of 8.81% and 6.12%, underscoring the low socio-economic status of the area. Male and female literacy rates, found to be 47.1% and 39.5%, respectively, were significantly lower than the corresponding national averages of 86.4% and 59.5% (https://www.statista.com/statistics/1124741/literacy-rate-in-nigeria-by-area-and-gender/, March 2023).
Opinion about Neighbourhood
Respondents were asked if they liked their neighbourhood. Most respondents said “Yes’, accounting for 71.6% of the distribution. The reported first, second, and third mentioned reasons for this response are presented in Table 2, the modal reasons among first, second and third mentions were “near my place of work”, 27.3%; “quiet neighbourhood”,12%; and “living near relations and town folks”, respectively.
Table 2. Reasons for Liking the Neighbourhood
| Item | First mentions | Second mentions | Third Mentions | |||
| N | % | N | % | N | % | |
| Near my place of work | 102 | 27.3 | 32 | 8.6 | 27 | 7.2 |
| Rent is cheap | 58 | 15.5 | 9 | 2.4 | 25 | 6.7 |
| Safe neighbourhood | 57 | 15.2 | 39 | 10.4 | 28 | 7.5 |
| Quiet neighbourhood | 24 | 6.4 | 45 | 12 | 28 | 7.5 |
| Living near relations and town folks | 36 | 9.6 | 20 | 5.3 | 29 | 7.8 |
| Clean Neighbourhood | 0 | 0 | 0 | 0 | 14 | 3.7 |
| Non-response | 97 | 25.9 | 229 | 61.2 | 223 | 59.6 |
| Total | 374 | 100 | 374 | 100 | 374 | 100 |
Furthermore, respondents were asked to state reasons why they did not like their neighbourhood. As Table 3. shows, the first, second and third modal mentions were “the neighbourhood is noisy”, “the neighbourhood not safe” and “neighbourhood stinks”, accounting for 50.5%, 13.6% and 11.5% of the distributions, respectively.
Table 3. Reasons for Disliking the Neighbourhood
| Item | First mentions | Second mentions | Third Mentions | |||
| N | % | N | % | N | % | |
| The neighbourhood is noisy | 139 | 50.5 | 42 | 11.2 | 0 | 0 |
| The neighbourhood stinks | 57 | 15.2 | 32 | 8.6 | 43 | 11.5 |
| The neighbourhood is congested | 30 | 8 | 9 | 2.4 | 18 | 4.8 |
| Neighbourhood is not safe | 31 | 8.2 | 51 | 13.6 | 24 | 6.4 |
| Non-Response | 67 | 17.9 | 240 | 64.2 | 289 | 77.3 |
| Total | 374 | 100 | 374 | 100 | 374 | 100 |
Residents’ Perceptions of Living Conditions
The study found that, in general, residents perceived their living conditions negatively, as they were mostly of the opinion that lighting was inadequate, that there was no privacy, that there was noise from neighbours, disturbance from children, inadequate open space, a lack of safety in the compound, and that the compound was dirty and lacked parking facilities. Most of the residents also perceived doors and windows to be loose, that doors and windows lacked paint, and that there were cracked walls and buildings that needed painting. Similarly, regarding neighbourhood conditions, respondents considered that there was noise from traffic, disturbance from youngsters, noise from neighbours, lack of neighbourhood safety, that the neighbourhood was dirty, lacked parking facilities, that there was garbage on the streets, and that there was a complete absence of recreational parks. Nevertheless, the study area was characterized by undeniable vibrancy, even under these conditions of material poverty. Perhaps this attribute has given rise to attachment to the area, as up to 41% of respondents did not desire to move from the area to another location. The finding of attachment to areas considered by experts to be slums or to be substandard is not new. Ron Mahabir, et.al (2016) for instance, found that residents of Aggrey Road and Ndoki waterfront settlements resisted eviction in spite of their manifestly substandard living conditions, reporting as follows:
“These settlements are not planned, lack space and are not provided with basic services. Also rife are such social and economic pathological conditions as overcrowding, poor access roads, juvenile delinquency, alcoholism, prostitution, misery, disease, filth, crime and general environmental decay.”
Similarly, residents of Abonnema Wharf and other waterfront settlements in Port Harcourt Municipality vehemently protested when the Amaechi administration of Rivers State (2007-2015) attempted to evict them from their abject settlements in order to carry out phased redevelopment.

Figure 3. Front Elevation and Floor Plan of Typical Courtyard House
Proposed Redevelopment of Diobu
From its inception, Diobu was designed to serve as a low-income residential area, accommodating the working class employed by colonial trading houses, railways, the civil service, and port-related industries. Weje & Ameme (2018) Developed in the 1950s, the Diobu Layout featured 30m x 15m residential plots with densely packed courtyard-style houses. These homes, designed to house up to 15 households per plot, had an occupancy rate of up to five people per room and covered more than 70% of the plot area. No provisions were made for back gardens or parking, as car ownership among residents was deemed unlikely. Over time, increased car ownership, driven by urban growth and an influx of higher-income residents, has led to significant on-street parking issues. The original housing designs, while functional for their era, have become inadequate to meet modern demands.
The typical Diobu residence was a courtyard-style house with communal toilets and kitchens arranged opposite the living quarters (see Fig. 3). While this design promoted social interaction and a sense of security, it also led to overcrowding and insufficient facilities for the number of residents. Many buildings, constructed in the 1950s and 1960s, are now in a state of disrepair, requiring major renovations, including roof repairs, window and door replacements, and repainting. Despite these challenges, Diobu remains vibrant. Residents exhibit strong attachments to their neighbourhoods, valuing the social connections and sense of community they provide. However, a portion of the population-primarily low-income, moderately educated male tenants-expresses a willingness to relocate in search of better living conditions.

Figure 4. Proposed Landuse Plan for a Selected Segment of Diobu
To address these issues, the Rivers State Government should embark on a comprehensive urban renewal project for Diobu (Mile 1, Mile 2, and Mile 3), guided by the proposed future land-use plan outlined in Figure 4. This effort would aim to improve the area’s infrastructure, housing, and overall quality of life while preserving the social fabric. A key component of the redevelopment strategy is the creation of the Diobu Urban Renewal Authority (DURA), a government agency under the Rivers State Ministry of Urban Development and Physical Planning. DURA would be tasked with planning and executing the urban renewal process over a 25-30year period.
The agency would employ a team of professionals, including urban planners, architects, engineers, estate surveyors, and legal experts. These professionals would ensure the smooth administration of redevelopment efforts and compliance with urban planning regulations.
Core Responsibilities of DURA
- Property Compensation: Fair and timely compensation for properties acquired or demolished during redevelopment.
- Resettlement Management: Organizing the relocation of evictees to prevent homelessness and minimize the risk of social unrest.
Relocating residents will be one of the most sensitive aspects of the renewal process. Many residents are deeply connected to their neighbourhoods, with strong ties to family, friends, and businesses. To encourage cooperation, a well-structured incentive program should be implemented, offering financial or logistical support for relocation. Moreover, involving residents in decision-making processes will help reduce resistance and foster trust.
Urban renewal in Diobu will require substantial funding. A combination of public-private partnerships (PPPs), government-funded projects, and investments from private entities will be essential. International organizations, such as UN-Habitat, should also be engaged to share expertise and experiences from similar initiatives worldwide. The redevelopment of Diobu envisions a transformation into a sustainable and vibrant urban community. Over the next 25-30years, this project aims to address pressing challenges such as overcrowding, poor infrastructure, and inadequate housing, while fostering economic growth and improving residents’ quality of life.
CONCLUSION
The study highlights the rapid urbanization and its associated challenges within the context of Diobu, Port Harcourt, emphasizing the socio-economic and infrastructural decline that characterises the area. Diobu, originally designed as a low-income residential area, has evolved into a densely populated urban slum marked by deteriorating physical structures, inadequate social services, and socio-economic issues such as high unemployment and literacy rates significantly below national averages. Despite these challenges, the area retains a unique vibrancy and sense of community, with many residents demonstrating attachment to their neighbourhoods. Urban renewal is presented as a critical solution to address the challenges faced by Diobu, focusing on improving living conditions, infrastructure, and socio-economic opportunities while integrating sustainable development principles. The proposed Diobu Urban Renewal Authority (DURA) is expected to play a central role in planning and implementing the renewal process. Legislative and institutional frameworks will be crucial to ensuring that redevelopment initiatives are executed effectively and equitably.
Key recommendations include:
- Comprehensive Urban Renewal: Redevelop Diobu in line with sustainable development goals, focusing on improving housing, infrastructure, and public amenities while preserving community vibrancy.
- Stakeholder Engagement: Include residents in planning processes to foster community buy-in and address relocation challenges.
- Legislative Backing: Establish a dedicated urban renewal authority with legal and administrative capacity to manage redevelopment efforts.
- Incentives for Resettlement: Provide adequate compensation and resettlement packages to mitigate resistance and ensure the socio-economic stability of affected residents.
Through strategic implementation of these recommendations, urban renewal in Diobu can transition the area into a sustainable, functional, and vibrant urban environment, enhancing the quality of life for its residents and aligning with broader urban development goals.
REFERENCES
- Ahianba, J. E., & Okogun, G. R. A. (2008). Built environment decay and urban health in Nigeria. Journal of Human Ecology, 23(4), 259–265. https://api.semanticscholar.org/CorpusID:112357454
- Antonio Zumelzu (2021) Analytical Methodologies Concerning Historic Neighbourhoods For Urban Renewal In Southern Chile. How To Understand The Place To Intervene?, Journal Of Architecture And Urbanism, 10.3846/jau.2021.12894, 45, 1, (60-72), (2021).
- (2019). Urban renewal: Meaning, process, pros, cons, & examples. Planning Tank.
- Baadom Livinus E., West, Tamunomiete, and Needam, Yiinu B. (2019) The Influencing Factors of Urban Slum in Port Harcourt, Nigeria. International Academy Journal of Administration, Education and Society. Volume 6, Issue 1, PP 20-26, ISSN: 2382-9035, August, 2019. https://arcnjournals.org/images/ASA-IAJAES-6-1-3.
- Bao, S. (1986). Architecture and environment. China City Planning Review, 2(4), 56–61.
- Bello, V. A., & Nwosu, A. E. (2011). Effects of urban renewal on residential property values in two neighborhoods of Akure, Nigeria. FUTY Journal of the Environment, 6(2), 37–47.
- Boyd, A. (1962). Chinese architecture and town planning. London: Tiranti.
- Casault, A. (1987). The Beijing courtyard house. Open House International, 12(2), 31–41.
- Castells, M., Goh, L., & Kwok, R. Y.-W. (1990). The Shek Kip Mei syndrome: Economic development and public housing in Hong Kong and Singapore. London: Pion Limited.
- Couch, C., & Dennemann, A. (2000). Urban regeneration and sustainable development in Britain: The example of the Liverpool Ropewalks Partnership. Cities, 17(2), 137–147. https://doi.org/10.1016/S0264-2751(00)00008-1
- Couch, C., Sykes, O., & Borstinghaus, W. (2011). Thirty years of urban regeneration in Britain, Germany, and France: The importance of context and path dependency. Progress in Planning, 75(1), 1–52.
- Creswell, J. W. (2014). Research design: Qualitative, quantitative, and mixed methods approaches (4th ed.). Thousand Oaks, CA: Sage.
- De Sousa, C. A. (2008). Brownfields redevelopment and the quest for sustainability (Vol. 3). Emerald Group Publishing.
- Obinna, V. C. (2018). Housing as an aspect of social policy making.
- Victor, C. O., Opuenebo, O., Precious, E., & Ojumoro, A. (2009). Housing stress and urban renewal imperatives in Diobu, Port Harcourt, Nigeria.
- Ekblad, S., & Werne, F. (1990). Housing in Beijing. Ekistics, 57(343–344), 146–157.
- Ercan, M. A. (2011). Challenges and conflicts in achieving sustainable communities in historic neighborhoods of Istanbul. Habitat International, 35(2), 295–306. https://doi.org/10.1016/j.habitatint.2010.10.001
- Julia Simkus. (2023). Cluster Sampling: Definition, Method, and Examples. https://www.simplypsychology.org/cluster-sampling.html
- Kio-Lawson, D., & Dekor, J. B. (2014). Port Harcourt, the garden city: A garden of residents’ nightmare. World Environment, 3(2), 19–23.
- Kirkby, R. J. R. (1985). Urbanisation in China: Towns and country in a developing economy, 1949–2000 A.D. London: Croom Helm.
- Lim, W. S. W. (1983). Public housing in Singapore. Mimar, 7, 23.
- Locke, R., Elmlund, P., & Mehaffy, M. W. (2019). Evaluating landscape urbanism: Evidence from Lafayette Park, Detroit. Journal of Urbanism: International Research on Placemaking and Urban Sustainability, 12(1), 34–59.
- Obinna, V. C., Owei, O. B., & Okwakpam, I. O. (2010). Impacts of urbanization.
- Olabisi, Y. (2013). Gender issues and urban renewal development: An examination of challenges faced by evicted market women in Lagos State, Nigeria. American Journal of Rural Development, 1(2), 19–25.
- Ondo State Planning Report. (2006). A report submitted to the Millennium Development
- Roberts & Sykes, (2000). The evolution, definition, and purpose of urban regeneration. In P. Roberts & H. Sykes (Eds.), Urban regeneration: A handbook (pp. 9–36). London: SAGE Publications.
- Ron Mahabir, Andrew Crooks, Arie Croitoru & Peggy Agouris (2016) The study of slums as social and physical constructs: challenges and emerging research opportunities. Pages 399-419 https://doi.org/10.1080/21681376.2016.1229130
- Tsuyoshi Takano, Hiroyoshi Morita, Shinichiro Nakamura, Takuya Togawa, Noriyasu Kachi, Hirokazu Kato, Yoshitsugu Hayashi (2023) Evaluating the quality of life for sustainable urban development. Volume 142, ttps://doi.org/10.1016/j.cities.2023.104561
- Weje Ikezam Innocent and Ameme Bright Godfrey (2018) Evaluation of Plan Implementation: Peri-Urban Development and Diobu Layout plan, 1975-2018. The Environmental Studies. https://www.researchgate.net/publication/ 327968425_Evaluation_of_Plan_ Implementation_Peri-Urban_Development_and_Diobu_Layout_plan_1975-2018
- Wokekoro, E., & Owei, O. B. (2006). Environmental indicators of derelict housing in Nigerian cities: A case study of Port Harcourt, Rivers State.
- Wokekoro, E., & Inyang, M. (2007). Waste disposal in low-income neighborhoods and its impact on health: The case of Port Harcourt, Nigeria.