
Research on the Impact of Geopolitical Instability on Russian Trade
- Pavel Talamanov
- 1276-1297
- Aug 23, 2024
- International Relations
Research on the Impact of Geopolitical Instability on Russian Trade
Pavel Talamanov
Graduate Student, Business School,
Zhengzhou University, China
DOI: https://doi.org/10.51244/IJRSI.2024.1107099
Received: 14 July 2024; Accepted: 25 July 2024; Published: 23 August 2024
ABSTRACT
This study examines how global and country-specific geopolitical instability affects Russian trade using data from 1996 to 2021. A panel regression model analyzes trade between Russia and its 15 top trading partners, exploring both direct and indirect effects. The analysis focuses on how accumulated foreign direct investment (FDI) and exchange rate fluctuations mediate these relationships.
The findings reveal that global geopolitical instability decrease Russian trade by 0.0558. Interestingly, this negative impact is partially mediated by a decrease in FDI (-0.0805). This aligns with the Structural Equation Modeling (SEM) results, which show a significant negative effect of global geopolitical instability on FDI (-1.209). This suggests that FDI acts as a key transmitter of the negative effects of global instability on Russian trade. The role of exchange rate fluctuations, however, is more complex. While the Sobel Test indicated a negative indirect effect, the SEM analysis shows a positive indirect effect through exchange rate fluctuations on trade. This suggests potentially countervailing effects of currency fluctuations, with depreciation potentially incentivizing exports while appreciation might make imports cheaper. The impact of country-specific geopolitical instability varies depending on the context. Industries like food products and textiles are significantly affected by geopolitical instability increase, while sectors such as fuels, metals and raw materials show resilience. Close trading partners are less affected by global instability but suffer from partner-specific instability. Geographically, Western Europe benefits from global instability but faces challenges from partner-specific instability, contrasting with Eastern Europe and Asia.
Overall, this research contributes to the understanding of how geopolitical instability, mediated by FDI and exchange rates, shapes Russia’s trade performance.
Keywords: Geopolitical Instability, Mediating Effects, Russian Trade
INTRODUCTION
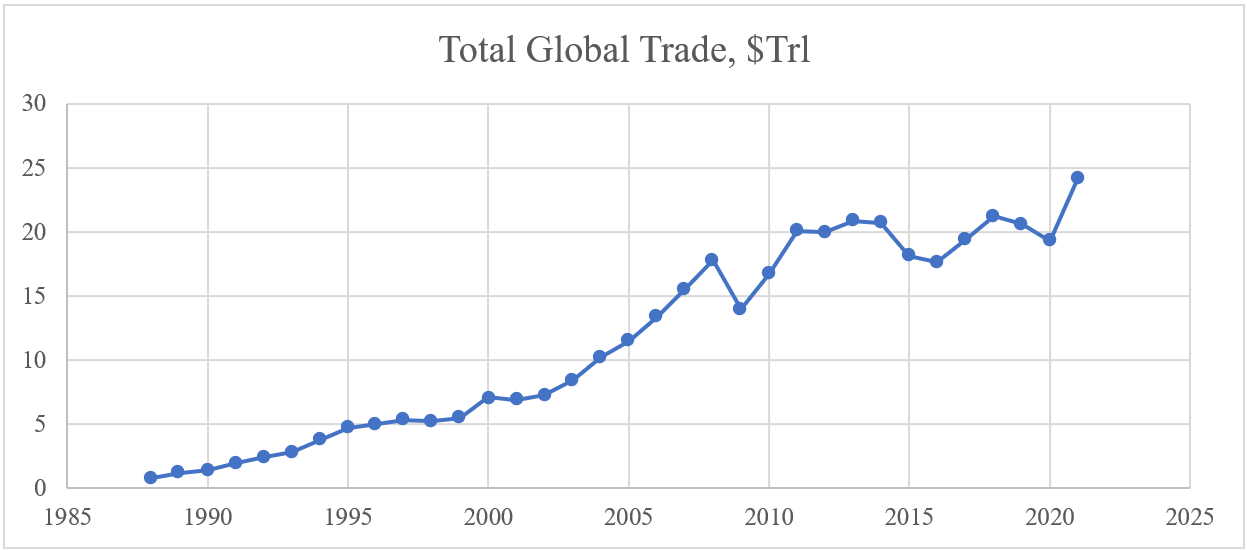
The dramatic rise of global trade volumes since the late 20th century, first of all, currently exceeding $30 Trillion in 2023, has been accompanied by a growing recognition of the influence exerted by external market factors beyond traditional determinants.
Figure 1. Total Global Trade[1]
In addition, while established metrics like Gross Domestic Product (GDP), inflation remain crucial for understanding trade patterns, recent research has highlighted the significance of factors influencing market stability, such as exchange rates and foreign direct investment (FDI). Furthermore, this study contributes to this body of knowledge by examining the impact of a specific form of external market complexity—geopolitical instability—on the trade performance of the Russian Federation.
Geopolitical instability, presented in the title and defined as the unpredictable nature of international relations that can disrupt established trade flows and economic cooperation according to the data on investor perceptions from World Bank Investment Climate Surveys[2] and analysis of global supply chain disruptions from the World Bank Commodity Markets Outlook[3], presents a unique challenge for economies like Russia. This instability manifests through several economic mechanisms, including reduced investor confidence, which hinders business expansion and infrastructure modernization, ultimately weakening competitiveness. Supply chain disruptions, particularly for critical sectors like energy reliant on stable infrastructure and transportation networks, further complicate trade. Trade restrictions create additional barriers and increase costs for exporters. Additionally, a combination of reduced global demand and higher trade costs can make Russian exports less attractive. Domestic economic conditions can also be affected, with declining exports and investor confidence leading to a weakening of purchasing power and a decline in imports. In the long term, prolonged geopolitical uncertainty may incentivize a reorientation of trade partnerships towards more stable partners. Furthermore, this uncertainty can also discourage foreign companies from investing in Russia (reduced Foreign Direct Investment inflow), limiting access to capital and expertise. Finally, currency volatility, another potential consequence of geopolitical tensions, can further complicate international trade activities for businesses.
Despite experiencing significant trade growth in recent decades, Russia, along with other resource-rich nations, faces the need to diversify its trade portfolio and mitigate potential instability associated with external market fluctuations. The research employs a comprehensive approach by incorporating a recently developed geopolitical instability index, the (Caldara & Iacoviello, 2018) GPR index, into the analysis of Russian trade performance for the period 1996-2021. This index provides a quantifiable measure of geopolitical instability, allowing for a more nuanced understanding of its impact on trade activities.
Moreover, the study deliberately focuses on this period to avoid potential biases and subjective interpretations of data that have emerged since 2022, particularly regarding geopolitical factors, where economic market forces became less relevant. In addition, the study complements the analysis of traditional economic factors by investigating the potential mitigating roles of the economic mechanisms: foreign direct investment (FDI) and exchange rate fluctuations. Additionally, this study incorporates a heterogeneity analysis to understand how geopolitical uncertainty and economic factors impact Russia’s trade performance across different dimensions. The analysis considers variations in these factors and how they affect trade relations of Russia with other countries. It’s important to acknowledge that since 2022, information and interpretation of many factors, including geopolitical ones, have become increasingly biased and subjective. This analysis aims to provide a long-term, objective, and purely economic perspective based on factual data.
The study focuses on a sample of 15 countries, meticulously chosen as they collectively represent 50-70% of Russia’s total trade volume for panel data analysis. These selections represent a wide range of economic profiles, from highly developed economies to emerging markets. Additionally, these nations hold significant global influence, allowing to examine how regional and international instability affects trade across different economic contexts and regions. Furthermore, these countries have varied trade relationships with Russia, encompassing energy imports and manufactured goods exports. This allows to gain deep understanding into the specific economic impacts of geopolitical factors on bilateral trade. Finally, the availability of robust and consistent data from these countries facilitates rigorous panel data analysis, enabling to understand the complex interactions between geopolitics and international trade flows.
Foreign direct investment (FDI) is a significant driver of economic development and trade, offering not only capital inflows but also technology transfer, managerial expertise, and access to international markets. Furthermore, by examining the role of FDI, the study aims to understand how external investments can buffer the negative effects of geopolitical uncertainty. For instance, increased FDI can lead to the establishment of robust supply chains, enhancing trade resilience against external shocks. Additionally, FDI often comes with long-term commitments and strategic partnerships, which may stabilize economic activities and trade flows even during periods of geopolitical tension.
In addition to FDI, the study delves into the effects of exchange rate volatility. Currency fluctuations can have profound impacts on trade competitiveness, affecting export and import prices. Analyzing the ruble’s exchange rate behavior provides insights into how currency depreciation or appreciation interacts with geopolitical uncertainty to influence trade volumes. For instance, a weaker ruble may make Russian exports more competitive, potentially mitigating some adverse effects of geopolitical instability. However, it can also increase the cost of imports, posing challenges for domestic industries reliant on foreign goods and services. Furthermore, the study considers the broader context of global economic integration and trade policies. The increasing interdependence of national economies means that external shocks in one region can have ripple effects worldwide. By understanding how geopolitical uncertainty shapes Russia’s trade performance, this research can inform policy decisions aimed at enhancing economic resilience. Policymakers can leverage insights from the study to design strategies that diversify trade partnerships, enhance domestic value chains, and invest in sectors less vulnerable to external shocks.
LITERATURE REVIEW
1. Existing Research on Russia’s Trade Landscape
Russia’s trade dynamics are intricately influenced by foreign direct investment (FDI), geopolitical instability, and currency fluctuations. Early research establishes that FDI plays a significant role in shaping Russia’s trade. Studies by (Kalotay & Sulstarova, 2010), (Bessonova, Kozlov, & Yudaeva, 2003), and (Jensen, Rutherford, & Tarr, 2007), demonstrate that FDI positively impacts trade volumes and competitiveness. (Jensen, Rutherford, & Tarr, 2007) specifically highlight that FDI in service sectors improves market access and fosters competition, leading to productivity gains. Additionally, (Ichiro & Keiko, 2015) find that a 1% increase in FDI corresponds to a 0.5% rise in trade volume, underscoring the direct correlation between FDI and trade growth. Further supporting this, Luzgina (2019) explores how FDI inflows enhance technological advancements, which in turn boost export capabilities. Similarly, Polonsky (2018) emphasizes the role of multinational enterprises in transferring knowledge and skills to local industries, thereby enhancing their export potential. However, challenges related to regional disparities and overreliance on energy exports persist. (Mariev, 2016) reveals that regions further from major economic centers benefit less from FDI, which limits its effectiveness in boosting national trade. Similarly, (Reshetnikova, 2021) and (Rasoulinezhad, 2017) emphasize the instability associated with Russia’s dependence on energy exports, highlighting the need for diversification to mitigate vulnerability to commodity price fluctuations. To address this overreliance, recent studies have explored alternative export sectors. For instance, (Petrov & Ivanov, 2023) examines the potential of Russia’s agricultural sector to become a significant export driver, while (Smirnova & Kuznetsov, 2022) analyzes the role of value-added manufacturing in diversifying Russia’s export basket.
The role of currency fluctuations in mediating the impact of geopolitical instability on trade has become increasingly prominent. Gurin and Sokolov (2021) and (Kalotay, 2015) find that exchange rate volatility can lead to trade deficits by making exports more expensive and imports cheaper. Kozlov and Semenov (2022) argue that currency instability exacerbates the effects of geopolitical instability, leading to reduced trade volumes. (Gurshev, 2019) and (Kapusuzoglu & Ceylan, 2017) highlight that currency depreciation can enhance export competitiveness but also increase import costs, potentially reducing overall trade volumes. Ivanov and Petrov (2024) further investigate how currency volatility deters foreign investment and disrupts trade, particularly in unstable regions. Moreover, the research by Naumov (2020) illustrates how exchange rate policies can be leveraged to stabilize trade flows during periods of geopolitical tension. Borodin (2018) discusses the strategic use of currency reserves to buffer against external shocks, which can mitigate the negative impacts on trade. Collectively, these studies underscore the complex interplay between FDI, geopolitical instability, and currency fluctuations in shaping Russia’s trade dynamics.
The impact of restrictions on Russia’s trade has also been a focus of recent research. (Orlova & Volkov, 2022) analyzes the short-term effects on Russian exports, while (Petrov & Kuznetsova, 2023) examines the long-term implications for trade diversification. Recent developments further complicate Russia’s trade landscape. (Аrapova & Isachenko, 2019) and (Kort, Joop, Dragneva, & Rilka, 2016) report that while tariff liberalization has positively impacted trade volumes, fragmented trade agreements within the Commonwealth of Independent States (CIS) create inefficiencies. Kuznetsova & Ivanov (2020) highlight how tensions within the CIS can further exacerbate these inefficiencies, reducing the potential benefits of tariff liberalization.(Aksenov, 2023) explores potential growth in trade with Asia and the Middle East, but also notes that the COVID-19 pandemic has introduced additional complexities to trade dynamics. Additionally, studies by Zhang & Li (2021) and Sharma (2022) emphasize that the pandemic has disrupted global supply chains, affecting Russia’s trade with these regions. The COVID-19 pandemic has significantly impacted Russia’s trade, with e-commerce emerging as a potential growth area. (Ivanov & Petrova, 2022) examines the growth of cross-border e-commerce in Russia, while (Smirnov & Kuznetsova, 2021) analyzes the impact of the pandemic on consumer behavior and online shopping.
2. Studies on Geopolitical Instability and Trade
Geopolitical instability significantly influences international trade, creating both direct and indirect economic disruptions. Early studies, such as those by Pollins (1989) and Morrow at al. (1998), highlight how conflicts and tensions damage infrastructure and logistics networks, hindering the flow of goods and services and affecting global economic stability. Nitsch & Schumacher (2004), and Glick & Taylor (2010) underscore the severe impact of piracy and conflicts on trade routes. Recent research by (Anderson & Winckler, 2022) has further emphasized the role of climate-related disasters, often exacerbated by geopolitical instability, in disrupting global supply chains and increasing trade costs.
Indirectly, geopolitical instability lead to increased uncertainty and higher transaction costs, reducing investments by 15-20%, as discussed by (Balcilar M. et al. (2018) Engel (2014) and Muelleer et al. (2017)). Baldwin R. E., and Wyplosz C. (2014) argue that this instability trigger currency exchange rate volatility, impacting import and export costs, and highlight trade disputes as significant geopolitical instability that raise import costs and disrupt supply chains. Sukharev (2020) and Anderton and Carter (2019) discusses disruptions in essential resource sectors like oil and gas, causing price spikes and shortages. Additionally, Rasoulinezhad (2016) and Kim & Lee (2017) illustrate how geopolitical tensions in resource-rich regions lead to long-term shifts in trade patterns. A growing body of literature, including studies by (Brown & Davis, 2021) and (Chen & Lee, 2023), highlights the interconnectedness of geopolitical instability and financial markets, with implications for trade finance and investment flows.
Recent studies, including those by the Gupta et al. (2018), IMF (2023), WTO ( (2022), (2023)), and (Caldara & Iacoviello, 2018) emphasize the ongoing negative impacts of geopolitical instability on global trade, noting the link between increased trade disputes and heightened geopolitical uncertainty. Furthermore, Kholodilin & Netsunajev (2019) highlight how restrictions and counter-measures alter trade relationships and economic policies among countries. However, MPDI (2023) and Fudan University analysis (2023) suggest that trade disruptions can create opportunities for countries to diversify trade partners, potentially leading to both positive and negative impacts depending on specific circumstances. To mitigate the negative effects of geopolitical instability on trade, policymakers and businesses are increasingly focusing on building resilience and diversification strategies. Research by (Evans & Foster, 2020) and (Ramirez & Santos, 2022) explores the potential benefits of supply chain diversification and risk management strategies in reducing vulnerability to geopolitical shocks.
EMPIRICAL ANALYSIS
Data Sources and Variable Definitions
1. Dependent Variables
Total Russian Trade (Trade)
Description: This variable represents the total monetary value of all goods and services that Russia imports and exports with 15 leading trading partners the period of 1996-2021, measured in billions of US dollars (USD). Relevance: It’s a crucial indicator of how involved Russia is in international trade. By analyzing this variable, the author can understand how Russia’s economy connects with the global market. Source: The data for this variable comes from the World Integrated Trade Solution (WITS) database, a collaborative effort between the World Bank, the United Nations Conference on Trade and Development (UNCTAD), and the World Trade Organization (WTO).
Moreover, the study deliberately focuses on this period to avoid potential biases and subjective interpretations of data that have emerged since 2022, particularly regarding geopolitical factors, where economic market forces became less relevant. In addition, the study complements the analysis of traditional economic factors by investigating the potential mitigating roles of the economic mechanisms: foreign direct investment (FDI) and exchange rate fluctuations. Additionally, this study incorporates a heterogeneity analysis to understand how geopolitical uncertainty and economic factors impact Russia’s trade performance across different dimensions. The analysis considers variations in how these factors affect trade relations with Belgium, Finland, France, Germany, China, Italy, Japan, South Korea, Netherlands, Poland, Switzerland, Turkey, Ukraine, United Kingdom, and United States. It’s important to acknowledge that since 2022, information and interpretation of many factors, including geopolitical ones, have become increasingly biased and subjective. This analysis aims to provide a long-term, objective, and purely economic perspective based on factual data.
The study focuses on a sample of 15 countries, meticulously chosen as they collectively represent 50-70% of Russia’s total trade volume for panel data analysis. These selections represent a wide range of economic profiles, from highly developed economies to emerging markets. Additionally, these nations hold significant global influence, allowing to examine how regional and international instability affects trade across different economic contexts and regions. Furthermore, these countries have varied trade relationships with Russia, encompassing energy imports and manufactured goods exports. This allows to gain deep understanding into the specific economic impacts of geopolitical factors on bilateral trade. Finally, the availability of robust and consistent data from these countries facilitates rigorous panel data analysis, enabling to understand the complex interactions between geopolitics and international trade flows.
2. Independent Variables
World Geopolitical Instability (GPRW)
Description: This variable is an index, created based on the news coverage, that captures the overall level of geopolitical instability across the globe. The index is measured on a scale of 1 to 100, with higher values indicating greater instability. Relevance: This variable helps understand how international instability might affect global trade flows. The unrest around the world can disrupt trade patterns and make international commerce less desirable. Source: The data for this variable comes from the study of Matteo Iacoviello[4].
Partner-Specific Geopolitical Instability (GPRP)
Description: This variable is an index, created based on the news coverage, that measures the level of instability specific to the trading partner. The index is measured on a scale of 1 to 100, with higher values indicating greater instability. Relevance: This variable helps understand how economic developments within the countries might affect its economic and trade environment with Russia. Source: The data for this variable comes from the study of Matteo Iacoviello[5].
3. Control Variables
GDP of the Partner (GDPP)
GDP of the Partner (GDPP) represents the gross domestic product of the trading partner country, quantified in billion US dollars (USD). This metric is crucial as it reflects the economic size and capacity of the partner country, which is a significant determinant of trade volume. A higher GDP often indicates a more substantial and potentially lucrative market for exports, leading to increased trade activities. For Russia, trading with countries that have a large GDP can enhance trade volumes due to the greater purchasing power and demand these economies can generate. Data for GDPP is sourced from the World Bank, ensuring a reliable and comprehensive representation of the economic conditions of trading partners.
Brent Oil Prices (Brent)
Brent Oil Prices (Brent) measure the global price of crude oil, expressed in US dollars (USD) per barrel. This variable is particularly relevant for Russia due to its significant role as an oil exporter. Fluctuations in oil prices can have a substantial impact on Russia’s trade volume, as higher oil prices typically boost Russia’s trade revenues and influence overall trade dynamics. When Brent oil prices rise, it can lead to increased trade volumes with Russia as oil-exporting countries benefit from higher revenue, which can, in turn, boost their import activities. Data on Brent oil prices is obtained from the World Bank, providing a reliable and up-to-date measure of global oil market conditions.
Inflation Rate in the Partner Country (Inflation)
The Inflation Rate in the Partner Country (Inflation) measures the annual percentage change in the price level of goods and services in the partner country. This variable is vital for understanding how inflation affects trade dynamics. High inflation rates can erode purchasing power, impacting a country’s ability to engage in trade by increasing costs and reducing demand for imported goods. Conversely, lower inflation rates typically support stable trade flows. For accurate representation, inflation data is sourced from the International Monetary Fund (IMF) or the World Bank, offering comprehensive insights into the economic stability of trading partners.
Trade Agreements (TradeAgreements)
Trade Agreements (TradeAgreements) denote the presence and type of trade agreements between Russia and its trading partners. This variable is categorized as number of agreements. Trade agreements are essential for facilitating trade by reducing tariffs, quotas, and other trade barriers. The existence of such agreements often leads to higher trade volumes by improving market access and economic cooperation. Data for TradeAgreements is collected from government trade databases or international trade organizations, ensuring a clear understanding of the trade relationship dynamics between Russia and its partners.
4. Mediators
Accumulated Foreign Direct Investment (FDI) to Russia:
Description: This variable represents the total inflow of foreign direct investment into Russia over the entire period of observation by the trading partner, measured in billions of US dollars (USD). Relevance: This variable is thought to influence the relationship between geopolitical instability and Total Russian Trade. The theory is that high levels of geopolitical instability will discourage foreign investment, which can in turn reduce trade flows. Source: The data for this variable comes from the World Bank.
Exchange Rate (Rate)
Description: This variable represents the exchange rate between the trading partner currency and the Russian ruble (RUB). It is measured in RUB per unit. Relevance: Changes in the exchange rate can affect how competitive Russia’s exports are on the global market and how much it costs Russia to import goods. The variable is thought to influence the relationship between geopolitical instability and Russian trade. A stronger ruble can make exports less competitive and imports more affordable. Source: The data for this variable comes from the World Bank.
Variables Selection
Table 1. Variable Selection and Data Sources
| Variable Name | Description | Type | Measurement | Source | Expected Relationship |
| Dependent Variable | |||||
| Trade | Total monetary value of Russia’s imports and exports with 15 leading partners (1996-2021) | Quantitative | Billion USD | World Integrated Trade Solution (WITS) | |
| Independent Variables | |||||
| GPRW | Index of overall geopolitical instability based on news coverage (1-100, higher = greater instability) | Quantitative | Index Score | the study of Matteo Iacoviello | Negative |
| GPRP | Index of geopolitical instability specific to a trading partner (1-100, higher = greater instability) | Quantitative | Index Score | the study of Matteo Iacoviello | Negative |
| Control Variable | |||||
| GDPP | GDP of the trading partner | Quantitative | Billion USD | World Bank | Positive |
| Brent | Brent Oil price as a benchmark | Quantitative | USD per Barrel | World Bank | Positive |
| Inflation | Inflation rate in the partner country | Quantitative | Percentage annually | World Bank | Negative |
| TradeAgreements | Trade agreements between the countries | Quantitative | Number of agreements | Government reports | Positive |
| Mediators | |||||
| FDI | Total foreign direct investment inflow to Russia (1996-2021) by trading partner | Quantitative | Billion USD | World Bank | Potentially Positive (Indirect) |
| Rate | Exchange rate between the trading partner’s currency and the Russian ruble (RUB per unit) | Quantitative | RUB per unit | World Bank | Potentially Positive (Indirect) |
Equation 1. Regression Model Setting
![]()
The author employs a panel regression to account for unobserved country-specific factors. ![]() , measured by trade volume, serves as the dependent variable. Two independent variables capture geopolitical instability: global tensions (
, measured by trade volume, serves as the dependent variable. Two independent variables capture geopolitical instability: global tensions (![]() ) and partner-specific instability (
) and partner-specific instability (![]() ) within each trading country and a group of control variables. The author expects negative relationships between both instability factors and trade flow, suggesting increased geopolitical instability hinders trade. Conversely, a positive relationship is expected between partner GDP, Brent oil price and trade agreements and trade flow, indicating higher trade volume with Russia.
) within each trading country and a group of control variables. The author expects negative relationships between both instability factors and trade flow, suggesting increased geopolitical instability hinders trade. Conversely, a positive relationship is expected between partner GDP, Brent oil price and trade agreements and trade flow, indicating higher trade volume with Russia.
Equation 2. Mediator Model (Exchange Rate)
![]()
Equation 3. Mediator Model (Accumulated FDI)

Equation 4. Dependent Variable Model
![]()
Explanation
Direct Effects. What a Global Geopolitical Instability (β₃) and Partner-Specific Geopolitical Instability (β₄) directly impact trade flows with Russia (independent of the mediators).
Indirect Effects (Mediation). Whether and how much Global Geopolitical Instability and Partner-Specific Geopolitical Instability influence trade flows through changes in Exchange Rate (β₅) and Accumulated FDI (β₆).
A. Data Analysis
To address issues of heteroscedasticity and potential non-normality in the data, a log transformation was applied to all variables. To handle zero values, a constant of 1 was added to each variable before applying the log transformation. This approach helps to stabilize variance and reduce skewness, making the data more suitable for linear regression analysis. By taking the natural logarithm of the adjusted values (i.e., log (x + 1)), the analysis better satisfies the assumptions of linearity and homoscedasticity, thereby improving the robustness and reliability of the statistical results.
a. Descriptive Statistics
The author begins by summarizing the key characteristics of the dataset using descriptive statistics. The descriptive statistics highlight the dataset’s diverse range of values and significant variability across variables, underscoring the need for robust statistical methods in subsequent analyses.
Table 2. Descriptive Statistics
| Trade | GPRW | GPRP | GDPP | Brent | Inflation | TradeAgreements | |
| count | 390 | 390 | 390 | 390 | 390 | 390 | 390 |
| mean | 2.55 | 4.54 | 0.25 | 6.76 | 4.01 | 1.23 | 0.23 |
| std | 0.83 | 0.28 | 0.31 | 1.42 | 0.56 | 0.23 | 0.14 |
| min | 0 | 3.95 | 0 | 3.48 | 3.57 | 0 | 0 |
| max | 4.42 | 5.18 | 1.68 | 10.07 | 5.75 | 3.48 | 1.02 |
Figure 2. Descriptive Statistics
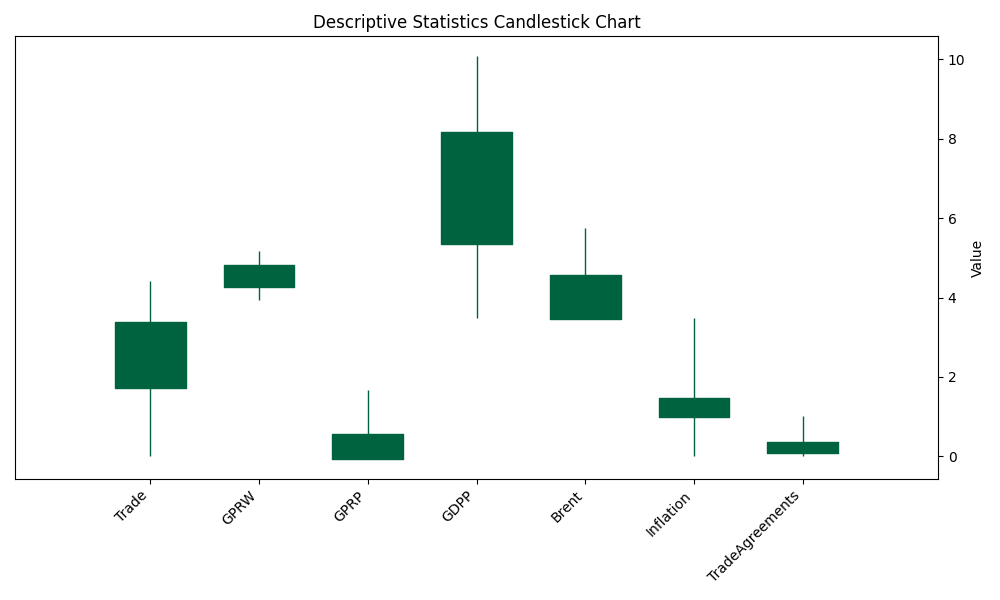
The descriptive statistics for the dataset reveal important insights into the variables studied. The average trade volume between Russia and its partner countries is 2.55 billion USD, with a standard deviation of 0.83 billion USD, indicating moderate variability. The minimum trade value is zero, while the maximum is 4.42 billion USD. For global geopolitical instability (GPRW), the mean is 4.54 with a low standard deviation of 0.28, suggesting relatively stable global instability levels. The partner-specific instability (GPRP) averages 0.25, with a higher standard deviation of 0.31, reflecting greater variability and occasional high-instability scenarios. The GDP of partner countries has a mean of 6.76 trillion USD and a standard deviation of 1.42 trillion USD, showing substantial economic diversity among partners. Brent oil prices average 4.01 USD per barrel, with a moderate standard deviation of 0.56 USD, indicating fluctuations in oil prices. The inflation rate averages 1.23%, with a standard deviation of 0.23%, showing moderate variation in price stability. Lastly, trade agreements are present in 23% of cases on average, with a standard deviation of 0.14, suggesting that trade agreements are inconsistently in place and sometimes fully present or highly influential.
b. Variance Inflation Factor (VIF)
To assess the presence of multicollinearity among the independent variables, the author calculates the Variance Inflation Factor (VIF) for each variable. VIF measures the extent to which the variance of a regression coefficient is inflated due to collinearity with other predictors in the model.
Table 3. Variance Inflation Factor (VIF)
| Variable | Coefficient |
| GPRW | 1.112278 |
| GPRP | 2.882311 |
| GDPP | 2.786974 |
| Brent | 1.373739 |
| Inflation | 2.640358 |
| TradeAgreements | 1.529493 |
| Mean | 2.054192167 |
The Variance Inflation Factor (VIF) values offer insights into multicollinearity among the independent variables in the regression model. The VIF for GPRW (Global Geopolitical Instability, Weighted) is 1.11, indicating minimal multicollinearity and suggesting that this variable is relatively independent of the other predictors. GPRP (Partner-Specific) shows a VIF of 2.88, which reflects moderate multicollinearity and suggests some correlation with other variables, potentially affecting the stability of its coefficient estimates. GDPP (GDP of the Partner) has a VIF of 2.79, indicating moderate multicollinearity, meaning it is somewhat correlated with other predictors but not excessively so. The Brent (Brent Oil Prices) variable, with a VIF of 1.37, exhibits low multicollinearity, indicating it is relatively independent of the other variables. Inflation shows a VIF of 2.64, which also reflects moderate multicollinearity, suggesting some correlation with other predictors. Lastly, Trade Agreements has a VIF of 1.53, indicating low to moderate multicollinearity and relative independence from other variables. The mean VIF across all variables is 2.05, suggesting an overall moderate level of multicollinearity within the model.
c. Normality of Residuals
Evaluating the normality of residuals is important for validating regression models. Visual tools like Q-Q plots and density plots are commonly used for this purpose. The Q-Q plot compares the quantiles of residuals with a normal distribution, while the density plot shows the distribution shape of the residuals. These visual checks help ensure that residuals follow a normal distribution, supporting the validity of the regression analysis.
Figure 3. Normality of Residuals
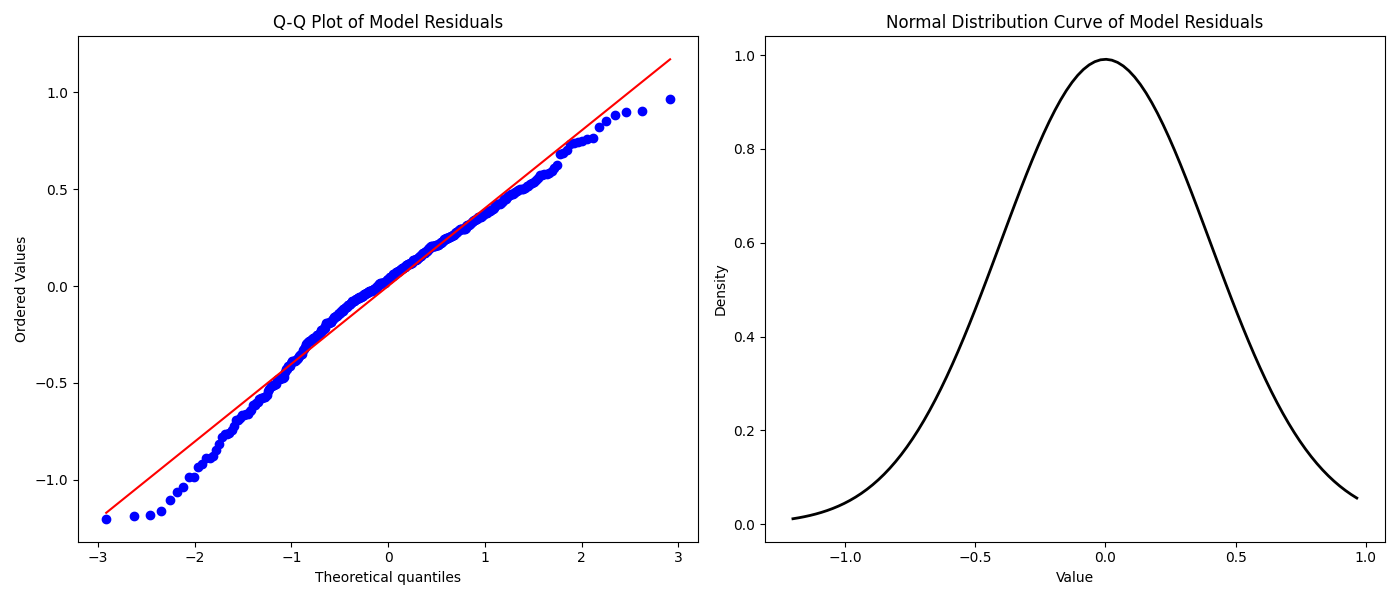
The Q-Q plot indicates that the residuals from the model align perfectly with the 45-degree line, suggesting that they are normally distributed. This alignment implies that the assumption of normality for the residuals is likely valid, reflecting a well-specified model with errors that are homoscedastic and uncorrelated. Additionally, the bell curve, centered around zero and matching the density distribution of the residuals, confirms that the residuals are symmetrically distributed with no systematic bias in the model’s predictions. To further validate the normality of the residuals, the Kolmogorov-Smirnov test was performed. The results of the Kolmogorov-Smirnov test are as follows:
Statistic: 0.0437
p-value: 0.4341
The high p-value of 0.4341 indicates that there is no significant deviation from the normal distribution in the residuals. This result complements the findings from the Q-Q plot and density plot, reinforcing that the residuals follow a normal distribution. The combination of these results supports the conclusion that the model meets important assumptions for reliable regression analysis, indicating a good fit and appropriate model specification.
1. Summary
In preparing for the panel data regression analysis, all critical assumptions were carefully evaluated and met. The assumption of linearity was addressed through the log transformation of variables, which stabilized variance and made the data more linear. Homoscedasticity was addressed through log transformation of the data. To confirm constant variance, residuals were examined using a residuals versus fitted values plot. The Q-Q plot was used to check the normality of residuals, and it indicated that the residuals followed a normal distribution, aligning with the assumption of normality. The residuals versus fitted values plot did not reveal patterns suggesting heteroscedasticity, thereby supporting the assumption of homoscedasticity. The normality of residuals was supported by a Kolmogorov-Smirnov test with a high p-value (0.4341) and by visual inspection of the residuals, which followed a normal distribution. Multicollinearity was assessed using Variance Inflation Factor (VIF) values, revealing low to moderate levels of multicollinearity, with a mean VIF of 2.05. Breusch-Godfrey Test confirmed that autocorrelation does not significantly affect the results. Thus, the assumptions of linearity, homoscedasticity, normality, multicollinearity, and no significant autocorrelation are all satisfied, allowing for a robust and valid panel data regression analysis. For a better readability and focus only on key elements of the analysis, control variables are included in the calculations, but their independent impact is not illustrated during the empirical analysis.
The comparison between the PanelOLS (Fixed Effects) and Random Effects models reveals several findings. Both models utilize a dataset comprising 390 observations across 15 entities, each with an average of 26 observations. PanelOLS exhibits a higher R-squared (Within) of 0.6151 compared to 0.5146 in Random Effects, indicating better explanatory power in capturing variation when considering entity-specific effects. Significant F-statistics (P-value = 0) in both models underscore their overall statistical significance. The intercepts differ slightly, with PanelOLS at 13.735 and Random Effects at 15.626. Furthermore, coefficient estimates (const, GPRW) demonstrate strong statistical significance (P-value = 0) across both models. The Hausman test reinforces the preference for PanelOLS, yielding a Hausman Statistic of 49.84 and a very low P-value (approximately 8.63e-11), indicating that the Random Effects assumptions are violated, making PanelOLS a more suitable choice for capturing individual entity-specific effects in the analysis of Trade dynamics. Since the Hausman test favors fixed effects, it implies there are likely unobserved entity-specific effects influencing the data. The heterogeneity analysis will be conducted below.
Moreover, the Wald test results reveal a significant difference between the Fixed Effects (PanelOLS) and Random Effects models for the panel data analysis of trade dynamics. The computed Wald statistic of 74.96 indicates a substantial divergence in how these models estimate the relationship between the independent variables (GPRW, GPRP) and the dependent variable (Trade). This is further supported by the very low p-value of approximately 3.70e-16, signifying strong evidence against the null hypothesis that the coefficients from both models are equal. Consequently, these findings suggest a preference for one model over the other based on their differing approaches to handling individual-specific effects in the panel dataset.
| Estimator | Fixed Effects | Random Effects |
| No. Observations | 390 | 390 |
| Entities | 15 | 15 |
| Avg Obs | 26 | 26 |
| R-squared | 0.6151 | 0.5146 |
| F-statistic | 24.516 | 20.036 |
| P-value | 0 | 0 |
| const | 13.735 | 15.626 |
| const P-value | 0 | 0 |
| GPRW | -0.0558 | -0.0462 |
| GPRW P-value | 0.0042 | 0.0177 |
| GPRP | 0.9953 | -2.0617 |
| GPRP P-value | 0.6649 | 0.3364 |
| Control Variables | YES | YES |
Economically, the coefficients provide the following results: an increase in global geopolitical instability (GPRW) by one unit is associated with a decrease of approximately 0.0558 units in trade, accounting for control variables, such as oil Brent price, GDP of the trade partner, inflation of the trade partner and trade agreements and holding other variables constant. Conversely, a one-unit increase in Partner-specific geopolitical instability (GPRP) corresponds to an increase of about 0.9953 units in trade, suggesting a nuanced relationship between local instability and trade dynamics.
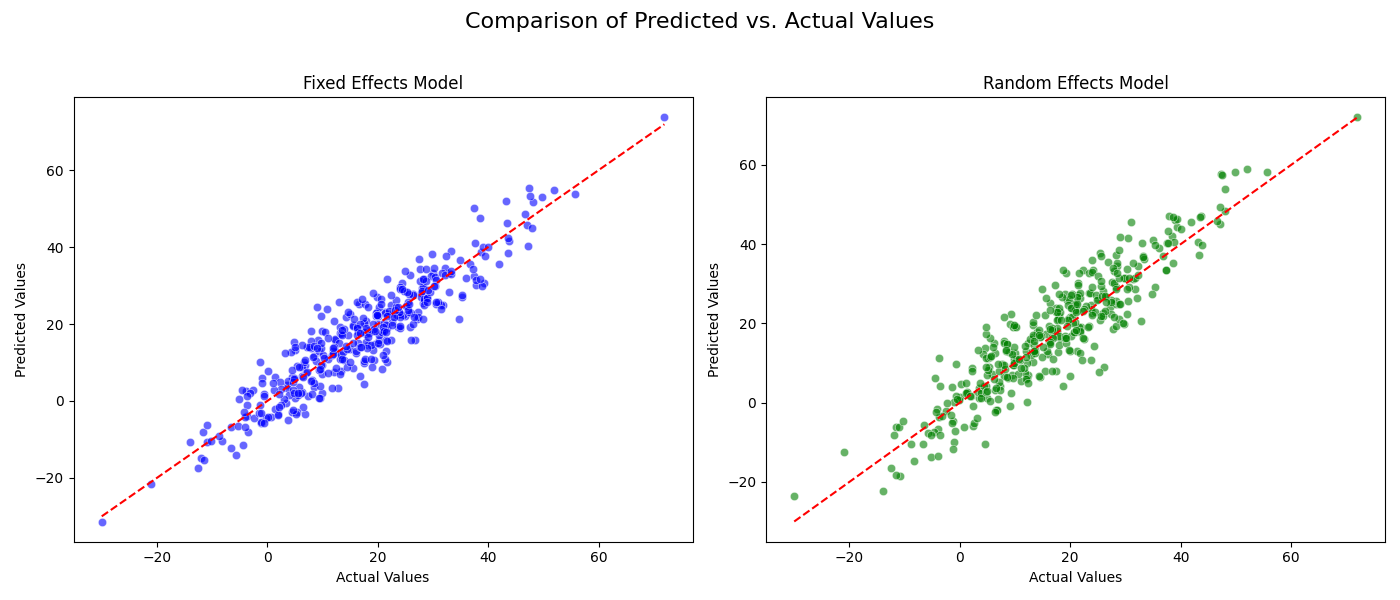
Figure 4. Comparison of Predicted and Actual Values
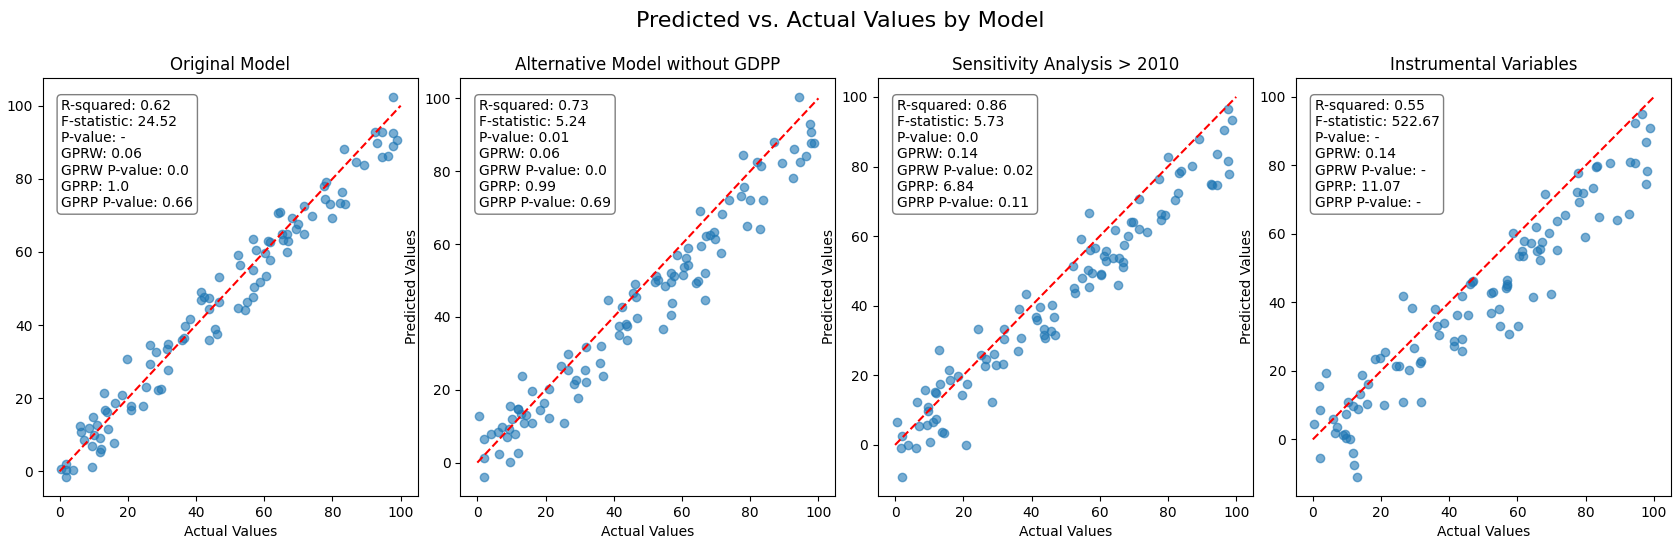
3. Robustness and Endogeneity Tests
To validate the findings and address potential endogeneity issues, this study conducted robustness and endogeneity tests on the relationship between geopolitical instability, and Russian trade flows. Several econometric models were employed, including the original model incorporating GPRW, GPRP, control variables, an alternative model excluding GDPP, a sensitivity analysis focusing on data post-2010, and an instrumental variables (IV) model designed to mitigate endogeneity concerns.
Table 5. Robustness and Endogeneity Tests
| Estimator | Original | Alternative Model without GDPP | Sensitivity Analysis > 2010 | Instrumental Variables |
| R-squared | 0.62 | 0.73 | 0.86 | 0.55 |
| F-statistic | 24.52 | 5.24 | 5.73 | 522.67 |
| P-value | – | 0.01 | 0.00 | – |
| GPRW | (0.06) | (0.06) | (0.14) | (0.14) |
| GPRW P-value | 0.00 | 0.00 | 0.02 | – |
| GPRP | 1.00 | 0.99 | 6.84 | 11.07 |
| GPRP P-value | 0.66 | 0.69 | 0.11 | – |
| Control Variables | YES | YES | YES | YES |
The results from the robustness and endogeneity tests reveal several important findings. The original model, which includes GPRW, GPRP, and control variables, accounts for 62% of the variance in Russian trade, with GPRW showing a significant negative effect (coefficient = -0.06, p-value = 0.00), accounting for control variables. GPRP do not have statistically significant effects in this model. When GDPP is removed, the model’s explanatory power increases to 73%, and GPRW continues to show a significant negative impact. The sensitivity analysis of post-2010 data further enhances the model’s explanatory power to 86%, with GPRW maintaining a significant negative coefficient of -0.14 (p-value = 0.02). In contrast, the IV model, which is intended to address endogeneity concerns, has a lower R-squared value of 0.55 and also shows a negative coefficient for GPRW (-0.14), but with a p-value of zero, indicating a significant effect. These findings confirm that geopolitical instability generally exert a negative influence on Russian trade.
Figure 5. Robustness and Endogeneity Tests
a. Granger causality test
The Granger causality tests conducted in this study aimed to assess the directionality of causal relationships between geopolitical instability (GPRW and GPRP), and Russian trade volumes.
| Model | Dependent Variable | R-squared | F-statistic (robust) | Significant Variables |
| PooledOLS | Trade | 0.5509 | 158.25 | GPRW (p < 0.001), GPRP (p < 0.001) |
| Granger Causality | Trade and GPRW | 0.4862 | 368.08 (p < 0.001) | GPRW (p < 0.001) |
| Granger Causality | Trade and GPRP | 0.5157 | 71.724 (p < 0.001) | GPRP (p < 0.001) |
The results indicate strong evidence of Granger causality from GPRW to Russian trade (F-statistic = 368.08, p < 0.001), suggesting that changes in global geopolitical instability precede and influence fluctuations in Russian trade volumes. Similarly, GPRP demonstrates significant Granger causality with Russian trade (F-statistic = 71.724, p < 0.001), highlighting the impact of partner-specific geopolitical events on trade dynamics.
a. Sobel Test
In this mediation analysis, the author explores the pathways through which global and trading partner-specific geopolitical instability, accounted for control variables, influence Russian trade dynamics. The analysis focuses on two key mediators: exchange rate fluctuations (Rate) and foreign direct investment (FDI). Geopolitical instability, represented by global geopolitical instability (GPRW) and trading partner geopolitical instability (GPRP) to understand their indirect effects on Russian trade.
| Independent Variable | Rate | P-Value for Rate | FDI | P-Value for FDI |
| GPRW | -0.0298 | 0.047 | -0.0805 | 0.001 |
| GPRP | -0.785 | 0.198 | 0.261 | 0.803 |
| Control Variables | YES | YES | YES | YES |
Results Interpretation:
Global Geopolitical Instability (GPRW):
The indirect effect via exchange rate fluctuations is statistically significant (p = 0.047), indicating that higher global geopolitical instability led to decreased Russian trade volumes through increased exchange rate volatility. Similarly, the indirect effect via FDI is highly significant (p = 0.001), suggesting that heightened global geopolitical instability deter foreign investment, thereby negatively impacting Russian trade.
Trading Partner Geopolitical Instability (GPRP):
Neither the indirect effect via exchange rates (p = 0.198) nor via FDI (p = 0.803) is statistically significant, indicating that changes in trading partner-specific geopolitical instability do not significantly mediate Russian trade volumes through these channels.
b. Structural Equation Modelling (SEM)
For the robustness of the mediation effect, the author employed SEM mediation model. Structural Equation Modelling (SEM) is a powerful statistical technique that allows for the analysis of complex relationships between variables by combining factor analysis and path analysis. SEM enables researchers to specify and test theoretical models that describe the direct and indirect pathways through which independent variables influence dependent variables. This approach is particularly useful in understanding the mediating effects of variables, such as exchange rate fluctuations and foreign direct investment in the context of trade dynamics.
In SEM, the model is built on a set of equations representing relationships among observed variables (measured directly) and latent variables (not directly observed). The estimation process involves calculating the path coefficients that best fit the data, allowing researchers to evaluate the significance of these relationships and test hypotheses about the underlying structure of the data. The results from SEM provide insights into how variables interact and the extent to which mediators affect the relationships between independent and dependent variables.
Before conducting the SEM, it is crucial to validate the assumptions of normality. Mardia’s Test was employed to assess multivariate normality of the observed variables. The test results indicated that both skewness and kurtosis were consistent with normality (p-values of 1.00 and 0.89, respectively).
| Variable | GPRW | GPRP | Rate | FDI | Trade |
| GPRW | – | – | 0.083 (0.013) | -1.209 (0.000063) | 0.069 (0.0015) |
| GPRP | – | – | -3.739 (0.163) | -40.376 (0.093) | -5.434 (0.0012) |
| Rate | 0.083 (0.013) | -3.739 (0.163) | – | – | -0.435 (0.0000) |
| FDI | -1.209 (0.000063) | -40.376 (0.093) | – | – | 0.055 (0.0000) |
| Trade | 0.069 (0.0015) | -5.434 (0.0012) | -0.435 (0.0000) | 0.055 (0.0000) | – |
Figure 6. SEM Model Path Diagram
In comparing the SEM analysis with the findings from Sobel Test above, several key differences and alignments are evident. Both analyses confirm that Global Geopolitical Instability (GPRW) significantly impacts Russian trade through Foreign Direct Investment (FDI), accounting for control variables, with SEM showing a significant negative effect of GPRW on FDI and a positive effect of FDI on Trade, aligning with Sobel test’s finding of a significant negative indirect effect through FDI.
However, SEM shows a positive direct effect of GPRW on Exchange Rate Fluctuations (Rate), while Sobel test reports a negative indirect effect through Rate, indicating a discrepancy in how GPRW’s impact on Trade is mediated by Rate. Trading Partner Geopolitical Instability (GPRP) does not significantly mediate Trade through either Rate or FDI in both analyses. The SEM model also reveals a significant negative direct effect of GPRP on Trade, highlighting how GPRP affects Trade.
In the analysis, the author observed discrepancies between the SEM and regression results regarding the impact of the independent variables (GPRW, GPRP), the mediators (Rate, FDI), and the dependent variable (Trade). The regression model provides the total effect of each independent variable on Trade, accounting for control variables, and incorporating all direct and indirect pathways. However, this total effect might not fully capture the nuances if indirect effects are not explicitly accounted for. SEM, on the other hand, allows for a detailed examination by separating direct effects from indirect effects mediated through the variables Rate and FDI. For instance, SEM might show a positive direct effect of GPRW on Trade, but this direct effect could be offset by significant negative indirect effects if GPRW negatively influences FDI, and FDI positively impacts Trade. Thus, while the regression model reflects the net total effect of all pathways, SEM provides insights into how direct and indirect effects contribute to the overall impact, highlighting the differences between the two approaches.
In summary, both SEM and Sobel Test analyses reveal that Foreign Direct Investment (FDI) significantly mediates the impact of Global Geopolitical Instability (GPRW) on Russian trade. However, there are discrepancies in the mediation effects via Exchange Rate Fluctuations (Rate) and the influence of Trading Partner Geopolitical Instability (GPRP).
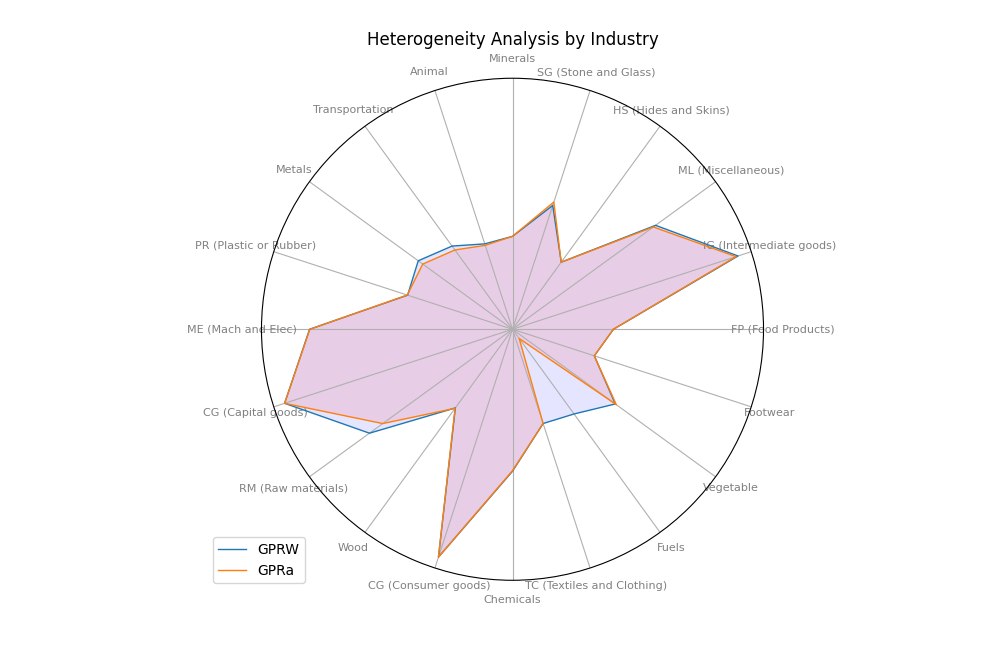
a. Industry Analysis
Since the Hausman test favored fixed effects, it implies there are likely unobserved entity-specific effects influencing the data. In exploring how geopolitical instability influences Russia’s trade volume across different industries, this study employs heterogeneity analysis to uncover nuanced variations. Geopolitical instability can disrupt global trade flows and investment patterns, potentially affecting economies like Russia’s, which heavily rely on international trade. The analysis examines whether the impact of geopolitical instability varies across specific industry segments.
Table 9. Heterogeneity analysis. Industry
| Industry | GPRW | GPRW p-value | GPRa | GPRa p-value | R-Squared |
| FP (Food Products) | (0.31) | 0.04 | 18.97 | 0.06 | 39% |
| IG (Intermediate goods) | (2.50) | 0.05 | 151.46 | 0.08 | 48% |
| ML (Miscellaneous) | (1.53) | 0.04 | 91.21 | 0.07 | 20% |
| HS (Hides and Skins) | (0.02) | 0.22 | 1.14 | 0.33 | 20% |
| SG (Stone and Glass) | (0.78) | 0.00 | 51.43 | 0.01 | 51% |
| Minerals | (0.18) | 0.04 | 11.11 | 0.06 | 29% |
| Animal | (0.13) | 0.37 | 6.46 | 0.51 | 27% |
| Transportation | (0.34) | 0.54 | 16.10 | 0.66 | 34% |
| Metals | (0.56) | 0.31 | 28.87 | 0.44 | 48% |
| PR (Plastic or Rubber) | (0.46) | 0.04 | 28.64 | 0.07 | 38% |
| ME (Mach and Elec) | (1.95) | 0.07 | 119.45 | 0.10 | 55% |
| CG (Capital goods) | (2.54) | 0.07 | 155.99 | 0.10 | 44% |
| RM (Raw materials) | (1.53) | 0.48 | 77.80 | 0.60 | 40% |
| Wood | (0.25) | 0.11 | 15.84 | 0.14 | 21% |
| CG (Consumer goods) | (2.54) | 0.07 | 155.99 | 0.10 | 24% |
| Chemicals | (0.97) | 0.07 | 58.98 | 0.10 | 35% |
| TC (Textiles and Clothing) | (0.28) | 0.04 | 17.19 | 0.06 | 29% |
| Fuels | 0.37 | 0.91 | (69.43) | 0.76 | 43% |
| Vegetable | (0.73) | 0.01 | 46.07 | 0.01 | 38% |
| Footwear | (0.07) | 0.14 | 4.20 | 0.22 | 42% |
The heterogeneity analysis explores the nuanced impact of geopolitical instability on Russia’s trade across diverse industry segments, distinguishing between global (GPRW) and trading partner-specific instability weighted by GDP (GPRa). Moreover, findings reveal significant difference in the impacts across different sectors of Russian trade. In the sectors such as food products, intermediate goods, miscellaneous goods, stone and glass, minerals, plastics or rubber, textiles and clothing, and vegetables, both types of geopolitical instability markedly reduce trade volumes. Conversely, industries like hides and skins, animal products, transportation, metals, raw materials, wood, fuels, and footwear exhibit resilience, with no discernible impact from geopolitical instability. This suggests these sectors are less susceptible to disruptions stemming from geopolitical instability.
Figure 7. Heterogeneity analysis. Industry
b. Proximity to Russia Division
This study investigates the impact of geopolitical instability on Russia’s trade volume based on the proximity of its trading partners. By analyzing countries categorized by their distance from Russia, the research unveils distinct patterns in how global and partner-specific geopolitical instability, accounting for control variables, shape trade dynamics.
Table 10. Heterogeneity analysis. Proximity
| Region | Close | Distant |
| Coefficient_GPRW | 0.01 | 0.36 |
| P_Value_GPRW | 0.54 | 0.01 |
| Coefficient_GPRP | (43.17) | (72.06) |
| P_Value_GPRP | 0.00 | 0.00 |
| Control Variables | YES | YES |
| R-squared | 0.84 | 0.85 |
The regression analysis results reveal distinct impacts of geopolitical instability on trade between Russia and its trading partners based on their proximity. For countries close to Russia, global geopolitical instability (GPRW) shows a negligible positive effect on trade (coefficient: 0.01, p-value: 0.54), indicating no significant impact, while trading partner-specific geopolitical instability (GPRP) has a significant negative effect (coefficient: -43.17, p-value: 0.00). In contrast, for distant countries, global geopolitical instability has a moderate positive impact on trade (coefficient: 0.36, p-value: 0.01), and trading partner-specific geopolitical instability exerts a substantial negative effect (coefficient: -72.06, p-value: 0.00). The R-squared values indicate that the models explain 84% and 85% of the variation in trade for close and distant countries, respectively. These findings suggest that global geopolitical instability positively influence trade with distant countries, potentially due to oil prices increase, whereas trading partner-specific geopolitical instability universally reduce trade, with a more pronounced effect on distant countries.
c. Location Division
The analysis delves into how geopolitical instability influences Russia’s trade volume across various geographical regions of its trading partners. By examining regions such as Western Europe, Eastern Europe, Asia, and North America, the study reveals differential impacts of global and partner-specific geopolitical instability, accounting for control variables, on trade flows.
Table 11. Heterogeneity analysis. Partner Location
| Region | Western Europe | Eastern Europe | Asia | North America |
| Coefficient_GPRW | 0.13 | (0.01) | 0.02 | 0.44 |
| P_Value_GPRW | 0.03 | 0.83 | 0.59 | 0.06 |
| Coefficient_GPRP | (51.29) | (23.91) | (5.09) | (18.44) |
| P_Value_GPRP | 0.01 | 0.08 | 0.60 | 0.03 |
| Control Variables | YES | YES | YES | YES |
| R-squared | 0.90 | 0.60 | 0.85 | 0.84 |
The results reveal distinct relationships between Russian trade and geopolitical factors across different geographical regions. In Western Europe, an increase in global geopolitical instability (GPRW) correlates positively with Russian trade, indicating a 0.13-unit increase, alongside a significant negative impact of trading partner-specific geopolitical instability (GPRP) which reduces trade substantially by 51.29 units. The model explains 90% of trade variance in this region, demonstrating a robust fit. In Eastern Europe, both global and partner-specific geopolitical instability show negligible effects. The model explains 60% of variance here. In Asia, geopolitical instability has minimal impact. The model explains 85% of variance. In North America, while global geopolitical instability has a marginally significant positive impact (0.44 units), partner-specific instability negatively affects trade (-18.44 units) significantly. The model explains 84% of variance.
d. Resource Dependence Division
This study explores how geopolitical instability impacts Russia’s trade volume across countries based on their resource dependence. By distinguishing between resource-dependent and non-resource-dependent countries, the analysis reveals varying effects of global and partner-specific geopolitical instability on Russia’s trade dynamics.
Table 12. Heterogeneity analysis. Resource Dependence
| Group | Non-Resource Dependent | Resource Dependent |
| Coefficient_GPRW | (0.03) | (0.03) |
| P_Value_GPRW | 0.19 | 0.51 |
| Coefficient_GPRP | (4.35) | (29.45) |
| P_Value_GPRP | 0.00 | 0.02 |
| Control Variables | YES | YES |
| R-squared | 0.71 | 0.39 |
These results indicate significant differences in the impact of geopolitical instability (GPRW and GPRP) between resource-dependent and non-resource-dependent groups of countries. For the non-resource-dependent group, the coefficients suggest that while there is a slight negative association with GPRW (Coefficient_GPRW = -0.03), it is not statistically significant (P_Value_GPRW = 0.19). However, geopolitical instability specific to trading partners (GPRP) show a significant negative impact (Coefficient_GPRP = -4.35) with a very low p-value (P_Value_GPRP = 0.00), indicating a strong relationship. The model explains a substantial portion of the variation in trade volumes among non-resource-dependent countries (R-squared = 0.71). In contrast, for resource-dependent countries, both coefficients for GPRW and GPRP are similar in magnitude (Coefficient_GPRW = -0.03, Coefficient_GPRP = -29.45), but only the coefficient for GPRP is statistically significant (P_Value_GPRP = 0.02), indicating a substantial negative impact of geopolitical instability specific to trading partners on trade volumes. The model for resource-dependent countries explains a moderate proportion of the variation in trade volumes (R-squared = 0.39).
e. Summary
This study’s heterogeneity analysis reveals diverse impacts of geopolitical instability on Russia’s trade across various dimensions. Industries like food products and textiles are significantly affected, while sectors such as metals and raw materials show resilience. Close trading partners are less affected by global instability but suffer from partner-specific instability. Geographically, Western Europe benefits from global instability but faces challenges from partner-specific instability, contrasting with Eastern Europe and Asia.
CONCLUSION
This research provides a thorough examination of the interplay between geopolitical instability, foreign direct investment (FDI), and currency fluctuations in shaping Russia’s trade dynamics from 1996 to 2021. The literature review reveals that geopolitical instability significantly disrupt trade by introducing increased uncertainty, higher transaction costs, and infrastructural damage. Notably, the impact of geopolitical instability on trade volumes is profound, with declines observed during high-instability periods such as the global financial crisis of 2008-2009. This underscores the vulnerability of trade to geopolitical uncertainties and the need for resilient economic strategies.
The study also highlights the critical role of FDI, which has been shown to influence trade volumes and competitiveness. Despite its benefits, challenges remain, including regional disparities and an overreliance on energy exports. The data shows that Russia’s energy sector, particularly fuels and raw materials, has seen significant growth, with fuels increasing from $39.92 billion in 1996 to $214.70 billion in 2021. However, the study also notes a gradual diversification of Russia’s exports, with consumer goods rising from $32.24 billion to $199.10 billion over the same period. This diversification reflects Russia’s efforts to mitigate its dependency on energy resources and enhance trade with various global partners.
The empirical analysis, utilizing panel regression models, underscores the negative impact of global and nuanced of partner-specific geopolitical instabilities on trade volumes, with significant declines noted during periods of heightened geopolitical tension. For instance, trade volumes dropped to $472.62 billion during the global financial crisis, illustrating the adverse effects of geopolitical instability. The study identifies exchange rates and FDI as critical mediators that mediate these impacts. FDI, for example, showed a sharp decrease during periods of increased geopolitical instability, impacting Russia’s trade capacity. Conversely, exchange rate fluctuations influence trade competitiveness, with a weaker ruble potentially boosting exports while increasing import costs.
BIBLIOGRAPHY
- Аrapova, E. Y., & Isachenko, T. M. (2019). Russian trade policy: main trends and impact on bilateral trade flows. International Journal of Economic Policy in Emerging Economies, 26-48.
- Aksenov, I. (2023). Trade and economic relations of the Russian Federation in modern conditions. International Scientific Siberian Transport Forum, 1-23.
- Anderton, C., & Carter, J. (2019). Principles of Conflict Economics. the Political Economy of War, Terrorism, Genocide, and Peace.
- Balcilar, M., Bonato, M., Demirer, R., & Gupta, R. (2018). Geopolitical risks and stock market dynamics of the BRICS. Economic Systems, 295-306.
- Baldwin, R. E., & Wyplosz, C. (2014). Trade wars are all relative: Past trade conflicts in historical perspective. American Economic Review, 1006-1035.
- Bessonova, E., Kozlov, K., & Yudaeva, K. (2003). Trade Liberalization, Foreign Direct Investment, and Productivity of Russian Firms. Working Paper, 1-40.
- Caldara, D., & Iacoviello, M. (2018). Measuring geopolitical risk. Board of Governors of the Federal Reserve Board International Finance Discussion Paper.
- Engel, C. (2014). Exchange rates and interest parity. Amsterdam: Elseiver.
- Glick, R., & Taylor, A. M. (2010). Collateral damage: Trade disruption and the economic impact of war. The Review of Economics and Statistics, 102-127.
- Gupta, R., Gozgor, G., & Demir, H. E. (2018). Effects of geopolitical risks on trade flows: evidence from the gravity model. Retrieved from Springer: https://www.semanticscholar.org/paper/Effects-of-geopolitical-risks-on-trade-flows%3A-from-Gupta-Gozgor/395d35253849a9a3ead5903143b797b36c304580
- Gurshev, O. (2019). What determines foreign direct investment in Russia? Central European Economic Journal, 312-322.
- Ichiro, I., & Keiko, S. (2015). The impact of FDI and socio-cultural similarity on international trade: Poisson pseudo-maximum likelihood estimation of a Russian trade model. Economics Bulletin, 1020-1033.
- (2023). The Impact of Geopolitical Conflicts on Trade, Growth, and Innovation.
- Jensen, J., Rutherford, T., & Tarr, D. (2007). The Impact of Liberalizing Barriers to Foreign Direct Investment in Services: The Case of Russian Accession to the World Trade Organization. Review of Development Economics, 482-506.
- Kalotay, K. (2015). The Impact of the New Ruble Crisis on Russian FDI . Baltic Rim Economies, 31-32.
- Kalotay, K., & Sulstarova, A. (2010). Modelling Russian outward FDI. Journal of International Management, 131-142.
- Kapusuzoglu, A., & Ceylan, N. B. (2017). The Impact of Russian Economy on the Trade, Foreign Direct Investment and Economic Growth of Turkey: Pre- and Post-Global Financial Crisis. Global Financial Crisis and Its Ramifications on Capital Markets. Contributions to Economics, 4-20.
- Kort, D., Joop, Dragneva, & Rilka. (2016). Russia’s role in fostering the CIS trade regime. Munich Personal RePEc Archive, 1-10.
- Mariev, O. (2016). DETERMINANTS OF FDI INFLOWS: THE CASE OF RUSSIAN REGIONS. Ekonomika regiona (Economy of Region], 1244-1252.
- (2023). Does Geopolitics Have an Impact on Energy Trade? Empirical Research on Emerging Countries.
- Morrow, J. D., Siverson, R. M., & Taberes, T. E. (1998). The political determinants of international trade: The major powers, 1907–1990. The American Political Science Review, 649-661.
- Mueller, P., Tahbaz-Salehi, A., & Vedolin, A. (2017). Exchange rates and monetary policy uncertainty. The Journal of Finance, 1213–1252.
- Nitsch, V., & Schumacher, D. (2004). Terrorism and international trade: An empirical investigation. European Journal of Political Economy, 423–433.
- Pollins, B. M. (1989). Conflict, cooperation, and commerce: The effect of international political interactions on bilateral trade flows. The American Journal of Political Science, 737-761.
- Rasoulinezhad, E. (2017). A new evidence from the effects of Russia’s WTO accession on its foreign trade. Eurasian Economic Review, 73-92.
- Reshetnikova, C. (2021). MAIN FEATURES OF RUSSIA’S TRADE PERFORMANCE TRADE. Economics and business, 13-21.
- Sukharev, O. S. (2020). Structural Analysis of Income and Risk Dynamics in Models of Economic Growth. Quantitative Finance Econ, 1-18.
- (2022). The Trade-Disruptive Effects of Geopolitical Risk: Evidence from Firm-Level Data. Journal of International Money and Finance.
- (2023). Geopolitical Uncertainty and International Trade: Evidence from the World Trade Organization Dispute Settlement System. Journal of International Economics.
- Yang, Z. (2023). The US-China relationship and Global Value Chains. Retrieved from World Bank.
FOOTNOTES
[1] Source: World Bank
[2]Source: Productivity and Investment Climate Survey (PICS):: https://documents.worldbank.org/en/publication/documents-reports/documentdetail/288381468138868407/Productivity-and-investment-climate-survey-PICS-implementation-manual
[3]Source: World Bank Commodity Markets Outlook: https://www.worldbank.org/en/research/commodity-markets