
A Gis Approach in Locational Analysis of Post Primary School in Umuahia North Local Government Area, Abia State, Nigeria
- Adeboboye, A. J.
- Idika, S. C.
- N. P. Udoudo
- 188-199
- May 31, 2024
- Education
A Gis Approach in Locational Analysis of Post Primary School in Umuahia North Local Government Area, Abia State, Nigeria
Adeboboye, A. J., Idika, S. C., N. P. Udoudo
Department of Surveying and Geoinformatics,
Nnamdi Azikiwe University Awka, Anambra State, Nigeria
DOI: https://doi.org/10.51244/IJRSI.2024.1105012
Received: 11 April 2024; Revised: 27 April 2024; Accepted: 01 May 2024; Published: 31 May 2024
ABSTRACT
The provision of education as a social service around the world is predominantly done by the public sector. The location of education facilities is known to influence their utilization and efficiency, as their proximity influences the decision to seek and receive education. This study therefore, analyzed the location of public secondary schools in Umuahia North education zone. The study also developed a geodatabase for the public secondary schools in the study area so as to enable effective and efficient planning and management of these schools in the study area. Google Earth Image covering the study area was used. Data on the facilities were obtained: Number of Classes, Number of teachers, and number of students, taught subjects were obtained through the administration of questionnaires. Geographic coordinates of schools were obtained using a hand-held Global Positioning System (GPS). The data analysis was carried out using ArcGIS 10.1. The study observed that 13 public and 36 private secondary schools were located in the study area and these schools were meant to serve all the localities in the study area Other utilities such as libraries,laboratories, electricity, water and classrooms were also lacking or inadequate in these schools. The study recommends the use of GIS in school data handling and should be encouraged as it makes decision making easier and also enhances the proper sitind and distribution of these facilities. The study alsorecommends the creation of a model for the proper distribution of basic school facilities.
Keywords: GIS, ArcGIS, Geographic Coordinates, Geodatabase
INTRODUCTION
Public service is defined as all activities delivered by the government to fulfill those needs that society requires to go through life (Anwaruddin, 2015). It can also refer to all organizations that exist as part of government machinery for implementing policy decisions and delivering services that are of value to the citizens. This is a mandatory institution of the state under the 1999 constitution of Nigeria (Kayode, Adegba and Ayio, 2013). The delivery of these services is achieved through institutional arrangements adopted by the government to provide public goods and services to its citizens. Public service delivery has been one of the key functions of the public sector which uses civil service bureaucracies as the instrument for the delivery of services (World Development Report, 2004).
Carlson et. al. (2005) conceptualized service delivery as the relationship between policy makers, service providers and poor people. According to them, it encompasses services and their supporting systems that are typically regarded as a state responsibility. These include social services (primary education and basic health services), infrastructure (water, signification, roads and bridges) and services that promote personal security (justice, police, etc).
In Nigeria, the government constitutes the major service provider through public service. As public health, education, water systems and infrastructure have largely deteriorated for a variety of reasons; provision of the services is increasingly being delivered by international Non-Governmental Organizations (NGOs) or through the commercial and informal private sectors. It is with this recognition that Wild, Chamber, King and Harris (2012), stated that despite bold plans and massive injections of international and domestic resources, public service delivery is still failing in many areas in most poor developing countries. This suggests that there is a need to revisit approaches to assisting service delivery sectors. They agreed that a shift of emphasis is needed, towards a greater focus on understanding how a range of institutional and governance arrangements can shape service delivery processes and outcomes.
Service delivery however is seen to remain lower than what is targeted. People suffer from many hurdles when they need to access any government service either because of lack of information or due to bureaucratic procedures and attitudes; like types of services available, location of service facilities, processes or procedures to access these services (Tamraker, 2010). This act was concurred with by Nirmala (2008), who stated that the lack of information and complex regulations could be further barriers to citizens or customers in dealing with government services. This creates frustration and dissatisfaction among citizens towardthe government.
The provision of education as a social service around the world is predominately done by the public sector. Education in Nigeria is overseen by the Ministry of Education and the local authorities take responsibility for implementing policy for state-controlled public education and state schools at a regional level. The education system is divided into primary education, secondary education and tertiary education.
Education is one of the most important factors in Nigeria’s quest to become one of the largest economies by the year 2030. However, with the recent state of education in Nigeria, measures need to be taken to overhaul the system in order for it to serve as a reliable and efficient vehicle for the attainment of the vision. Secondary education is a programme of public education immediately following elementary schooling. It begins generally at the age of 12 to 14 and continues for four to six years. Some secondary education, such as vocational school, is terminal and prepares the student for employment upon graduation. Others lead to advanced training in colleges, universities or technical schools (Encarta, 2009; Abbas, 2012).
The emphasis on educational services is based on the total dependence of development and policy actualization on the level of education in any society. If educational services are not adequately provided then good and usable information cannot be obtained. Education is vital to national development because it provides the citizenry with information that can be used for effective and sustainable planning and management of their resources to get maximum profit for the resources available in their area (Nimala, 2008). Education is a fundamental human right and it is essential to ensure that all are able to realize their potential.
According to Schnenner (1999), location decision making is an essential endeavor for effective public service delivery. The sitting of outlets, production and distribution facilities, and service centers requires location choices to be made. Here these facilities or services are located is a primary factor in the success or failure of the activity. As a result, location analysis approaches which assist planning processes continue to be important in both the public and private sectors given the costs and viability implications involved (Murray, 2002).
The trend towards using geographic information systems (GIS) to support decision making for ministries of education and educational facilities are becoming very important for planning purposes. GIS is the implementation stages in many developed countries of the world and also in developing countries. Makino and Watanabe (2002) concluded that GIS is a very useful tool to analyze the school planning situation.
Besides the simplification of educational administration and expansion of compulsory education, enforcing the clear school planning policies and creating a digital database that can be used in GIS; this will have more positive influence on improving school services and qualities for the current and failing children (Eray, 2012).
Geographic Information System (GIS) is a powerful set of computer-based tools used to collect, store, manipulate, analyze and display spatially referenced information (Burrough and McDonnell 1998). GIS techniques such as school mapping have been used in the last two decades for education planning (Mauire, Godchild and Rhind, 1991). Mapping of schools is a normative approach to the micro-planning of school locations. It is also used to investigate and ensure the efficient and equitable distribution of resources within and between school systems when large-scale reform or significant expansion of an educational system takes place (Caillods, 1983).
GIS database provides a comprehensive framework and organization of spatial and non-spatial data to efficiently help decision makers and planners.
It apparently provides a mapping tool for the relationships between the distribution of schools and the school age population within the populated areas (Hite, 2006). It is an efficient tool in managing and planning the accessibility to the educational facilities. High population growth in developing countries always put excessive pressure on government for facility management unless there is a tool to help decision makers in locating of schools according to the standardized criteria, it will be mystery planning.
MATERIALS AND METHOD
Study Area
Umuahia North is made up of these villages and town (Ohokobe, Ndume Ibeku, Ossah Ugwnihara Emede, Amuzukwu, Afara-Ukwu, Nkata, Umukabia, Umuawa Alaocha, Amaogwugwu, Umuagu,Umuekwule, Ofeme, Umuda Isingwu and Nkwegwu) head quartered at Ibeku umuahia, Abia state, Nigeria. It is located within latitudes 5° 31’ 54”N and 5° 33’ 30”N, longitude 7° 29’ 47”E and 7° 27’ 46” E. It has an area of 245km2 and a population of 220,660(NPC,2006).In Umuahia, the average annual temperature is 26.0 °C. Precipitation here averages 2153 mm. Precipitation is the lowest in December, with an average of 15 mm. Most precipitation falls in September, with an average of 322 mm. At an average temperature of 27.5 °C, March is the hottest month of the year. In August, the average temperature is 24.5 °C. It is the lowest average temperature of the whole year.
The annual seasonal variation in the average percentage of sky covered by clouds in Umuahia is quite pronounced. Around November 24 marks the start of Umuahia’s clearer season, which lasts for 2.6 months and ends around February 10.In Umuahia, December is the clearest month of the year, with the sky remaining clear, mostly clear, or partly overcast 41% of the time. Around February 10 through November 24, there is a 9.4-month period of increased cloud cover. In Umuahia, April is the month with the most clouds, with the sky being overcast or mostly cloudy 85% of the time on average.
Umuahia North LGA has a viable trade sector and the area hosts a number of markets such as the Ubani main market and the Industrial market in Azueke Ndume Ibeku which attract a multitude of buyers and sellers of different commodities. The LGA also hosts a number of banks, hotels, industries, as well as government owned establishments.
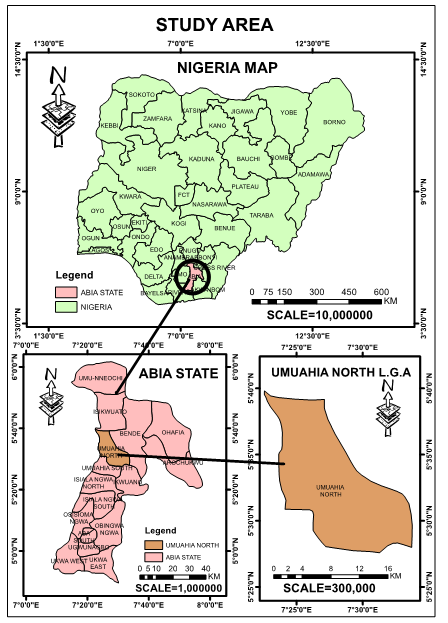
figure 1: Map of Study Area.
Material
The data that were used in this research include (i) primary and (ii) secondary data.
Primary data and sources
- Google Earth Image of Umuahia North. This was obtained from Google Earth (2023)
- Geographic Coordinates of Secondary Schools using a handheld Global Positioning System (GPS).
- Data on the available facilities in each school e.g. number of classes, class size, number of teachers, number of students, taught subjects, libraries, laboratories, sporting facilities etc. These were obtained through administering questionnaires.
Secondary Data and Sources
- Literature materials were acquired from appropriate sources which include related books, journals, research thesis/proposals, documents and materials from related websites.
Method
The KML data that was saved through the google earth pro was imported into the ArcGIS environment and converted to a layer. This was done by converting the KML data using the Arc Toolbox, the layer was put on geographical coordinate system in World Geodetic System(WGS)84 projection system, for easy spatial mapping.
The subset imagery of the study area was then digitized to delineaterelevant featuresin Google earth and then converted to kml format that Arc GIS will read (roads, settlements, bridge, and rivers/streams) and all the shapefiles created using ArcGIS 10.1 .The shape files represent relevant features in point, line orpolygon forms. The non-spatial data were organized as attribute table and related to the geographicallocations/coordinates of the schools to create a geo database. All the attributes acquired usingthe questionnaire were copied into an attribute table, saved as a database file format in theArcGIS software and stored for analysis. This was done by adding required number of fields (columns) to the table and entering the data for all the schools in their corresponding records(rows).
- Identify and locate all Secondary schools within the study area.Thenames and addresses of these schools were identified. The coordinates of each school inthe study area were acquired with a handheld GPS and copied in Microsoft excel, CSV (command limited) format.
- Mapping the spatial distribution of the schools within the study area. The digitized base map of the study area was geo referenced in ArcGIS 10.1.Thelocations of the secondary schools acquired with the handheld GPS were copiedinto Microsoft Excel in tabular form. Using the add XY tool in ArcGIS, the locations ofall the secondary schools were imported into the software interface. All shape filesholding relevant data layers were then spatially overlaid to create a combination visualmap of point, line and polygon feature classes. Thus the X and Y displayed the geo referenced locations of each school in the study area.
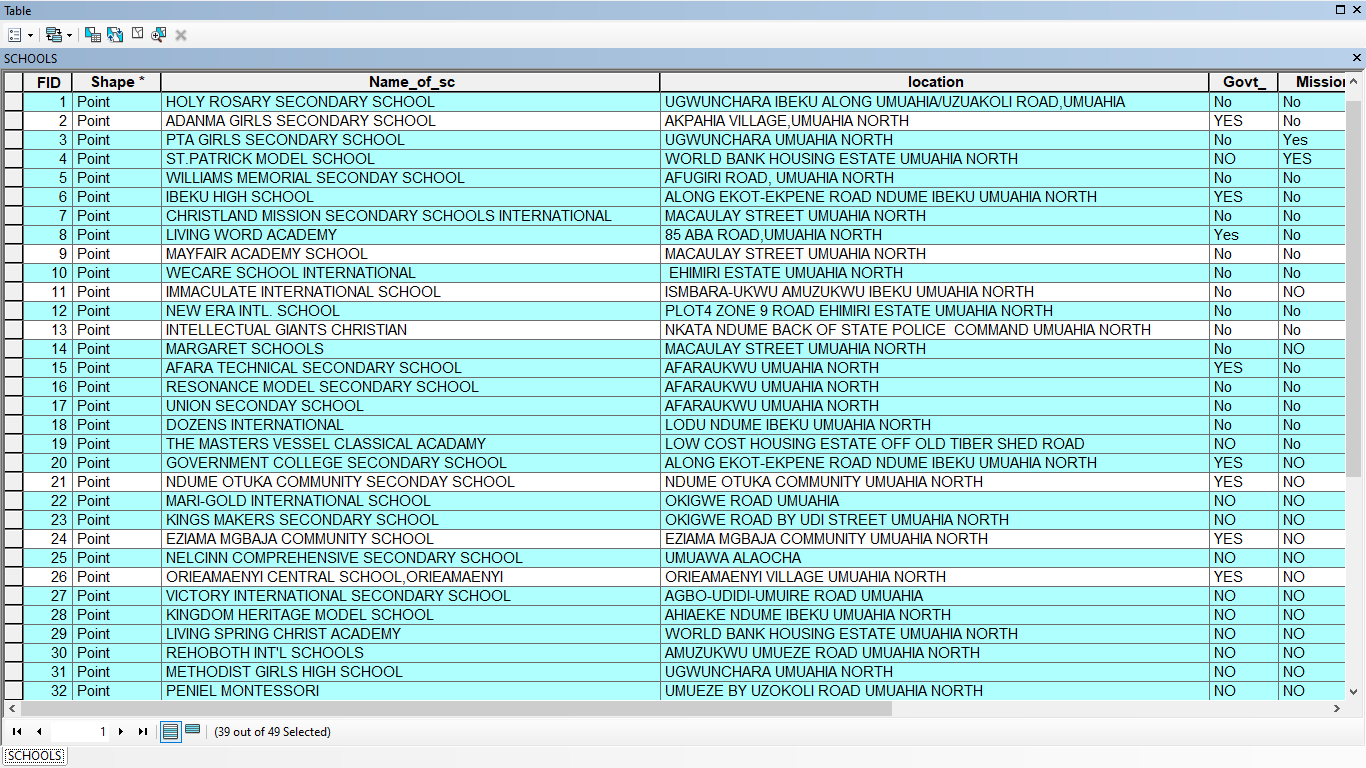
- Create a geo-database for Secondary Schools within the study areaBased on the geographical coordinates and the data derived from the questionnairesadministered to all 49 secondary schools, a geo-database was created usingArcGIS 10.1 software. In the development of the geo database, the data from each schoolwere entered into an attribute table. Tables were created in the ArcCatalog extension of ArcGIS and database file were created. The required number of fields (columns) were be added to the table together with the attributes for all Secondary Schools in their corresponding fields (rows). The relational database management system (RDMS) modelwas used in creating the geo-database. Query operation was performed to extract relevant information about the schools using the Query builder. Structured Query Language (SQL) was used to manipulate the data during the Query operation.
RESULTS
The results produced a locational analysis of post primary school in Umuahia North Local Government Area, Abia State.

Figure 2 Spatial distribution of secondary schools
This shows the spatial distribution of secondary schools in Umuahia North local government area of Abia state plotted in Arc GIS software environment from the coordinates of the post primary schools. From the figure, it was observed that Umuahia North local government area of Abia state have forty-eight (48) post primary schools.

Figure 3 Spatial distribution pattern of secondary schools
In an attempt to understand the distribution pattern of secondary schools in the study area, spatial analysis location was carried out in the ARC GIS 10.1 to determine how the schools are spatially distributed. With due observation, it was noticed that the schools were linearly distributed close to the road for easy access. Some of the schools that were not linearly distributed were dispersed in the locality to meet the secondary school-agepopulation’s educational requirement.
The analysis of the accessibility of schools was based on the UNESCO standard of two kilometers (walking distance to school).
Although the schools are accessible to a majority of the population most of the schools were not sited based on the UNESCO set standards (two-kilometer walking distance from residence).
This means that some of these schools are not utilized to their maximum capacity while others are over-utilized. In implementing the compulsory free education program, many states in Nigeria stipulated that schools should be located not more than one kilometer from the residences of the communities to be served. This was one major reason why schools were opened in almost every hamlet in the country. But today it does appear that many Nigerian children still travel long distances to and from school. No set standards were made with regard to walking distance from residence to the knowledge of the researcher.
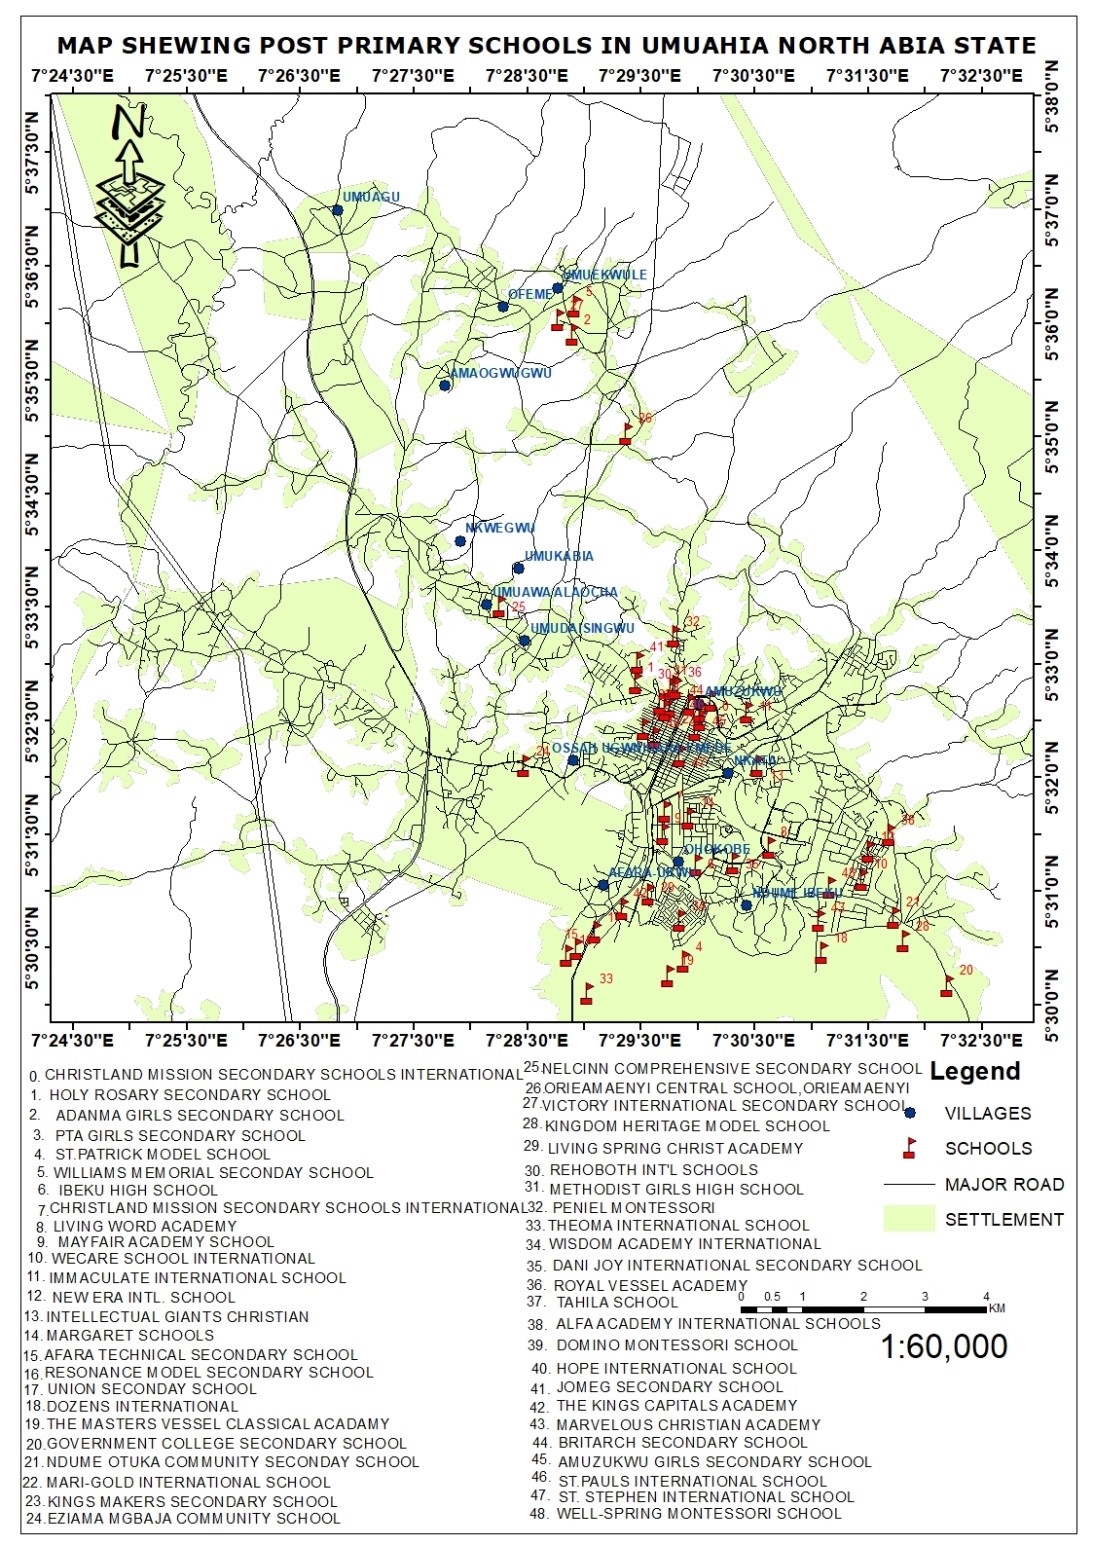
Figure 4. Spatial accessibility of secondary schools
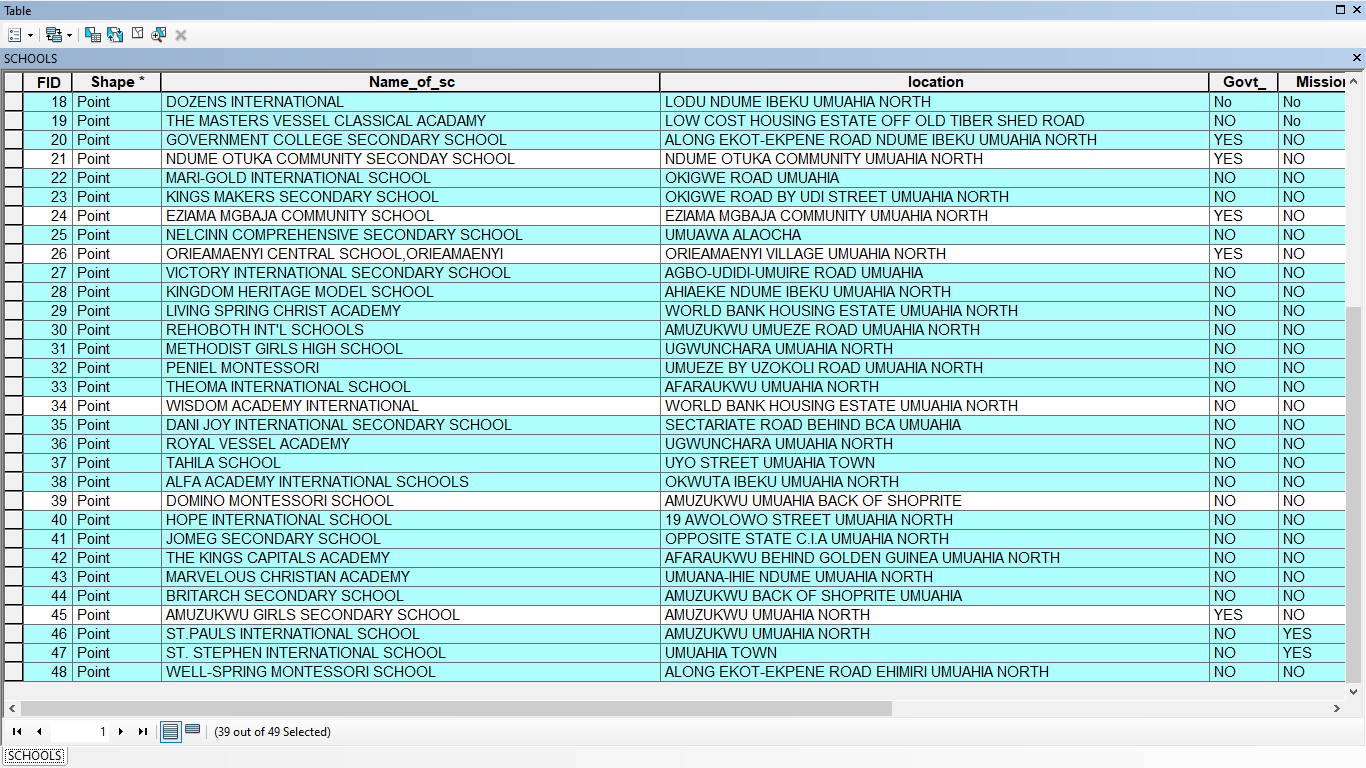
This table was created from the data obtained from the field survey. This table was used to create the geo-database file. A query of some basic facilities from the database created was done and the resultant results are shown below.
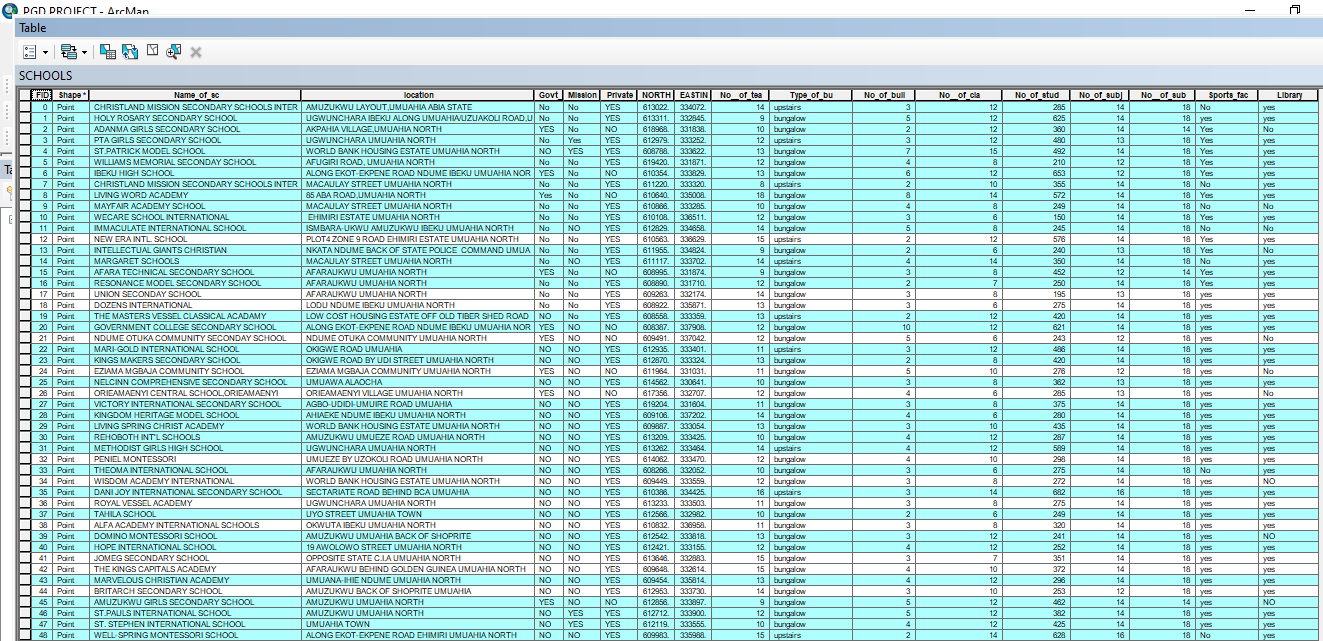
The table shows that 26.53% (13) of the schools have no laboratories while 73.47% (36) have laboratories. The laboratories in the secondary schools include the following: physics, chemistry, biology, computer, agricultural science, food and nutrition, home economics, fine art, technical drawing and woodwork. These laboratories may vary in some schools because of the subjects being offered in the schools.
TABLE LABORATORIES DISTRIBUTION IN THE SCHOOLS
| Laboratories | No. of schools | percentage (%) |
| Schools with no laboratories | 13 | 26.53% |
| Schools with laboratories | 36 | 73.47% |
| TOTAL | 49 | 100% |
This table shows 20.41% (10) of the schools have no libraries while 79.59% (39) have libraries. The table shows the distribution of libraries in the secondary schools.
LIBRARY DISTRIBUTION IN SCHOOLS
| Library | No. of schools | percentage |
| Schools with libraries | 39 | 79.59% |
| Schools with no libraries | 10 | 20.41% |
| TOTAL | 49 | 100% |
Some of the schools with libraries also have internet services which aid the students with current literature materials not available in the libraries for their research work and assignment, while the schools without libraries make use of the textbooks and teaching aids provided by the schools and teachers. Students are sometimes asked to visit close by internet cafes or libraries for assignments and research work.
Well spring Montessori School is the school with the highest number of classrooms (14) and Wecare School International with the lowest number of classrooms (6). It was also shown, using the classroom capacity of 1 teacher: 30 students (UNESCO standard 2002), with the total population of students in each classroom, that none of the secondary schools in the study area meets this standard. 84% of the post primary schools in the study area have a classroom population of more than 30 students, while 16% have a classroom population of less than 30 students.
CONCLUSION
The project illustrated the effectiveness of Geographic Information System (GIS) in analyzing the location and the creation of a geo database for secondary schools in Umuahia North. GIS is one of the information technologies that have evolved to allow people to solve many geographic problems quickly, effectively and easily with the abilities to make analysis, especially location analysis in combination with traditional database systems. The findings of this project revealed the following:
- Umuahia North consists of 49 secondary schools. And these schools are meant to provide the 14 localities within the zone with secondary school education.
- The study revealed that distribution of these schools was not equitable. The populations of the localities were not always considered before the schools were sited at their current location.
- It was also observed that 20.41% (10) of the schools do not have libraries, and
26.53% (13) do not have laboratories. Other facilities such as classrooms are inadequate because of the student population. 61% (30) of the public secondary schools in the study area are over populated.
REFERENCES
- Alzeer N.M. (2005). Analysis of the Spatial Distribution of Public Secondary Girls` and Boys` Schools in Riyadh, Saudi Arabia. Thesis submitted for the degree of Doctor of Philosophy at the University of Leicester.
- Anwaruddin, A. (2005). Improving Public Service Delivery through Bureaucracy Reform. A paper presented at NAPSIPAG. Pp. 537. Retrieved from http://mazawang.wordpress.com/2009/12/11/improving‐public‐service‐delivery‐throughbureaucy reform/.
- Arubayi, E.A. (2005). Comparing average distance travelled to schools by students in primary and secondary schools in Delta and Edo States and its effect on attendance. Delsu Journal of Educational Research and Development, 4(1), 1-9.
- Asiyai, R.I. (2012).Assessing school facilities in Public Secondary Schools in Delta State.
African Research Review: International multidisciplinary journal, Ethiopia, Vol.6 (2)
Serial No.25 pp192-205. - Association of American Geographers (2001).GIS for beginners. International Centre for
Integrated mountain Development. Retrieved from http://www.aag.org/galleries /mycoefiles/OT3_GIS_for_beginners.pdf 20/10/2014. - Attfield, I., Tamiru, M. & Parolin, B. (2002). Improving Micro-Planning in Education through a Geographical Information System: Studies on Ethiopia and Palestine.
- Babatimehin, O., Ayanlade, A., Babatimehin, M. & Yusuf, J.O. (2011).Geo-Political Patterns of Health Care Facilities in Kogi State, Nigeria. The Open Geography Journal, 4, 141-147.
- Barro, R. & Jong-Wha, L. (2000). International Data on Educational Attainment. Updates and Implications. NBER Working Paper # 7911.
- Burrough, P.A. & McDonnell, R.A. (1998). Principles of Geographical Information Systems. New York: Oxford University Press.
- Burtch, B. (2006). Education law and social justice. In A. Oduaran& H. S. Bhola (Eds.),
Widening access to education as social justice Netherland (pp. 83-94): Springer - Caillods, F. (1983). Module I: School mapping and micro‐planning concepts and processes. In Caillods, F., Casselli, J., Châu, T.N and Porte, G. (Eds.). Training materials in educational planning, Administration and facilities: School mapping and micro‐planning in education.
- Calson, C. Lamalle, J.P, Fusfukian S. Katy, N.J, Sibbons, M. & Sondonp, E. (2005) Improving the delivery of health and education services in different environments: lessons from case studies. Londan : DFID Health systems resource System Resource centre.
- Erag .O (2012), Application of Geographic Information Systems (GIS) in education Journal of technical science and technologies 1(2):53-58,2012. 1SSN: 2298-0032.
- Hite, S.J (2006). GIS Generated school mapping materials of two countries in Hungary. Prepared and for francoise caillods IIEP/ UNESCO.
- Kayode A. Adagba, S.O and Anyio, S.F (2013) corruption and service delivery: the case of Nigeroa public service. Wudpecker journal of public administration, 1(1) 1-6.
- Koppen, W. (1928). Kilmakarte de Erde. Gotha: Justus Perthes, pp 23-45.
- Lagrab, W. &Aknin, N. (2015). Analysis of Educational Services Distribution-Based
Geographic Information System (GIS). International Journal of Scientific & Technology
Research, 4(3), 63-91. - Maguire, D.J., Goodchild, M.F., &Rhind, D.W. (1991). Geographical Information Systems: Principles and Applications. Harlow: Longman.
- Makino, Y &Wanatabe, S (2002).The application of Geographic Information Systems (GIS) to school mapping in Bangkok. Asian Conference on Remote Sensing, Thailand, pp.1.
- Mörtberg, U.M., Balfors, B., &Knol, W.C (2007). Landscape Ecological Assessment: A tool for integrating biodiversity issues in strategic environmental assessment and planning.
- Nirmala K.C (2008). The impact of the participation of non-government organizations upon the heakth service delivery in Nepair refried from http://www.pactu.edu.np 20/01/2024. Journal of Environmental Management, 82(4), 457–470.
- Murray, A.L. (2002). Site Placement Uncertainty in Location Analysis. Department of
Geography, the Ohio State University, Columbus, OH 43210, USA (2002) Elsevier Science Ltd. All rights reserved. Computers, Environment and Urban Systems 27 (2003) 205–221. - National Population Commission (2006). Federal republic of Nigeria official gazette. Lagos:the Federal Government Printers No. 24 Vol.94 pp B187
Nirmala, K.C. (2008). The Impact of the Participation of Non-Governmental. - Schmenner R.W (1979) looking beyond the obvious in plant location, Havard Business Review, 57(1), 126-138.
- Wild, L. Chamber, King M. & Harris D. (2012) common constraints and incentive problems in service delivery. Overseas department institute, 111 west minister bridge road, London SEI 7JD. Retrieved from http:/ww.odiorg.uk. 12/02/2024 .
- World development report, (2004) making services work for poor people. The international bank for reconstruction and development.