
Assesment of Some Heavy Metals in Fish Organs, Water, Sediment and Synthetic Fish Feed from Maladumba Dam and Fada Farm Misau L.G.A Bauchi State
- DR. Abubakar Chadi Sadiq
- Abubakar Babangida
- 410-421
- Jun 6, 2024
- Environmental Assessment
Assesment of Some Heavy Metals in Fish Organs, Water, Sediment and Synthetic Fish Feed from Maladumba Dam and Fada Farm Misau L.G.A Bauchi State
DR. Abubakar Chadi Sadiq1, Abubakar Babangida*1
1Department of Chemistry, Faculty of Science,
Bauchi State University Gadau, Bauchi, Nigeria.
*Corresponding Author
DOI: https://doi.org/10.51244/IJRSI.2024.1105027
Received: 03 April 2024; Revised: 19 April 2024; Accepted: 24 April 2024; Published: 06 June 2024
ABSTRACT
This research is aimed at assessing the level of the heavy metals: Copper (Cu), Chromium (Cr), Cobalt (Co), Cadmium (Cd), Iron (Fe), lead (Pb), Nikel (Ni), Silver (Ag), Zinc (Zn), and Manganese (Mn) in some fish organs, water and sediment from Maladumba and Fada Darm Misau Local Government Area Bauchi State. The organs (gut, gills, liver and flesh) of Mudfish (Clariasanguillaris), Tilapia (Oreochromisniloticus), water and sediment were collected and prepared from two different sites. Prepared samples were digested using freshly prepared aqua Regia method with an acid mixture of (HNO3 + H2SO4 + HClO4) in the ratio (2:1:1). Analysis of the samples was done using Atomic Absorption Spectroscopy (AAS). This study revealed that majority of the sample analyzed contained Cd, Mn and Cu Concentration above WHO’S maximum permissible level of these metals, these result agrees with other finding reported from Sharada and Jakara Kano State, Nigeria. In this study Ag was not detected in all the samples, this may be due to the below detection limit of the analytical technique used. The high concentration of heavy metals obtained in this study may be due to Agricultural and Ceramic industrial activities within the study area. Results showed that the Fish from Maladumba And Fada Ponds may be consumed with the exception of Pb, Cd Mn and to some extent Cu, and Fe in Water, Sediment, and some fish organs that indicates above maximum permissible limits. To sustain a healthy freshwater ecosystem and prevent health problem to the locals, concentration of heavy metals should be monitored regularly. Appropriate measure such as legislative provision and other tools for effective and environmental monitoring should be mounted and used with a view to protecting and enhancing the better quality and resources of these Dams.
Keywords: Heavy Metals, Fish Organs, Sediment, Maladumba Dam, Atomic Absorption Spectrophotometer (AAS).
INTRODUCTION
Fish has become the main supply of protein besides meat and poultry products and contributed to a large percentage of dietary protein globally. Fish are an important resource for humans worldwide, especially as food. The aquatic environment with its water quality is considered as the main factor controlling the state of health and disease in both cultured and wild fishes. Pollution of the aquatic environment by inorganic and organic chemicals is a major factor posing serious threat to the survival of aquatic organisms including fish. Heavy metals are considered the most important form of pollutants in the aquatic environment because of their toxicity and accumulation by marine organisms (Malik et al., 2000).
Owing to the fact that, presence of heavy metals in most of our foods above the allowable or permissible limit accounts for assorted medical disorder in human, there is a great need for quantitative analysis of these heavy metals in the food substances specifically fish prior to consumption. Some of these heavy metals such as lead are carcinogenic which is life threatening (Duruibeet al., 2007).
Incidences of heavy metal poisoning in various parts of the world have been of concern to scientists, policy makers and the general public. Food contamination especially by heavy metals is one of the major concerns nowadays. Fish, being a major source of animal protein, is consumed by majority of people in the world. Accumulation of toxic metals by fish usually occurs when fish are bred and raised in contaminated aquatic environment or when fish are exposed to heavy metal contaminated dust during transportation and/or processing. Because of the health hazard associated with the heavy metals and high rate of fish consumption, it is therefore, become imperative to monitor by assessing the level of heavy metals in all food items for health safety reasons.
This research is aimed at assessing the level of the heavy metals: Copper (Cu), Chromium (Cr), Cobalt (Co), Cadmium (Cd), Iron (Fe), lead (Pb), Nikel (Ni), Silver (Ag), Zinc (Zn), and Manganese (Mn) in some fish organs, water and sediment from Maladumba and FadaDarmMisau Local Government Area Bauchi State.
Food chain is one of the major routes of pollutants to human. Fish could be one of those ways’ human can take in heavy metals.
This research work therefore is designed to provide information with respect to level of this pollutant, heavy metals, and the hazards associated with the consumption of fish.This study is limited to collection and analysis of fish organs (muscle, gut, liver, and gills),of two Species Mudfish (Clariasanguillaris),andTilapia (Oreochromisniloticus), water, and sediments from Two(2) different Dams Maladumba and Fada Farm all in Misau L. G. A of Bauchi State for the heavy metals, Cu, Cr, Co, Cd, Fe, Pb, Ni, AgZn, and Mn.
In Egypt concentrations of Zn, Cu, Pb and Cd were determined in gills, skin and muscles of two fish species (M. cephalus and Liza ramada) from five locations in Lake Manzala (Bahnasawyet al., 2009). They indicated that, the values of the metals detected in the fish muscles (the edible part) were within the permissible levels according to According to National Health and Medical Research Council (NHMRC,1987) limits.
In another study in Nigeria (Christopher et al., 2009) studied the Distribution of Pb, Zn, Cd, As and Hg in Bones, Gills, Livers and Muscles of Tilapia (O. niloticus) from Henshaw town beach market in Calabar. The results showed that the muscle of Tilapia contained the least concentrations of the heavy metals determined.
Study Area
(Source: Department of Land and survey Misau LGA Bauchi State).
Misau LGA lies within latitude 11o18N and 49.32oN and longitude 10o27E and 59.90oE. And land area (size) of 411 meters. Misau is a small city in Nigeria having about 13,957 populations. The most means of living of the people in Misau is Farming and Cattle Rearing.
Fig: 1 Picture of Maladumba Dam in Misau LGA showing the study area.
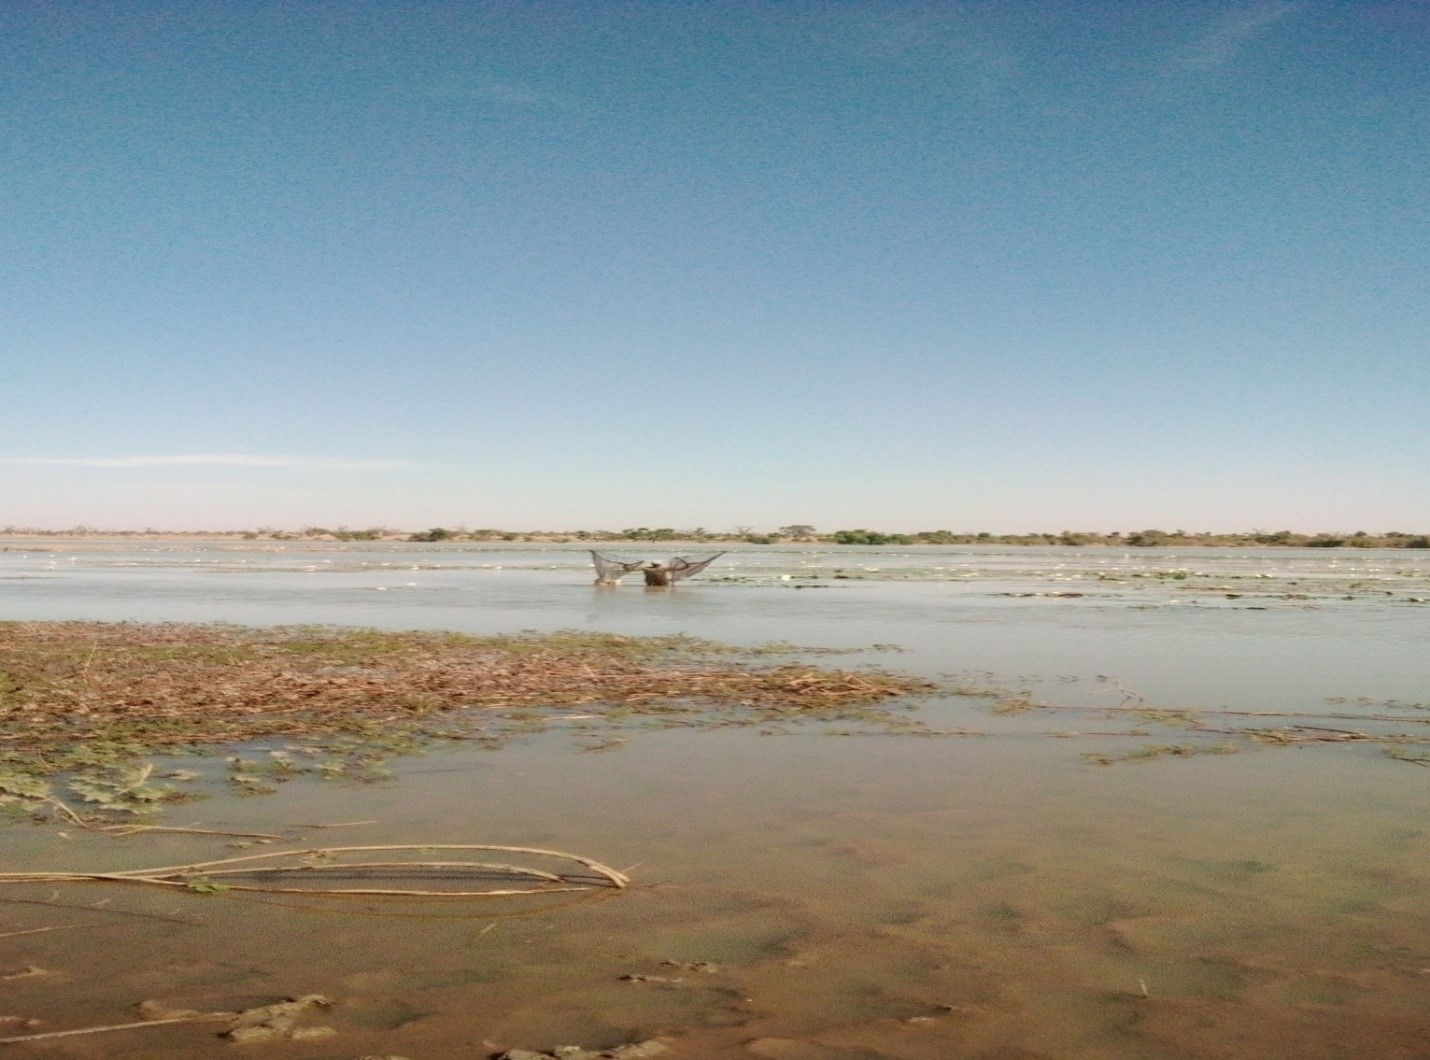
(Source: Abubakar Babangida)
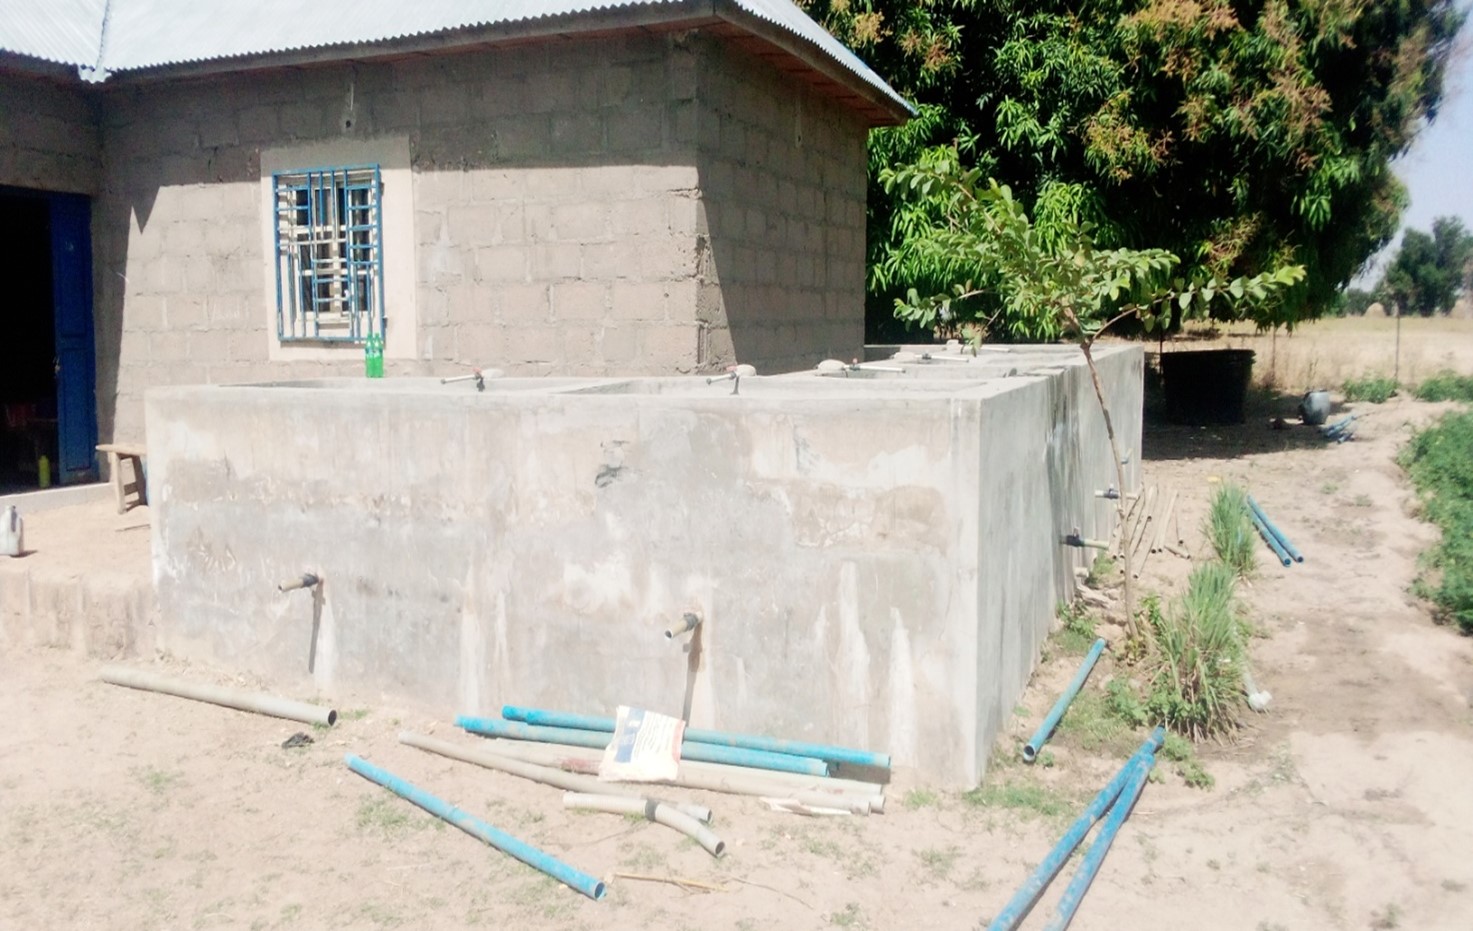
Fig: 2 Picture of Fada farm in Misau LGA showing the study area.
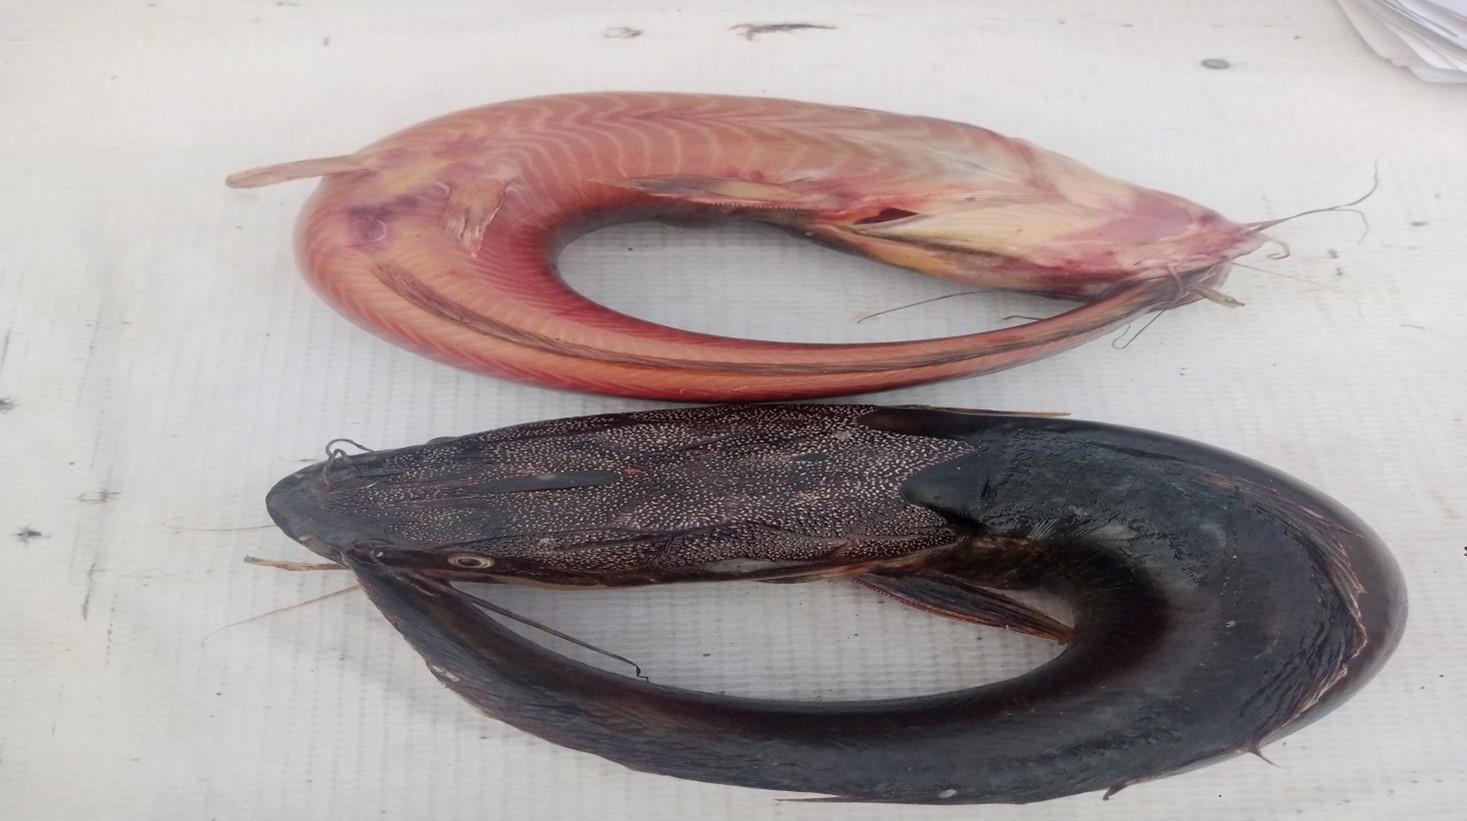
Fig: 3 Picture of Mood Fish
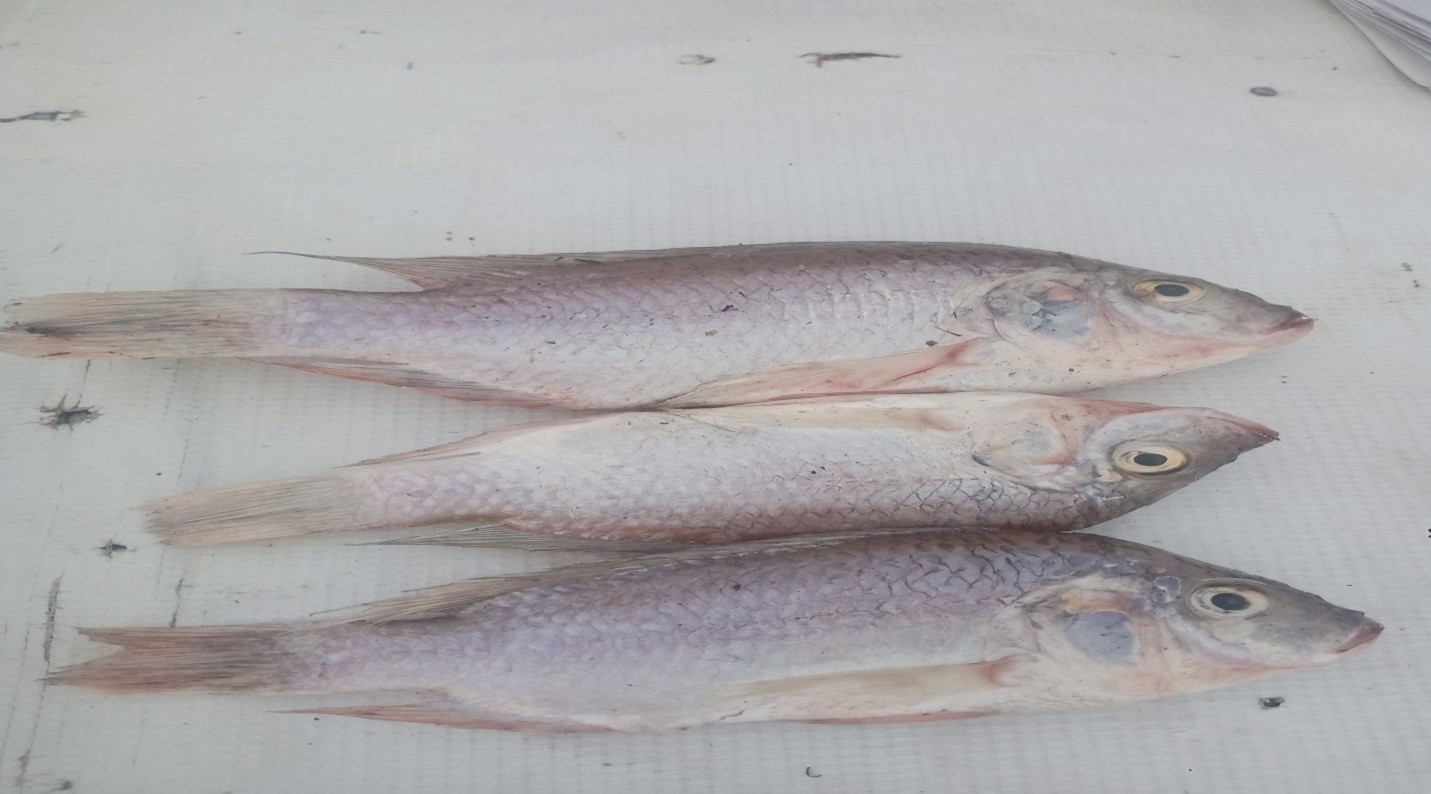
Fig: 4 Picture of Tilapia Fish
MATERIALS AND METHODS
Fish Sample Collection and Preparation
A total of 2two fish species (Tilapia and Mood fish) were collected from 2 Two different Dams (Maladumba, and Fada fish pond) from Misau L. G. A. and were identified by an expert from Biological Science laboratory in Bauchi State University, Gadau. The required organs (gut, gills, liver and flesh) were dissected by an expert. The organs were then transported to the chemistry research laboratory Bauchi State University, Gadau in an ice box, washed and dried separately to a constant weight in an oven at 105oC. The dried samples were then ground and sieved into fine particles as described elsewhere (Akinolaet al, 2011). The samples were put in a dry well-labeled plastic containers and stored in desiccators until digestion (Ayelojaet al., 2014). Digestion was effected by taking 1.0g each of milled organ into a 50ml digestion tube, 20ml of acid mixture of H2SO4, HNO3and HClO4 (2:1:1) were added and heated. Heating was continued until a clear colorless solution was obtained. The digest was cooled and carefully washed with demonized water into a 50ml volumetric flask and made up to mark. Digest was taken for analysis using atomic absorption spectrophotometer (Ayelojaet al., 2014).
Water Sample Collection and Preparation
Water samples from each study sites were collected using an acid (HNO3 acid) pre-cleaned plastic container. Five milliliter (5ml) of concentrated Hcl was added to 250ml of water sample and evaporated to 25ml. The concentrate were then transferred to a 50ml flask and diluted to the mark with distilled water according to AOAC (1995). Metals content were determined using atomic absorption spectrophotometer (AAS).
Sediment Samples Collection and Preparation
Bottom sediment from each study sites were collected into a pre-cleaned polyethylene bag, air dried and sieved with 200mm mesh screen.0.5 g sediment aliquots were digested at room temperature for 2 hrs in 0.6 N Hcl. The digest was filtered with a 0.45mm filter and analyzed using atomic absorption spectrophotometer (AAS) according to (Horn bergeret al.,1999).
Synthetic Fish Feed Samples Collection and Preparation
Synthetic fish feeds (Blue Crown brand) was purchased from Fada Fish pond in Misau LGA. The sample was digested by taking 0.5g of the sample in a 100cm3 kjeldhal digestion flask, 5ml of conc HNO3 (Nitric Acid) was added followed by 1ml each of concentrated H2SO4 and perchloric acid (HClO4). The content was diluted with distilled water and filtered into 100cm3 volumetric flasks according to AOAC (1995). The digest was taken for analysis using atomic absorption spectrophotometer (AAS).
Statistical Data Analysis
All statistical data handling were performed usingMintab 18. Differences in mean concentrations of the heavy metal were determined using One- Sample T test, a significance level of (P > 0.05) was used throughout the study.
RESULTS
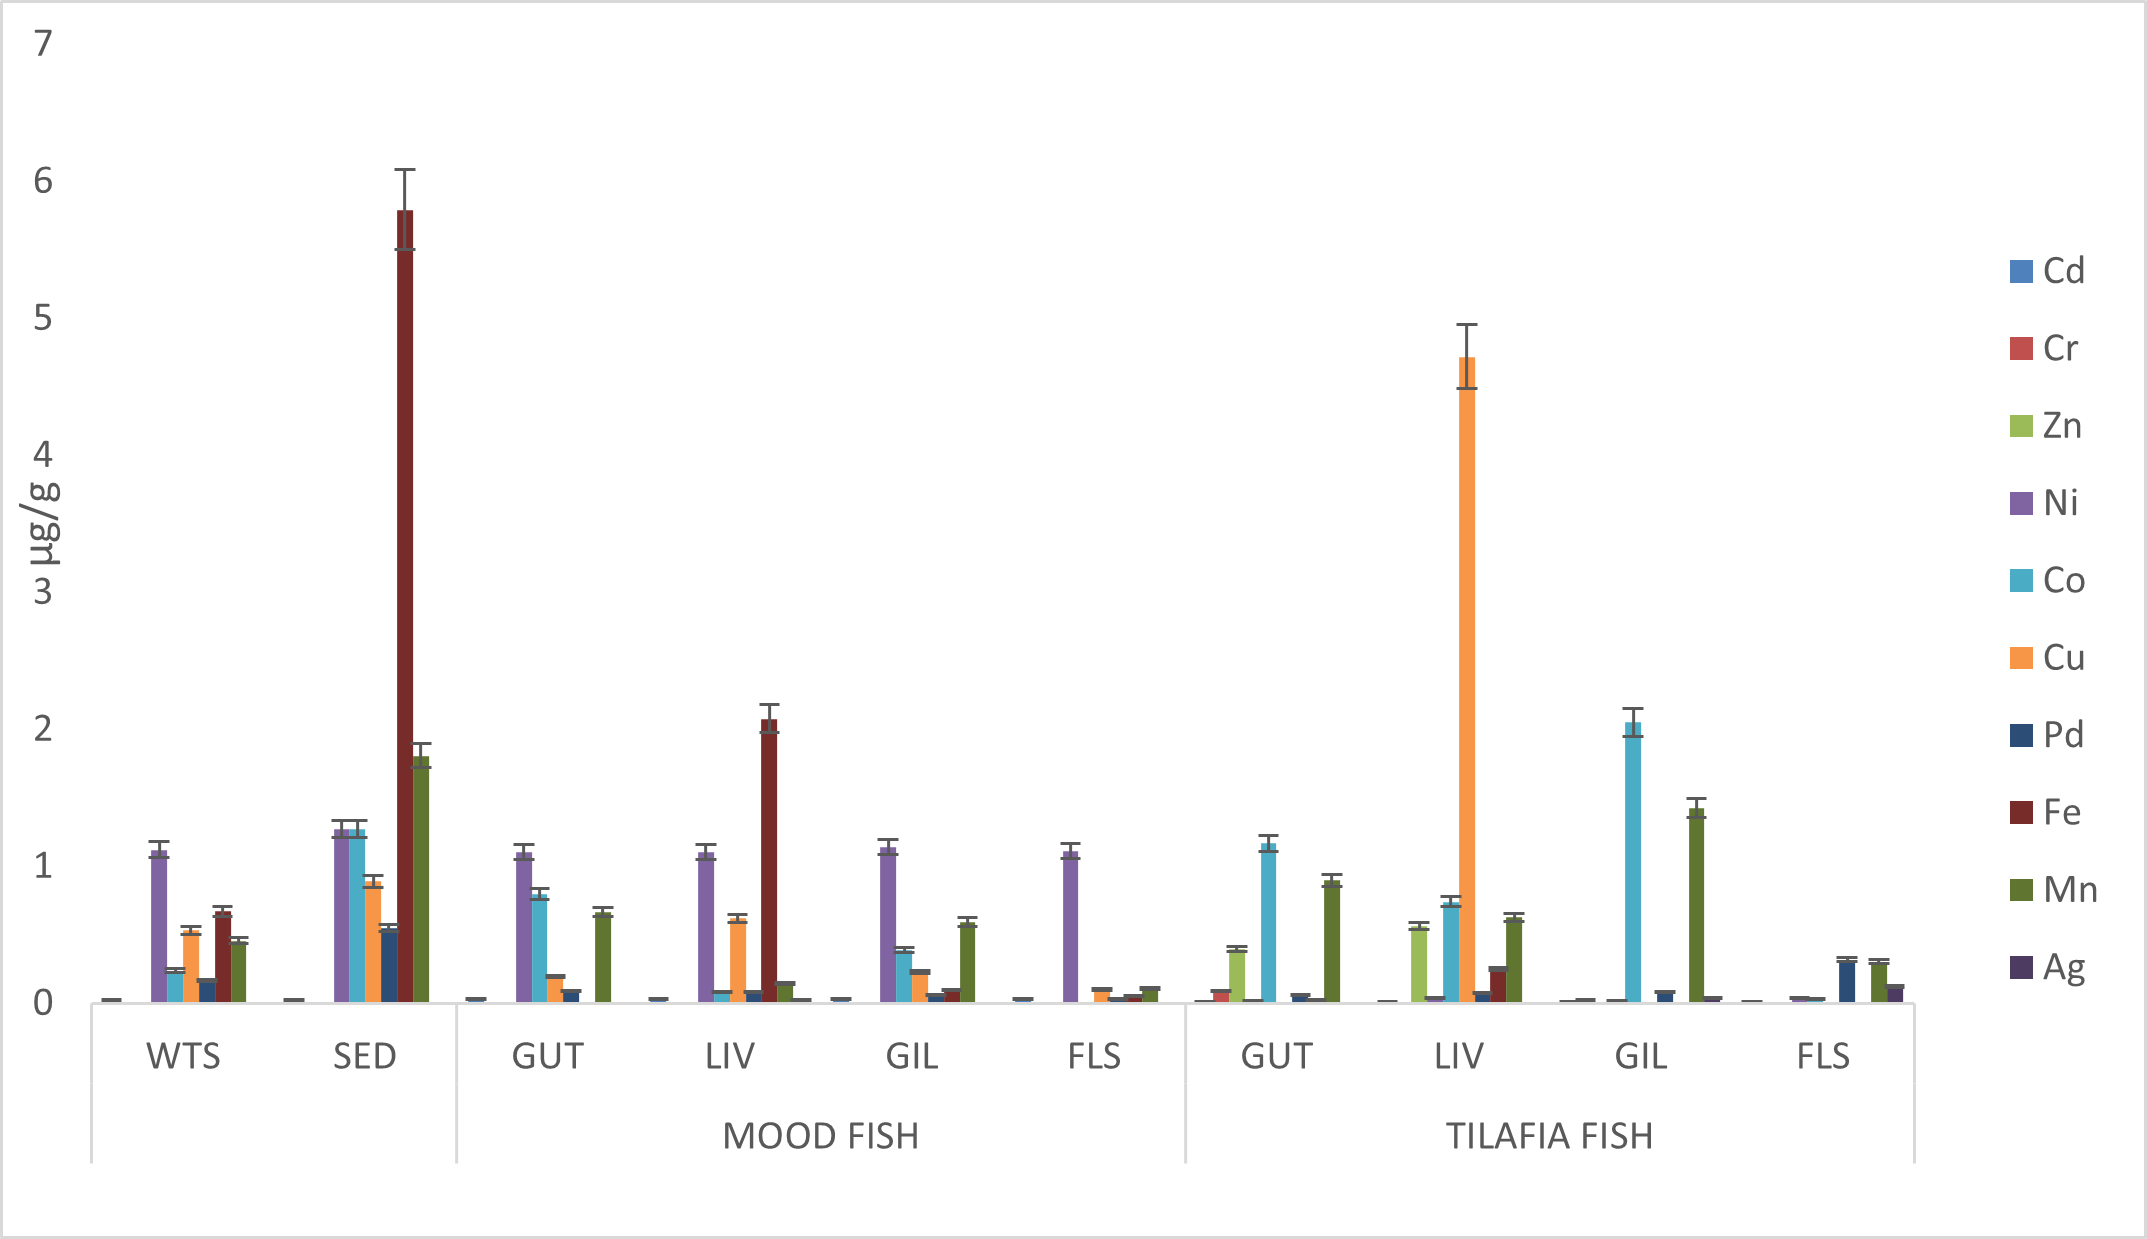
Figure: 5 shows the concentration of heavy metals in different samples from Maladumba dam.
Keys: WTS = Water Sample, SED = Sediment Sample, GUT = Gut organs sample, LIV = liver organs, GIL = Gills organs, FLS = Flesh organs.
Table 1: Heavy metal concentration in water and sediment samples from Maladumba dam
| Heavy Metal | Water Sample | Sediment |
| Cd | 0.0249 ± 0.0022* | 0.0253 ± 0.0021* |
| Cr | ND | ND |
| Zn | ND | ND |
| Ni | 1.1201 ± 0.0330 | 1.2753 ± 0.0410 |
| Co | 0.2374 ± 0.642 | 1.2729 ± 0.0289 |
| Cu | 0.5239 ± 0.0460* | 0.8899 ± 0.0394* |
| Pb | 0.1636 ± 0.0110 | 0.5474 ± 0.0193* |
| Fe | 0.6691 ± 0.0780 | 5.7920 ± 0.5343* |
| Mn | 0.4553 ± 0.0083 | 1.8069 ± 1.6054* |
| Ag | ND | ND |
Keys: * shows the values are above the maximum permissible limits significance level at P < 0.05.
ND = Not detected that is the values are below the detection limit of the analytical technique used.
Table 2: Heavy metal concentrations in different organs of Mood fish Maladumba dam
| Heavy Metal | Gut | Liver | Gills | Flesh |
| Cd | 0.033 ± 0.009 * | 0.034 ± 0.004 * | 0.035 ± 0.001 * | 0.031 ± 0.003 * |
| Cr | ND | ND | ND | ND |
| Zn | ND | ND | ND | ND |
| Ni | 1.103 ± 0.015 | 1.099 ± 0.013 | 1.139 ± 0.039 | 1.110 ± 0.037 |
| Co | 0.794 ± 0.036 | 0.085 ± 0.014 | 0.386 ± 0.015 | ND |
| Cu | 0.194 ± 0.085 * | 0.618 ± 0.012 * | 0.229 ± 0.036* | 0.099 ± 0.051* |
| Pb | 0.089 ± 0.042 * | 0.080 ± 0.043 | 0.062 ± 0.021 | 0.029 ± 0.053 |
| Fe | ND | 2.076 ± 0.062 * | 0.094 ± 0.013 * | 0.054 ± 0.027* |
| Mn | 0.667 ± 0.023 * | 0.145 ± 0.013 * | 0.592 ± 0.001 * | 0.107 ± 0.007 * |
| Ag | ND | ND | ND | ND |
Keys: * shows the values are above the maximum permissible limits significance level at P < 0.05.
ND = Not detected that is the values are below the detection limit of the analytical technique used.
Table 3: : Heavy metal concentrations in different organs of Tilapia fish from Maladumba Dam
| Heavy Metal | Gut | Liver | Gills | Flesh |
| Cd | 0.011 ± 0.007* | 0.011 ± 0.002 * | 0.013 ± 0.003 * | 0.015 ± 0.004 * |
| Cr | 0.088 ± 0.059* | ND | 0.025 ± 0.015 * | ND |
| Zn | 0.395 ± 0.043* | 0.562 ± 0.22 * | ND | ND |
| Ni | 0.019 ± 0.006* | 0.036 ± 0.007 * | 0.015 ± 0.004 * | 0.037 ± 0.003 |
| Co | 1.166 ± 0.039 | 0.738 ± 0.003 | 2.050 ± 0.041 | 0.316 ± 0.016 |
| Cu | ND | 4.718 ± 1.268 * | ND | ND |
| Pb | 0.056 ± 0.033 | 0.071 ± 0.040 | 0.077 ± 0.067 * | 0.136 ± 0.040 |
| Fe | 0.027 ±0.054 * | 0.248 ± 0.027 * | ND | ND |
| Mn | 0.895 ± 0.008* | 0.626 ± 0.008 * | 1.424 ± 0.005* | 0.303 ± 0.014 * |
| Ag | ND | ND | ND | ND |
Keys: * shows the values are above the maximum permissible limits significance level at P < 0.05.
ND = Not detected that is the values are below the detection limit of the analytical technique used.
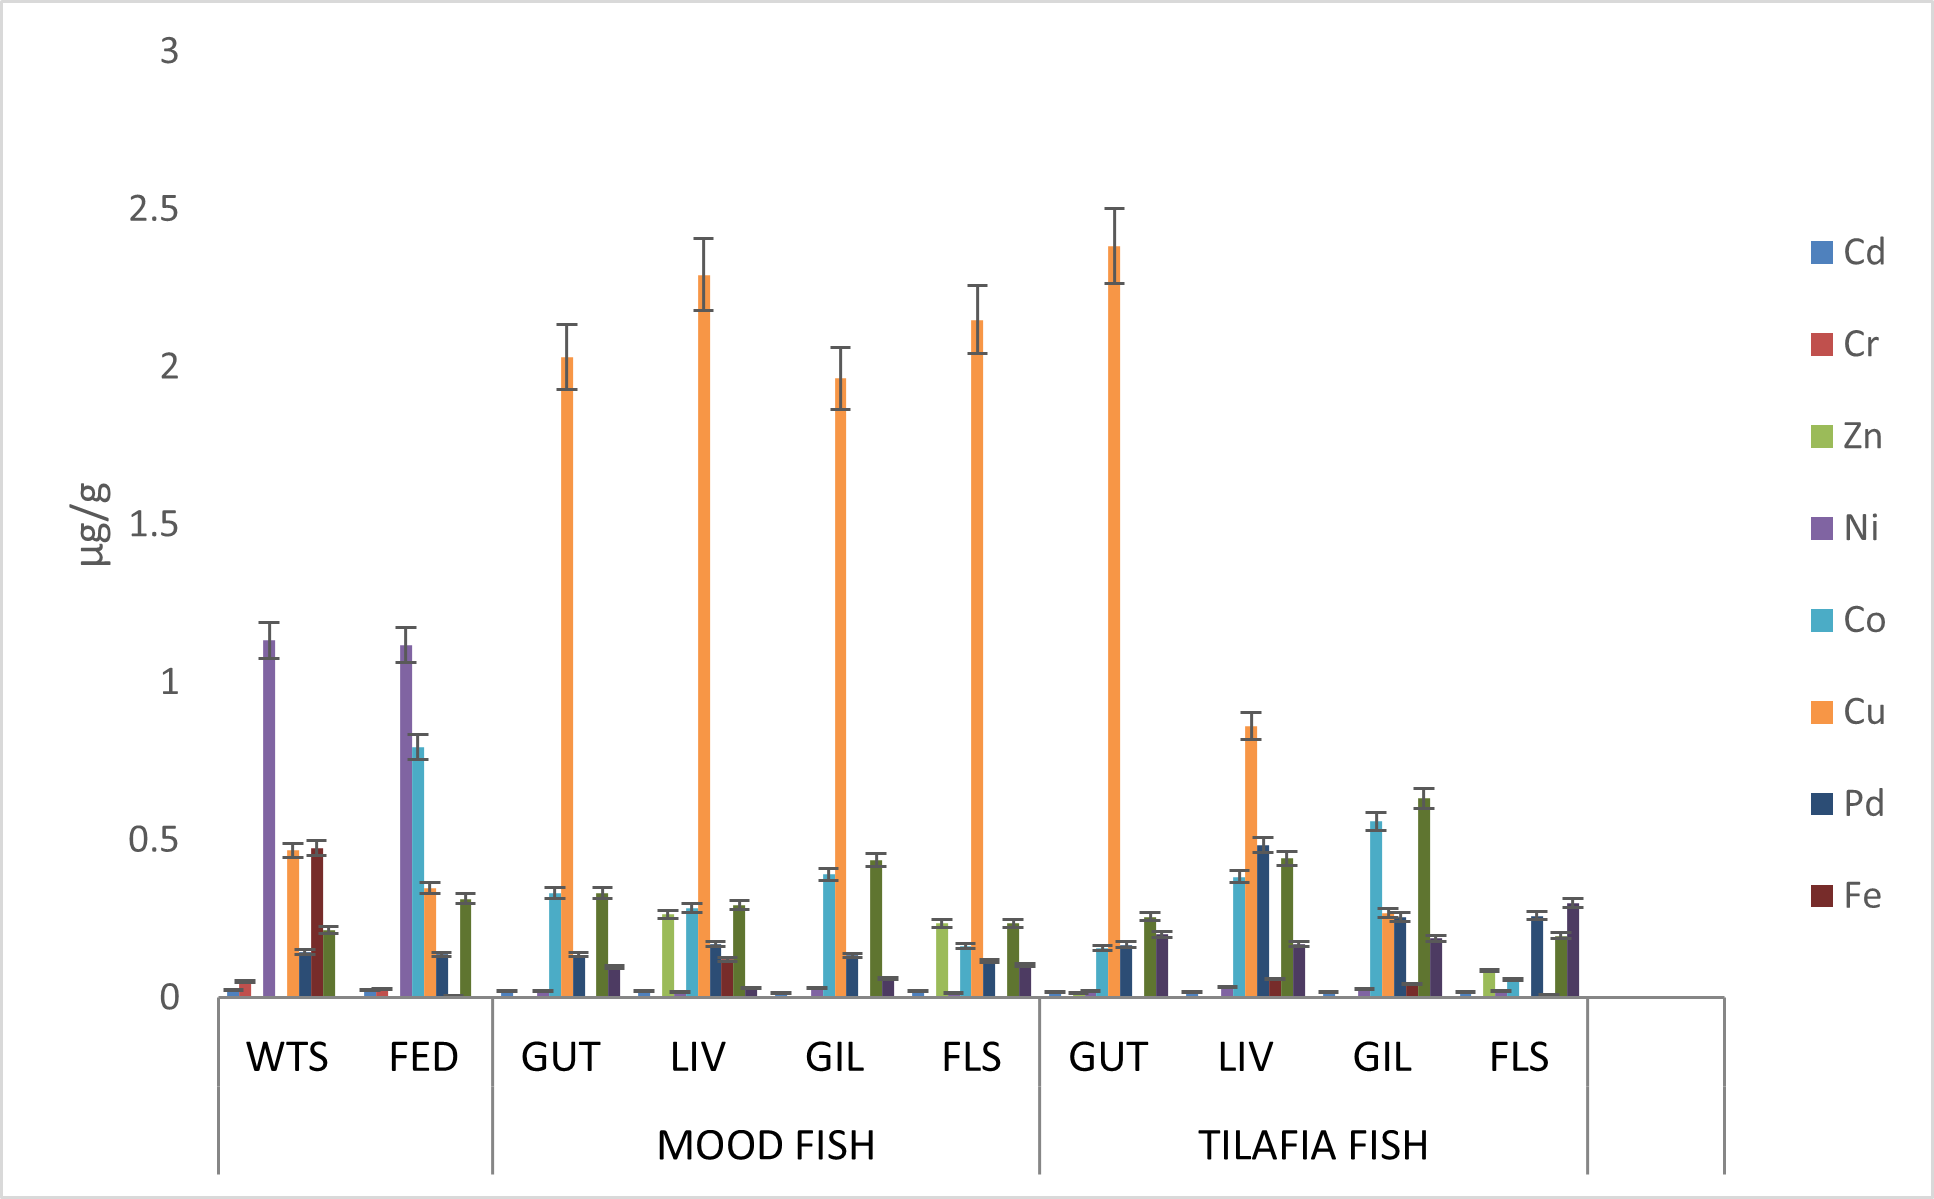
Figure: 6 Chart showing the concentration of Heavy metals for Sample Site Two (Fada Fish Pond).
Keys: WTS = Water Sample, FED = Feed Sample, GUT = Gut organs sample, LIV = liver organs, GIL = Gills organs, FLS = Flesh organs.
Table 4: Heavy metal concentration in water and Feeds samples from Fada fish pond.
| Heavy Metal | Water | Feeds |
| Cd | 0.025 ± 0.002 * | 0.026 ± 0.002 * |
| Cr | 0.050 ± 0.085 * | 0.028 ± 0.018 * |
| Zn | ND | ND |
| Ni | 1.132 ± 0.050 | 1.119 ± 0.021 |
| Co | ND | 0.793 ± 0.005 |
| Cu | 0.467 ± 0.023 * | 0.349 ± 0.052 * |
| Pb | 0.145 ± 0.019 | 0.137 ± 0.005 |
| Fe | 0.475 ± 0.026 * | 0.007 ± 0.031* |
| Mn | 0.213 ± 0.006 * | 0.314 ±0.009 * |
| Ag | ND | ND |
Keys: * shows the values are above the maximum permissible limits significance level at P < 0.05. ND = Not detected.
Table 5: Heavy metal concentrations in different organs of Mood fish from Fada fish pond.
| Heavy Metal | Gut | Liver | Gills | Flesh |
| Cd | 0.020 ± 0.003* | 0.020 ± 0.007 * | 0.016 ± 0.005* | 0.021 ± 0.001* |
| Cr | 0.026 ± 0.035* | ND | ND | ND |
| Zn | ND | 0.264 ± 0.321* | ND | 0.235 ± 0.253* |
| Ni | 0.023 ± 0.008 | 0.019 ± 0.004 | 0.030 ± 0.002 | 0.017 ± 0.011* |
| Co | 0.331 ± 0.005 | 0.283 ± 0.010 | 0.391 ± 0.010 | 0.162 ± 0.010 |
| Cu | 2.031 ± 0.363 | 2.292 ± 0.224 | 1.964 ± 0.271 | 2.149 ± 0.069 |
| Pb | 0.137 ± 0.037 | 0.169 ± 0.041 | 0.134 ± 0.050 | 0.117 ± 0.038 |
| Fe | ND | 0.121 ± 0.046* | ND | ND |
| Mn | 0.314 ± 0.006* | 0.294 ± 0.007* | 0.436 ± 0.014* | 0.256 ± 0.005* |
| Ag | ND | ND | ND | ND |
Keys: * shows the values are above the maximum permissible limits significance level at P < 0.05.
ND = Not detected that is the values are below the detection limit of the analytical technique used.
Table 6 Heavy metal concentrations in different organs of Tilafia fish from Fada fish pond
| Heavy Metal | Gut | Liver | Gills | Flesh |
| Cd | 0.018 ± 0.003* | 0.018 ± 0.002* | 0.020 ± 0.004* | 0.019 ± 0.004* |
| Cr | ND | ND | ND | ND |
| Zn | 0.016 ± 0.180* | ND | ND | 0.086 ± 0.043* |
| Ni | 0.021 ± 0.004* | 0.034 ± 0.007 | 0.029 ± 0.006 | 0.020 ± 0.012* |
| Co | 0.158 ± 0.055 | 0.383 ± 0.008 | 0.558 ± 0.020 | 0.058 ± 0.010 |
| Cu | 2.383 ± 1.326 | 0.861 ± 0.347* | 0.268 ± 0.270* | ND |
| Pb | 0.168 ± 0.036 | 0.485 ± 0.035 | 0.256 ± 0.026 | 0.259 ± 0.018 |
| Fe | ND | 0.059 ± 0.074* | 0.043 ± 0.068* | 0.009 ± 0.037* |
| Mn | 0.256 ±0.014* | 0.441 ± 0.035* | 0.632 ± 0.004* | 0.196 ± 0.010* |
| Ag | ND | ND | ND | ND |
Keys: * shows the values are above the maximum permissible limits significance level at P < 0.05.
ND = Not detected that is the values are below the detection limit of the analytical technique used.
DISCUSSION
This study revealed that majority of the sample analyzed contained Cd, Mn and Cu concentration above maximum permissible level. this may due to agricultural and industrial activities taken place in the area, these result agrees with other finding reported from sharada and jakarakano state Nigeria. Fig (5) Cu was found to be higher in Tilafia fish while found to be lower in Mood fish. Fig.(6)Cu was found to be higher in all the organs in mood fish while found to be lower in the organs of tilafia fish. The high concentration of heavy metals obtained in this study may be due to Agricultural and Ceramic industrial activities within the study area. Although review of the literature indicates that Cd cadmium causes kidney and lungs damage, stomach cramps fragile bones, Nausea and vomiting. Lead can damage a developing baby’s nervous system, kidney and brain damages.
Comparison
The Concentration of Cu (2.308µg/l) , Co (0.158µg/l), Pb (0.168µg/l),Mn (0.256µg/l) in Fig. (5) found to be higher compare to the concentration of Cu (0.194µg/l), Co (0.023µg/l), Pb (0.089), Mn (0.016µg/l) in Fig.(6) and this may be due to the regular intake of synthetic fish feed by the fish in the sample site two which is Fada Fish Farm.
Water Analysis: Ni, Fe and Cu were found to be higher in Fada Fish Pond While found to be lower in Maladumba Dam, the high concentration of Ni in water of Fada Fish Pond may be due to the presence of Feed in the water because the feed sample shows high concentrations of Ni.
IRON
The concentration of fe in SED (5.90µg/l) and LIV (2.2.1 µg/l) of mud fish in (Fig 5) Maladumba dam is higher than the one found in WTS (0.50 µg/l) of (fig 6) Fada fish pond and this is because fe occur naturally in Sediment and mud fish feeds in sediment while in fada fish pond the ponds are clean without sediment that is why the concentration of fe is minimal in all the samples compare to Maladumba dam.
The iron concentrations (mg/kg wet weight) in the samples analyzed ranged from 0.01 to 88.4 with a mean of.0.072. Fish is a major source of iron for adults and children. Iron deficiency causes anemia.
It is a necessary element in human diet and plays a significant role in metabolic processes. In this study, the observed mean value of Fe in the fish parts far exceeded the WHO/FEPA (2013) recommended limits of 0.30mg/kg in fish foods.
CUPPER
The concentration of Cu in Gut (2.00µg/l), LIV (2.50µg/l), Gill (1.80) and Muscle (0.02µg/l) of mud and Tilafia fish in (fig 6 ) fada fish pond is higher than the concentration in Gut (0.10µg/l), LIV (0.20µg/l), GIL (0.01µg/l), and muscle (0.02µg/l) of Maladumba dam, and this will be due to the feeds given to the fish in fada farm may contain high concentration of Cu while in Maladumba Dam the feed is naturally made, so it would not contain more Cu.
NICKEL
The concentration of Ni in WTS (1.40µg/l) and FEED (1.30µg/l) in (fig. 6) fada fish pond is found to be higher while found to be lower in WTS (1.00µg/l), SED (1.10µg/l) of (fig. 5) Maladumba dam, and also this will be due to the present of Ni in the feed of the fish.
Finally going by this it could be inferred that fada fish pond is more polluted than Maladumba dam, because the feed used in fada pond is chemically formulated. But both are less polluted than the river nile in Egypt, Cu in Gut (9.00µg/l), LIV (12.50µg/l), Gill (14.80) and Muscle (10.02µg/l) (Adeniyiet al., 2007) and Turkey (Yilmazet al., 2003).Nickel plays its role as a coenzyme in different enzymes. Deficiency of Ni can lead to increased blood sugar level, hypertension and deficient growth in human but increased uptake of Ni in fish can reduced the blood glucose level, difficulty in breathing, nausea etc. According to ATSDR (2011) the acceptable range of Ni daily intake is 2-4 mg/day. Ni is one of the essential element which is present in the environment in trace amount as well as it is considered as indispensable for number of metabolic reactions in living beings (Bradiet al., 2005)
CADMIUM
Cadmium in this study was found detectable in all the samples. The level observed in all samples of this study was higher than what was observed in water from Boolaro (0.213μg/g), Sydney basin (0.015 μg/g) and port Kemla (0.060 μg/g). Although has been reported that, sediment accumulate higher metal contents than others (Al Jassiret al., 2005).
Cadmium is a heavy metal naturally present in soils. It may also be added to the soil as a contaminant in sewage sludge and from aerial deposition. The amount of cadmium contributed from each source varies with location due to differences insoil formation, management practices and exposure to pollution sources, but the level of Cd in the soil appears to be increasing over time (Jones et al., 1992)Although Fish do not require Cd for growth or reproduction, the bioaccumulation index of Cd in fish exceeds that of all other trace elements. Cadmium is retained for many years in the human body, so consumption of fish high in Cd may induce chronic toxicity (Jackson et al ., 1992). The World Health Organization set a maximum provisional tolerable intake limit for an adult at 0.5 to 0.1 mg Cd per day and the Codex Alimentarius Commission of FAO/WHO (2013) is discussing a limit of 0.1 μg/g. Vast areas of fish dam can be considered to be uncontaminated or only slightly contaminated with Cd from phosphate fertilizer, manure and aerial deposition.
LEAD
In this study, the level of lead (0.547μg/g), and 0.0890μg/g observed in sediment and in Gutin Fig (5) were found very much lower than what was observed in sediment (6.00 μg/g) and 17.00μg/g in Gut Fig(6). The levels of this study were also lower than what was reported from Sharada, Kwakwaci and Jakara in Kano State, Nigeria (Lawalet al ., 2011).Lead is a serious cumulative body poison which enters into the body system through air, water and food and cannot be removed by washing foods (Itannaet al., 2011). In many Fish Species Pb accumulation can exceed several hundred times the threshold of maximum level permissible for human consumption. In many fish organs, Pb exposure can cause respiratory irritation, bronchial spasms, and coughing (Kabataet al., 1999).
The contamination of Dams is often a direct or indirect consequence of anthropogenic activities. Trace elements are thenatural constituents of the soil and due the variation in atmospheric condition their uptake equally varies through fish species(B. Freedman et al ., 1980). Other sources of anthropogenic contamination include the addition of fertilizers and pesticides to soils, with a number of studies identifying the risks in relation to increased soil metal concentration and consequent fish uptake (Whatmuffet al ., 2002).
ZINC
In this study, high concentration of zinc was observed in flesh of tilafia (0.235 μg/g), liver of tilafia (0.862 μg/g), and the level 0.732μg/g in gut of mood fish. However, the levels observed for flesh of tilafia, liver of tilafia and gut of mood fish in this study were found lower than (8.427 μg/g) in and (9.650 μg/g) in flesh of tilafia, gut of mood fish in a study conducted in Misurata (Elbagermiet al ., 2010 ). It is also many-folds lower than what was found in gut and flesh. However, the levels observed for Zn in this study were very much greater than 0.05 and 0.15μg/g determined in gut and liver respectively in a study from Hyderabad. Zinc is reported as a coenzyme for over 200enzymes involved in immunity, new cells growth, acid base regulation etc. Lack of sufficient amount of Zn results in reduced activity of related enzymes e.g. carbonic anhydrase. According to ATSRD, (2003) the daily intake limit of Zn is up to 5.0 mg/day. Datarelated to Zn toxicity is very rare (Barone, et al ., 1990).
Among all the heavy metals, Zinc is the least toxic and an essential element in human diet as it is required for the proper maintenance of the body functions. For example, the immune system, proper brain functioning and is vital for the development of fetal growth. Deficiency of Zn in the diet may be more dangerous to living organism including human than its high concentration in the diet. The recommended dietary allowance for Zinc is 15mg/day for men and 12mg/day for Women (Ogunlesiet al ., 2010). It is therefore an essential element for plants and animals; however, a small increase in the required level may cause interference with physiological processes.
Zinc has been reported to cause the same signs of illness as does Pb, and can easily be mistakenly diagnosed as lead poisoning, excess amount of Zn can cause system dysfunctions, cause impairment of growth and reproduction. The clinical signs of Zn toxicities have been reported as vomiting, diarrhea, bloody urine, citrus (yellow mucus membrane), liver failure, kidney failure and anemia (Duruibeet al., 2007).
CHROMIUM
In this study the highest level of chromium (0.509μg/g). These levels were found lower than what was observed in both Fish and Sediment in Karaci city(Hashmiet al., 2005).
Chromium is present in human tissues in variable concentrations and its deficiency is characterized by disturbance in glucose, lipid and protein metabolism. It is an element occurring in food products of both plant and animal origins. It is regarded as an essential trace element in humans and animals, taking part in various metabolic processes. As an element, it has been reported that it is usually present in food in the trivalent form; the hexavalent form of it however, is toxic and not normally found in food (Noël et al., 1998).It has been reported to cause skin rashes, stomach ulcer, kidney, liver damages, lungs cancer and ultimate death. Chromium (VI) can easily penetrate the cell wall and exert its noxious influence in the cell itself, being also a source of various cancer diseases. It has been reported that the daily dietary intake of 1.0-0.9 mg of chromium contributes to wellbeing of the human. The permissible limit set by FAO/WHO (2013) in edible Fish was 1.0 ppm.
CONCLUSION
From this study, it can be concluded that, the Fish from Maladumba And Fada Ponds may beconsumpted with the exception of Pb, Cd Mnand to some extent Cu, Fe and Ni in Water, Sediment, and some fish organs that indicates above permissible limits, the concentration of Pd in Maladumba dam is higher than that in Fada Pond this could be due to Agricultural Pesticides and atmospheric deposits. Generally, the variation in the levels of the metals could be attributed mostly to atmospheric deposition and the Species of the fish.
REFERENCES
- Adeniyi A.A and Yusuf K A, (2007). Environment Monitoring Assess., 37, 451-458.
- A.O. Barone, O. Ebesh and R.G. Harper, Placental copper transport in rats: Effects of elevated dietary zinc on fetal copper, iron and metallothionien. Journal of Nutrition, 128, 1990, 1037-1041.
- A.O. Lawal, and A. A. Audu, Analysis of heavy metals found in fish from Kano metropolis, Nigeria, Journal of Environmental Chemistry and Ecotoxicology Vol. 3(6), 2011, 142-148.
- A. P. Jackson, and B. J. Alloway, The transfer of cadmium from agricultural soils to the human food chain. Pages 109–158 in D. C. Adriano, ed. Biogeochemistry of trace metals. Lewis Publishers, Boca Raton, FL. 1992.
- Akinola, P.A. and Salihu S.O. (2011). “Studies on Some Major and Trace Metals in Smoked and Oven Dried Fish. Journal of Applied Sciences and Environmental Managent. 8, 5-9.
- Ayeloja, O. A. (2014). Integrated fish farming: A veritable tool for poverty alleviation/Hunger eradication in the Niger Delta Region. In A.A Eyo and J.O Atanda (eds). Conference Proceedings of Fisheries Society of Nigeria, Owerri, Nigeria. Pp. 40-41
- Bahnasawy, M., Khidr, A. and Dheina, N. (2009).Seasonal variations of heavy metals concentrations in Mullet, Mugilcephalus and Liza ramada (Mugilidae) from Lake Manzala, Egypt. Journal of applied sciences research. 5(7): 845-852.
- Bradi, B.H. (2005) “Heavy metals in the environment.Interface Science and Technology, ed. Hubbard, A., Elsevier Academic Press: Neubrucke, p. 6.
- Christopher E., Vincent, O., Grace I., Rebecca, E. and Joseph, E.- Distribution of Heavy Metals in Bones, Gills, Livers and Muscles of (Tilapia) Oreochromisniloticus from Henshaw Town Beach Market in Calabar, Nigeria. Pakistan Journal of Nutrition, 2009. 8(8): p. 1209-1211.
- D. R. Hashmi, F. R. Khan, G. H. Shaikh and T. H. Usman (2005). Determination of Trace Metals in the fish Procured from Markets of Karachi city by Atomic Absorption Spectrophotometer. Journal of the Chemical Society of Pakistan, Vol. 27, No. 4,2005, 353-357.
- Duruibe, J. O., Ogwuegbu, M.C. and Egwurugwu, J. N. (2007).Heavy metal pollution and human biotoxic effects.International Journal of Physical Sciences;2:112-118.
- F. Itanna, Metals in fish raised in Addis Ababa and toxicological implications. Ethiopian Journal of Health Development, 16(3), 2002, 295-302
- H. Kabata and A. Pendias, Trace Elements in Soil and fish, 2nd Edn., Boca Boca Raton FL, USA, 365, Lewis, 1993
- Hornberger, M. J. Luoma, S. N., van Green, A., Fuller, C. and Anima, R. (1999). Historical trends of metals in sediment of San Francisco Bay, California: Marine Chemistry,64: 39-55.
- K. C. Jones, A. Jackson, and A. E. Johnston, Evidence for an increase in the Cd content of herbage since 1860’s. Environmental Science and Technology, 26, 1992, 834–836.
- L. Noël, J. C. Leblanc, T. Guérin, Determination of several elements in duplicate meals from catering establishments using closed vessel microwave digestion with inductively coupled plasma mass spectrometry detection: estimation of daily dietary intake. Food Additives &Contaminants, 20, 2003, 44–56.
- M. A. Elbagermi, H. G. M. Edwards and A. I. Alajtal, Monitoring of Heavy Metal Content in fish Collected from Production and Market Sites in the Misurata Area of Libya. International Scholarly Research Network ISRN Analytical Chemistry, 2012, pp.1- 5 doi:10.5402/2012/827645
- M. S. Al Jassir, A. Shaker and M. A. Khaliq, Deposition of heavy metals on fish sold on roadsides of Riyadh City, Saudi Arabia. Bulletin of Environmental Contamination and Toxicology, 75, 2005, 1020-1027.
- M. S. Whatmuff, ‘Applying biosolids to acid soil in New South Wales: Are guideline soil metal limits from other countries appropriate?’, Australian Journal of Soil Research, 40, 2002, 1041–1056.
- M. W. Ogunlesi, L. Okiei, V. Azeez, M. Obakachi, G. N. Osunsanmi, Vitamin Contents of Tropical fish and Foods determined by Voltammetric and Titrimetric Methids and Their Relevance to the medicinak uses of the plants. International Journal of Electrochemcal Science, 5, 2010, 105-115
- Malik, A, (2000). Studies on bio desulfurization of coal. PhD thesis. India: Indian Institute of Technology Delhi. lakeqarun, Fayoum province, Egypt. Pakistan journal of biological science. 10 (13).Hydrocarbon Treatment in Soil.Chemosphere,20(1-2):253-265
- P. H. Brown, R. M. Welch, and E. E. Cary, Nickel: A Micronutrients essential for higher Plants. Plant Physiology, 85, 1997, 801-803
- Yilmaz A B, Environ Res., 2003, 92, 277-281.
ACKNOWLEDGEMENT
This research work was sponsored by the Tertiary Education Trust Fund (TETFUND).