
Evaluating the Effect of Fundamental Analysis on Earnings Per Share Concept in Stock Valuation in the Zimbabwe Stock Exchange Market.
- Brian Basvi
- 531-550
- Jun 8, 2024
- Finance
Evaluating the Effect of Fundamental Analysis on Earnings Per Share Concept in Stock Valuation in the Zimbabwe Stock Exchange Market.
Brian Basvi
University of Zimbabwe
DOI: https://doi.org/10.51244/IJRSI.2024.1105036
Received: 15 May 2024; Accepted: 22 May 2024; Published: 08 June 2024
ABSTRACT
A technique for analysing a security’s intrinsic value is called fundamental analysis. It involves looking at relevant financial, economic, and other qualitative and quantitative aspects. Earnings Per Share (EPS), a crucial metric in fundamental analysis is calculated by dividing a company’s net income by the total number of outstanding shares. With more than 70 listed businesses the Zimbabwe Stock Exchange (ZSE) is the primary stock exchange in Zimbabwe. This study applies the EPS financial ratio and stock valuation techniques to historical stock data from 68 companies listed on the Zimbabwe Stock Exchange. According to a ZSE study EPS significantly affects share prices that are listed on the market. The study’s objective was to assess how fundamental analysis affected the idea of EPS in ZSE stock valuation. It concluded that EPS is an important consideration for investors when they make judgments about their investments. According to the study’s findings, fundamental analysis is a useful tool for ZSE investors since it offers insightful information about a company’s financial performance and aids in decision-making. Investors can have a better understanding of a company’s underlying worth and prospects for future growth by looking into EPS and other basic aspects.
Keywords: Fundamental Analysis, Stock Valuation, EPS
INTRODUCTION
The foreign economy’s rapid growth has a significant impact on the policies that the Zimbabwean government implements. The government’s policies caused Zimbabwe’s economy to be less stable and more erratic. This created concerns for the general public as well as government-owned and private businesses. This phenomenon brings attention to the fact that Zimbabweans can earn additional income from other sources, like as salaries or earnings from other businesses, in addition to their fixed income. There are many different kinds of enterprises that are essentially run as investment activities or to generate additional revenue. When considering a firm’s future prospects from the perspective of an investor one of the key indicators is the degree of growth the company has had, which may be determined by looking at linked.
LITERATURE REVIEW
This section seeks to explain fundamental analysis and earnings per share principles and concepts (EPS). The stages of fundamental analysis and the variables that influence them will be examined. The idea of EPS and how it influences stock price will also be covered in this section. From the perspective of the investor determining the degree of the company’s growth through an examination of associated economic and financial factors also known as through a process known as fundamental analysis is one of the key indications for evaluating the prospects of the business going forward. Ratio analysis is one tool available to investors; profitability ratios are the best ones to utilize. Taking note of this indication is crucial in determining the degree to which investments made by investors in a firm can yield a return that aligns with their desired rate of return. Earnings per share, or EPS, is the profitability statistic that investors look at the most frequently prior to making an investment. This figure from EPS is frequently released about the performance of businesses that go public, or sell their shares to the public. This is because investors and prospective investors believe that EPS is a valuable tool for predicting future stock price levels and for evaluating how well a company is managing its finances.
Standard financial theories on portfolio management state that investors base their judgments about investments on concerns about risk and return (Mutswenje, 2021). While Reynders et al. (1984) defined “risk” as any discrepancy between expected and actual results that results in a loss, the Merriam Webster Online Dictionary (2018) defined “risk” as “the possibility that an investment would lose value.” Correia et al. (2021) define a risk as any possibility of losing money as a result of taking a particular action. To sum up, “risk” is any possible loss that can happen if the anticipated outcomes are not realized. Risk and return are directly correlated; an investor would want a higher return to offset the absorption of high risk and potential loss (Moles et al., 2020). To protect their assets from losses, rational investors would steer clear of exceptionally high risk (Mutswenje, 2021).
Fundamental analysis is one of the easiest ways to assess the financial facts. The identification of the company’s actual current worth is the main objective of fundamental analysis. To ascertain the underlying value of the stocks, one of the main objectives of fundamental analysis is to forecast future profits, dividends, and risk. Measuring the entity’s EPS trends is an important baseline for assessing such expansion (May, 2021). In agreement Graham (2022) propose that performance metrics like earnings influence an entity’s growth rate.
Moreover, supply and demand frequently affect share prices (Parker, 2021). The share price will drop if there are more shares available than buyers are willing to buy (Parker & Media, 2020). The share price will rise if the demand from investors outweighs the supply of shares (Parker, 2021). Thus, it is clear that decisions about investments have an impact on share demand, and that share prices rise in response to increases in demand. Because the relationship between accounting earnings and share prices has been well examined, Balsam (2021) contended that earnings explain the share price behaviour of stocks. Chang et al. (2018) support this by stating that EPS has a long-term impact on share prices. The category of EPS that best reflects share price behaviour has not, however, been the subject of many local studies.
Conceptual Framework
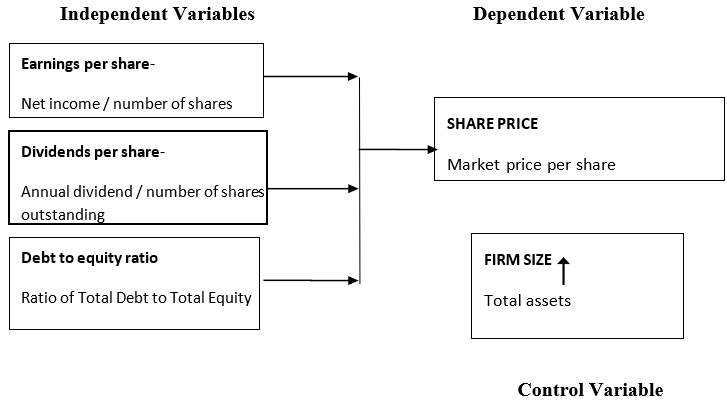
Source: Researchers own
Stock valuation methods
Below, is a discussion of other prominent methods of stock valuation
Dividend discount model (DDM)
A quantitative technique for estimating a company’s stock price, the dividend discount model (DDM) is predicated on the idea that the current price of the stock is equal to the total of all future dividend payments, discounted back to their present value. The current market price and intrinsic value of a share can be compared to ascertain whether it is undervalued. The price of a share of stock is the present value of all anticipated future dividends per share, discounted at the market capitalization rate, in order for an investor to be willing to purchase the stock.
Vj= D1 + D1 + D1 +…………….. Dn……………… (2)
(1+k1)1 (1+k2)2 (1+k3)3 (1+kn)
Vj= value of common stock j , t = dividend during period t , k= required rate of return of stock j (market capitalization rate) , t= the holding period, As t approaches infinity:
Vj = Σ Dn ……………….. …………….. (3)
t=1 (1 + k n) n
The concept was first proposed by Williams (1938), which was further developed by Gordon (1963), as cited in Brealey (2020). The capital markets must be in good working order for the previously indicated approach to be applicable which implies that all assets in a comparable risk class must be priced to produce the same expected returns. The dividend discount model focuses on estimating the true worth of one share of a certain company’s common stock even when larger purchases are considered since it is anticipated that subsequent purchases would be made at a cost that is a simple multiple of the cost of one share. An investor needs to forecast each and every future dividend in order to apply equation (3) above. There are some presumptions that affect dividend growth rates. According to Sharpe et al. (2020), this means that the dividend per share at any given time t is equal to the dividend per share at time t-1 multiplied by the growth rate of gt.
The dividends discount model thus offers a solid basis for share valuation. According to some studies, the dividend discount model makes sense since first and foremost there wouldn’t be a trustworthy method for analysing the price earnings ratio which is effectively the required rate of return in any case. Secondly, investors receive dividends as a consistent source of income. Complicated dividend discount models are helpful for stock selection since they have been shown to increase forecast accuracy (Fuller, 2020). Fourth, the foundation of the dividend discount model is a straightforward, well-known idea. The discounted value of the cash flows that a security is expected to produce should be equal to the security’s fair value. Fifth, many large investment management firms use the model’s fundamental inputs as common outputs for its security analysts, who anticipate corporate profitability (Sharpe et al 2021). In conclusion, it is asserted that the dividend discount model offers a rational and cohesive structure for integrating analysts’ evaluations of share value (Davis, 2021). A common and essential step in a quantitative investment management program is to qualify security value using the dividend discount model.
Discounted cash flow model (DCF)
The discounted cash flow model is another widely used method for absolute stock valuation. Using the DCF method, a stock’s intrinsic value is calculated by discounting the company’s free cash flows to their present value. The DCF model’s primary benefit is that it doesn’t make any assumptions regarding dividend distribution. Therefore, it is suitable for businesses whose dividend distribution is ambiguous or uncertain. Conversely the DCF model is more sophisticated technologically.
Three main factors determine a company’s worth, according to the DCF technique: necessary rate of return, expected growth of these cash flows, and predicted net cash flows. The result of the business’s capacity to produce revenue is its net cash flows (or earning power) (Nenkov, 2021). Future earnings growth is reliant on this earning potential increasing. The degree of risk and financial leverage of the business dictate the required rate of return, also known as the cost of capital. Ultimately, the earning potential, expected profits growth, and degree of risk associated with the organization can all be used to determine its worth (Damodaran, 2018). In their study, Penman and Sougiannis (2021) evaluate accrual earnings methodologies, discounted cash flow analysis, and dividend discount techniques when applied to finite-horizon projections. They demonstrate how valuation issues are lessened when accrual earnings procedures are used in place of cash flow and dividend discounting techniques. They demonstrate how valuation issues are lessened when accrual earnings procedures are used in place of cash flow and dividend discounting techniques. The long-term “anticipated profits” (also known as “average earnings” or “earning power”) have a stronger influence on market price than do short-term fluctuations in present earnings that fall within acceptable bounds.
The concept of earnings per share (EPS)
International Accounting Standard (IAS) 33: Earnings per share requires an organization that trades equity instruments on public markets to include EPS in its financial statements (BDO, 2021). Although they are not required non-public organizations are free to report their EPS (BDO, 2021). A company’s income is allocated to each of its common shares using the profits per share (EPS) formula (Vaidya, 2021). By contrasting the entity’s performance with the share capital required to generate such returns, it shows profitability (Koppeschaar et al., 2022). Earnings per share (EPS) has evolved into a helpful tool for investors in making investment decisions because it indicates future prospects and growth (Mlonzi et al., 2021). For the purpose of assessment, IAS 33 distinguishes between three types of EPS: headline EPS, diluted EPS, and basic EPS (BDO, 2021). An explanation of each of these EPS types is given in the following section.
Basic EPS
The most fundamental kind of EPS is called basic EPS (Vaidya, 2021). Basic EPS calculations require the holding entity’s profit or loss to be adjusted for preference dividend amounts paid after taxes (IFRS, 2021). To compute basic EPS, one divides the weighted average number of ordinary shares by the actual earnings after preference shares (Dunn, 2010).
The overall basic EPS and the basic EPS resulting from current operations are the two basic EPS amounts that need to be further subdivided from the basic EPS, in accordance with IAS 33.9 (Kennon, 2014). Basic earnings per share (EPS) must be shown on the Statement of Profit or Loss and Other Comprehensive Income (BDO, 2018). Basic EPS, which is calculated by dividing earnings after preference shares by the weighted average number of shares, is said to be the most fundamental type of EPS. All capital structures are subject to basic earnings per share (EPS), which is shown on the Statement of Profit or Loss and Other Comprehensive Income.
Diluted EPS
Compared to basic EPS, diluted EPS is more complex (Kennon, 2018). According to Koppeschaar et al. (2018), diluted earnings per share (EPS) is what a company would produce if all of its options, warrants, and convertibles were exercised, increasing the total number of ordinary shares that may be issued. Total basic profits are divided by the increased number of ordinary shares after being adjusted for any after-tax savings that might arise from exchanging convertible instruments for ordinary shares, in order to calculate diluted EPS (BDO, 2018). Lower and subsequently diluted earnings per share are frequently the outcome of increases in the number of common shares (Kennon, 2018).
Additionally, diluted EPS needs to be split into two categories: total diluted EPS and diluted EPS from ongoing operations (Kennon, 2018). Moreover, the Statement of Profit or Loss and Other Comprehensive Income must display the diluted EPS of the firm (BDO, 2018).
Diluted earnings per share (EPS) may be computed in the event that a corporation issues convertible preference shares, convertible debentures, options, warrants, or contingently issuable shares, per the submission. These instruments increase the weighted average number of shares and may result in a higher number of ordinary shares. After preferences, earnings are divided by the greater number of shares and adjusted for after-tax savings. The EPS figure is diluted as a result.
Headline EPS
Publication headline EPS is a listing requirement for firms listed on the ZSE (SAICA, 2023). According to Steenkamp (2019), headline EPS is computed by deducting independently identifiable premeasurements from the entity’s earnings.
According to Steenkamp (2019), the headline earnings can be computed by subtracting or adding to the basic earnings any components that are not included in the headline EPS. To calculate headline EPS, headline earnings are divided by the weighted average number of shares (Bragg, Diluted headline EPS is also calculated by dividing headline earnings by the weighted number of ordinary shares, adjusted for any potential ordinary shares that might be issued, and adjusted for any after-tax savings that would arise when convertible instruments are exchanged for ordinary shares (Bragg, 2019). headline Investors frequently utilize EPS for comparative analysis since it offers a single earnings figure that sums up the company’s performance (SAICA, 2019).
Two of the most widely used and well-liked financial measures are earnings per share and dividends per share. These figures have long attracted the attention of academics, shareholders, and investors of all stripes. According to the majority of the 400 financial executives surveyed by Graham, Harvey, and Rajgopal, one of the most significant performance criteria they reported to different stakeholders was earnings.

Figure 2.1: The interrelation among the categories of EPS
Source: European Journal of Business and Management
Effects of eps on stock valuation
The amount that a share of stock gains or losses over a given period of time is expressed as earnings per share. Typically, EPS is calculated annually and on a quarterly basis. By using EPS, an investor can rapidly determine a stock’s return on investment. Generally speaking, stocks are regarded as low valued when the EPS is low and highly valued when the EPS is high. Because investors would pay more for a company’s shares if they believe it has larger earnings relative to its share price, a higher EPS is indicative of greater value.
Investors use earnings per share (EPS) calculations when making stock investments. A corporation has an earnings surprise if it exceeds this estimate; if it falls short, the stock typically rises. A company’s stock typically rises when the profits surprise exceeds the estimate; conversely, when it falls short of the estimate, investors are disappointed and the stock price declines because there will be minimal return on their investment. The discussion above is summarized in the following figure:
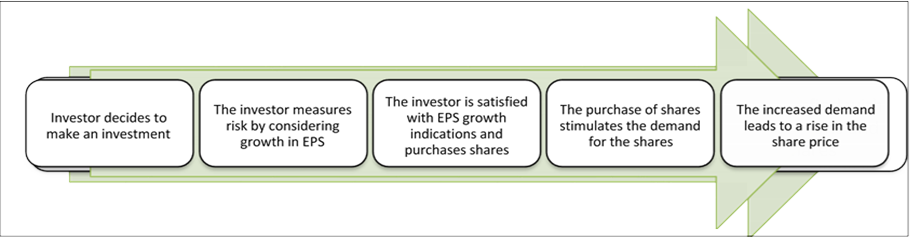
Figure 2.2: The effect of EPS on stock valuation
Source: European Journal of Business and Management
The fig shows how an investor decides which entity’s shares to buy after first agreeing to make an investment and evaluating the increase in EPS of multiple firms to gauge risk. The next step is to buy shares. The demand for a certain kind of share rises when multiple investors purchase shares in the same company, which drives up the share price.
Criticism of eps in stock valuation
The approach is applicable because numerous studies have found a favourable correlation between stock value and earnings per share. Chang et al. (2018) claim that there is a linear relationship between share prices and EPS. On the other hand, EPS performance may lead to management intentionally underinvesting in R&D in order to meet quarterly earnings targets. This short-term focus could lead management to overlook longer-term strategic factors that impact value, like potential for industry development, future sales and cash flow sustainability and growth, the company’s competitive position, competitor behaviour and technological advancements. Businesses may incorrectly manipulate EPS by reverse splitting stocks or purchasing back their own shares, which will reduce the number of outstanding shares.
Companies can manipulate the EPS by reverse dividing their stocks or reducing the number of existing shares by purchasing back their own shares, which will incorrectly affect the stock price. This is corroborated by Brown (1999), who claims that there is an unparalleled systematic reporting issue and that there is an increase in the manipulation of profits to the extent of including fictitious earnings.
The additional drawback of utilizing EPS as a company valuation statistic is that it only takes into account the quantitative aspect of stock pricing. Stock value cannot be determined by investors only based on EPS. Stock value is determined by supply and demand. Qualitative aspects like the company’s reputation might affect a stock’s demand. Negative press has caused the company’s stock prices to decline despite high EPS. Government regulations may affect stock valuation regardless of EPS.
The concept of fundamental analysis
When assessing a company’s worth, investors frequently turn to fundamental research as a resource. To determine the underlying value of the equities, fundamental analysis aimed to predict future profits, dividends, and risk. Based on historical and current data, fundamental analysis projects and evaluates the value of the stock market in the future. To determine the genuine value of the company, one typically starts by examining the macroeconomic climate, then moves on to examine sectors, and lastly, financial accounts (Baresa, 2019). The primary objective of the study is to identify performing firm shares. Additionally, it indicates which stocks on the stock exchange are overpriced or under-priced. While it plays a significant part in reaching this goal, fundamental research is by no means a guarantee that an investor will make large returns on equities.
Stages of fundamental analysis
The five steps of fundamental analysis are as follows: macroeconomic analysis, sector analysis, conditional analysis, financial analysis, and intrinsic value approach, according to (Wisniewski, 2019).
Macroeconomic analysis
In order to estimate the rate of economic development and assess whether a country is a desirable place to invest, macroeconomic analysis of the environment involves analysing phenomena that occur in the economy as well as its status and variations (Dbski 2018). Standard macroeconomic variables like GDP growth rate inflation rate unemployment rate and interest rates will be examined in this stage. It also takes into account immeasurable elements like infrastructure social and cultural norms employment constraints tax laws political stability and scientific potential. A nation’s capital market is more enticing for investment the more favourably its economic status is assessed. This has to do with the companies’ increased capacity to turn a profit and keep their end of the bargain (Panfil, 2019).
Sector analysis
A sector or branch study examines a group of similar industries in terms of the qualitative characteristics that they have in common. This analysis’s main objective is to assess the extent to which the environment and pertinent changes affect the financial results and growth prospects of a certain corporate initiative, hence modifying its stock. Dbski (2021) lists a few of these factors as statistical information and indices that specifically relate to sales, profit, dividends paid, salaries, capital structure, and investment profitability, as well as innovations, technology, raw material accessibility, and law. Borowski (2021) adds variables like price elasticity of demand, historical and projected returns on investments, scale, sensitivity to the state of the economy, position on the industry life cycle map, degree of risk associated with investments, response to changes in product quality and prices, degree of market saturation, and lastly.
Situational analysis
Scenario analysis, according to Borowski (2020), involves comparing a commercial endeavour to the business sector as a whole. The company’s profitability, competitive position market share and prospects for future growth or decline are all examined in order to achieve this (Panfil, 2021). The number of suppliers and customers, the quality of management and staff, the capacity for innovation and applied technology the difficulty of obtaining new distribution channels strategy and development barriers to entry product specifications and the possibility of competitors introducing substitutes are some of the non-financial factors influencing it (Borowski, 2020). In conditional analysis SWOT analysis is frequently employed to evaluate a venture’s strengths and weaknesses as well as opportunities and threats arising from its operating environment, classifying them as internal and external elements. Assessing the significance of these elements, even in rough form, could aid in objectifying processes for evaluating intrinsic worth.
Financial analysis
The quantitative information pertaining to a company’s or organization’s stock is examined through financial analysis. This quantitative data is used to estimate future stock movements in connection to their respective marketplaces and examine the performance of the company. Information is gathered through the use of financial statements from published companies’ annual reports, prospectuses, periodical reports, balance sheets, profit and loss accounts, cash flow statements, statements of changes in equity, management board meeting minutes and control protocols. Wisniewski (2019) explain that the research is split into two phases: the balance sheet analysis, or preliminary analysis, which looks at the structure by looking at financial statement items and the comprehensive analysis or final analysis. In comparison to their prior values it also takes into account the direction and dynamics of asset changes. Ratio analysis or the second step involves figuring out and analysing financial and economic ratios. Among these ratios are leveraging, profitability, and liquidity ratios. Ratio analysis can be done as a comparative analysis where ratios calculated for a given company are compared to ratios calculated in the same way for similar companies or averages for the sector over the same period of time, or as a trend analysis where the same ratios are observed over time to determine their patterns.
Intrinsic value approach
Cunningham (2001) defined intrinsic value as the total discounted to present value of all future cash flows produced by the share or index. Gray et al. (2018), the foundation of fundamental analysis is the theory that market price and intrinsic value will gradually converge as a result of the market’s gradual self-regulation toward equilibrium. “Intrinsic value is always an approximation and can never be computed correctly. “We are dealing with unpredictably unfolding future events” (Arnold, 2018). By calculating the intrinsic value you may assess if a company is fairly valued undervalued or overvalued by comparing it to the market price.
Criticism of the fundamental analysis
Investors have hailed fundamental analysis for its ability to “out smart” the market. It can help investors make judgments about whether to sell or stay onto stocks by predicting how the price of the stock will move in the future. In addition to quantitative criteria like reputation and competitiveness, fundamental analysis takes these into account to determine the stock’s fair value. Fundamental analysis can have several drawbacks though such as the potential for outdated data or window-dressed financial statements to be employed which could result in the calculation of false financial ratios.
Empirical literature review
Prior studies on earnings per share (EPS) under the heading “Performance Metrics and Their Link to Value” examined 1,800 companies across 24 industry groups and used data from 1998 to 2011. These studies found that financial metrics such as revenue growth and earnings per share growth positively affect companies’ overall stock return. In addition to showing that earnings growth was the most widely used financial statistic the study concluded that it had the biggest effect on the overall share performance of the selected sample of companies.
Once more, in a research by Bonghan Kim, and others titled “An empirical study of the relationship between stock price and earnings per share in panel data: Korea case,” Once more, Kim used data from companies listed on the Korean stock exchange to investigate the relationship between stock prices and earnings per share in their study titled “An empirical study of the relationship between stock price and earnings per share in panel data: Korea case.” A section of the article utilizing panel data analysis demonstrated a favourable correlation between share prices and earnings per share. The selected sample of Korean stock exchange companies showed that, on average, share prices moved in tandem with firm fundamentals like earnings per share over the long term. However, it was determined that these movements did not always occur at the same rate or at the same time.
Additionally, Shabina’s prior study, “Investigating the Relationship between Earnings and Stock Prices in Companies Accepted in the Stock Exchange: A Case Study in Iran (2010–2020),” sought to ascertain how share prices in the sample of companies it selected related to earnings per share as well as predicted earnings. Additionally, it looked into any potential connections between dividends per share and earnings per share. From 2010 to 2020, this was carried out for every publicly traded company on the Iranian stock exchange. The findings of a regression analysis and correlation analysis revealed a relationship between earnings per share and share prices of companies listed on the Iranian stock exchange. The results also suggested that there might be a relationship between these companies’ dividends per share and earnings per share. The relationship between share prices and earnings per share was favourable. Apart from the studies on the relationship between earnings per share and share prices and firm values (many of the previously mentioned studies in various samples have shown positive relationships), earnings per share is also commonly recognized as one of the most significant and commonly used financial metrics.
According to Graham, Harvey, and Rajgopal’s study “The Economic Implications of Corporate Financial Reporting,” earnings per share is regarded as the most significant performance metric that companies report to different stakeholders based on a sample of 400 financial executives in the United States. The managers thought that understating earnings in a financial report or reporting wildly fluctuating results over time had an impact on their compensation.
Chang and associates (2018) examined the connection between the EPS and share prices of electronic companies listed on the Taiwan Stock Exchange. The study’s objectives were to ascertain how much the EPS number affected share prices and whether the growth rate of a company may have an effect on this relationship (Chang et al., 2018). Information was analysed using a null hypothesis, and the findings showed that, over time, share prices did move in tandem with EPS, though not always at the same rate (Chang et al., 2021). Additionally, it was discovered that the impact of EPS on share prices and operating revenue growth rates were inversely related. EPS trends showed a stronger correlation with share prices when operational revenue growth rates were higher (Chang et al., 2018). The investigator came to the conclusion that share price fluctuations might be explained by both dividends and earnings.
Erasmus (2021) made an effort to ascertain whether a variety of factors could impact a company’s share price. EPS cash flow per share and dividends per share are a few of these variables (Erasmus, 2020). The purpose of the study was to ascertain which of the three variables best connected with share price behaviour by examining the relationship between share prices and the volatilities in EPS dividends per share and cash flow per share. The investigator conducted a multiple regression analysis in addition to a Spearman Rank Order correlation study. According to Erasmus (2021), the findings showed a substantial association between share prices and the volatility of earnings per share (EPS) and dividends per share, with EPS demonstrating the greatest correlation coefficients. Share prices and cash flow per share volatility did not significantly correlate. It was determined that an investor should take into account both earnings per share and dividends per share (Erasmus, 2021).
Researchers have formed varying viewpoints regarding the relationship between EPS and share prices, as may be inferred from past studies. However, one general result indicated that EPS can have a major impact on share price behaviour. Lastly, it should be highlighted that caution should be used when drawing comparisons between the findings of this study and potential findings from other research studies, as USA-based entities use the Statement of Financial Accounting Standard (SFAS) 128 rather than the IAS 33 that South African entities are required to use.
Factors that influence investment decisions
Investors weigh a variety of investment-related criteria before making a choice. Seven elements have been identified by Nagy and Obenberger (2021) as influencing individual investors’ investing decisions:
Neutral information
Press coverage, index results, and investment advisor recommendations are common representations of this element (Nagy, 2019). Information from outside sources that is deemed impartial is known as neutral information (Nagy, 2019). The investor’s response to these sources can be inferred using one of two models. According to the first model, when new information becomes available, such the issuing of fresh shares, investors may overreact (Mutswenje, 2018). According to Mutswenje (2022), the second model bolsters the claim that investors tend to underreact to information like share repurchases. These arguments make it clear that depending on the kind of event that is disclosed by an outside source, investors will either overreact or underreact to neutral information.
Self-image and firm-image coincidence
This element relates to the company’s standing, reputation, and public opinion of the goods and services it provides (Nagy, 2022). According to a research by Epstein (2022), information on a company’s social activities, product safety, ethics, employee relations, and community involvement piqued the interest of investors. Due to skewed self-attribution, this information may also exacerbate shareholders’ overconfidence (Jagongo, 2021). It goes without saying that investors are also curious about how an organization treats its staff, clients, and community.
Classic factor
The expected dividend, share affordability, tax implications, and risk minimization are all examined by the classic factor (Obenberger, 2020). This element is a criterion for wealth maximization (Obenberger, 2020). Investors’ desire for returns is influenced by their tax situation, according to Copeland (2020). Investors would likely choose a lesser dividend if they were subject to higher taxes as a result of dividends (Weston, 2019). It appears that investors are worried about the tax obligations brought on by investment returns in addition to assessing risk.
Social factors
Environmental reports, proximity to the investor’s home and global operations are a few examples of social considerations (Nagy, 2021). According to a survey by Nagy, investors considered these criteria to be least significant (2020). Nonetheless, Mutswenje (2022) discovered that environmental aspects were crucial for contemporary investors. Therefore, it is stated that social aspects are becoming more apparent to investors and that these factors have the potential to affect their judgments when making investments.
Advocate recommendations
This element stands for suggestions from friends, family, co-workers, and stock brokers (Nagy, 2020). After investigating the connections between investors’ goals, satisfaction, and word-of-mouth communication. Sevil (2022) came to the conclusion that these relationships were quite robust. According to Mutswenje (2021), investors have four options for responding to advice: holding shares on a sell recommendation, selling shares on a sell recommendation, holding shares on a hold recommendation, or selling shares on a hold recommendation. The investor’s mind-set may also be impacted by the kind of advisor they work with (Jagongo, 2021). When making investing decisions, it appears that investors lack independence and are swayed by the advice of those around them.
Personal financial needs
This element takes into account the necessity for diversity, the investment period, and future returns (Nagy, 2021). Even if a stock yields a positive present return, an investor with negative expectations for the stock’s future is likely to sell it (Mutswenje, 2021). Diversification is the most crucial component of personal financial demands (Nagy, 2020). According to Correia et al. (2022), investing in a mix of assets can help to lower risk. The “portfolio theory” is another name for this. These reasons suggest that in order to reduce the risk of losses, investors should invest in a variety of assets.
Accounting information
Annual reports, financial statements, and prospectuses are usually good places to find accounting information (Nagy, 2019). Expected company earnings were considered to be the most important factor by Nagy (2020) when evaluating investors. Investor interest in predicted accounting performance is evident. Users including staff members, managers, suppliers, bankers, and shareholders can obtain economic information from financial accounts (Brealey et al., 2018). Investors assess a company’s performance through the analysis of financial statements (Higgins, 2019). Ratio analysis is used to gauge profitability, asset utilization, debt utilisation, and liquidity, according to Block et al. (2019). Thus it is argued that accounting data and its analysis give financial statement users the ability to assess whether an entity is acting in their best interests.
MODEL, DATA AND METHODOLOGICAL FRAMEWORK
The plan for gathering and analysing sample data in order to meet the study’s goals is described in this section. Sample data Only secondary data from March 2020 to March 2024 were included in the study. The sample was made up of businesses that met the following criteria and were listed on the Zimbabwe Stock Exchange. The company’s complete 2020–2024 financial statements must be provided. The company has distributed dividends throughout this time. There must be all of the financial information needed for the computation. Therefore, only Few businesses met the aforementioned criteria and were able to be utilized.
Multiple regression analysis is the analytical technique used to test hypotheses. Specifically, regression is used to ascertain the degree to which the independent variables influence the dependent variable, while simple linear regression analysis is employed to satisfy researchers’ expectations with regard to the Analysis of Fundamental Factors on Stock Price (Regression analysis using SPSS version 22 software).
The regression equation is as follows: Y = α + β1X1 +β2X2 + β3X3 + β4X4 + Ɛ1
Dimana: Y = Stock Price α= constant or price Y if X = 0 β=number or direction of the regression coefficient, which shows the number of increases or decreases in the dependent variable based on the independent variable X1 = DEPS, X2 = MEPS, X3 = HEPS, X4 = BEPS, Ɛ= level of error In this study used a significance level (α) of 0.05 or 5%. To test whether the proposed hypothesis is accepted or rejected, then testing the research variables by testing simultaneously through the F test statistic is a simultaneous significance test that aims to explain how independent factors affect the dependent variable. In contrast, each variable is only partially tested by evaluating the significance of each individual parameter (statistical t test), which seeks to ascertain if the independent variable influences the dependent variable and which factors have the greatest influence on it.
| EPS | DPS | ||||||||
| COUNTER | 2024 March | 2023 | 2022 | 2020 | 2024 March | 2023 | 2022 | 2021 | 2020 |
| Afdis Distillers Limited | 316.4 | -4.55 | 4.53 | 2.39 | 22.6 | 52.15 | 1.5 | 0.65 | 0.45 |
| African Sun Limited | -174.6 | 97.36 | |||||||
| Axia Corporation Limited | 63.84 | 10.75 | 19.16 | 1.75 | |||||
| Cassava Smartech Zimbabwe Limited | |||||||||
| Cbz Holdings Limited | 977.53 | 270.86 | 86.54 | 287.37 | 22.99 | 1.3 | |||
| Dairibord Holdings Limited | -0.13 | 16.36 | 1.68 | 0.38 | 2 | 9.7 | 7 | ||
| Delta Corporation Limited | 525.5 | 95.55 | 105 | ||||||
| Econet Wireless Zimbabwe Limited | -3.9 | -444.1 | |||||||
| Edgars Stores Limited | -43.24 | 28.57 | |||||||
| Fbc Holdings Limited | 243.85 | -263.21 | 44.65 | ||||||
| Fidelity Life Assurance Limited | |||||||||
| Getbucks Microfinance Bank Limited | 3.23 | 1.97 | |||||||
| Hippo Valley Estates Limited | |||||||||
| Innscor Africa Limited | |||||||||
| Lafarge Cement Zimbabwe Limited | 6.106 | 0.103 | |||||||
| Meikles Limited | |||||||||
| NationalFoods HoldingsLimited | 2320.63 | 1324.62 | 8.96 | 10.99 | 12.1 | 10.68 | |||
| Ok Zimbabwe Limited | 47.88 | 36.65 | |||||||
| Riozim Limited | |||||||||
| Seed Co Limited | |||||||||
RESULTS
Interpretation of correlation coefficients
| Range | Interpretation |
| 0.1< r <0.29 | Correlation is weak |
| 0.3 < r <0.49 | Correlation is medium |
| 0.5 < r < 1 | Correlation is strong |
Source: Pallant (2019)
An R square can be computed by multiplying the Pearson coefficient by itself once the Pearson product moment correlation coefficient has been determined. According to Field (2009), the R square calculates the proportion of variation in one variable that is shared by the other. Correlation results were employed in a paired t-test after the study’s R square and Pearson coefficient were computed. The significance of the differences in correlation measurements was indicated by the t-test. If p is less than.05., significance is attained (Pallant, 2019:254). The impact of EPS categories on share prices was then ascertained by interpreting the results.
Statistical analysis for March 2023 to March 2024 data
All relevant statistical outcomes were summarised in Table 4.19. This table indicates r, n, p and R square for all selected variables
Table 4.19: Empirical findings for March 2023 to March 2024
| LogBasic EPS | LogDiluted EPS | LogHeadline EPS | ||||||||||
| R | n | p | R2 | r | n | p | R2 | r | n | p | R2 | |
| LogShare price on publication date | .52** | 40 | .002 | .267 | .52** | 40 | .002 | .267 | .45** | 40 | .005 | .201 |
| LogShare price 20 days before | .53** | 40 | .001 | .285 | .53** | 40 | .002 | .279 | .50** | 40 | .003 | .246 |
| LogShare price 20 days after | .53** | 40 | .001 | .283 | .53** | 40 | .002 | .281 | .46** | 40 | .004 | .210 |
**Correlation is significant at the .01 level (two tailed)
Source: Own research
Based on a two-tailed 99% probability of significance, Table 4.19 shows a substantial relationship between LogBasic EPS and share prices. Strong correlation coefficients were found, as indicated by Table 4.1. R =.52, n = 40, and p <.01 for LogBasic EPS and LogShare prices on publication date. A shared variance of 26.7% is implied by R square =.267. Few days prior to the publication date, for LogBasic EPS and LogShare prices, r =.53, n = 40, and p <.01. There was a documented common variance of 28.5%. Few days following publication, it was discovered that the LogBasic EPS and LogShare prices had r =.53, n = 40, and p <.01. A shared variance of 28.3% was computed in this case.
There was a substantial correlation between selected share prices and LogDiluted EPS, with a 1% inaccuracy in the obtained value. Once more, measurements showed high correlation coefficients. On the publication date, the prices of LogDiluted EPS and LogShare had a common variance of 26.7%, with r =.52, n = 40, and p <.01. Few days prior to publication date, for LogDiluted EPS and LogShare prices, r =.53, n = 40, and p <.01. A estimated R square of.279 indicated a common variance of 27.9%. LogDiluted EPS and LogShare prices were supplied with r =.53, n = 40, and p <.01. The pooled variance in this case was 28.
Furthermore, a statistically significant correlation was found between LogShare prices and LogHeadline EPS. For LogShare and LogHeadline EPS prices on the publishing date, p <.01, n = 40, and r =.45. A common variance of 21% was found. Few days following the date of publication, LogHeadline EPS and LogShare prices had a common variation of 24.6%, with r =.53, n = 40, and p <.01. The measures of the LogShare price were r =.46, n = 40, and p <.01. The results showed a 21.0% influence between the factors.
The aforementioned interpretations demonstrated that some share prices could be most closely linked to LogBasic EPS. It was able to provide a marginally higher correlation coefficient than LogDiluted EPS. LogBasic EPS and share prices may have the best correlation. The LogHeadline EPS showed the lowest correlations. Once more, the results are consistent with those from earlier times.
It was evident from the correlation analysis that LogBasic EPS produced greater shared variance and correlation coefficients. However, it appears that all relationships were found to be statistically significant and that the variations in correlations between a subset of EPS categories were very minimal. It was necessary to ascertain the significance of the variances in correlation coefficients prior to drawing any conclusions from the study. Thus, the correlation data were subjected to paired t-testing.
Testing the mean scores of correlation for LogBasic and LogDiluted EPS
The statistical significance between the differences of correlations for LogBasic EPS and LogDiluted EPS was tested first, as shown. Tables 4.20 show the test results that were achieved.
Tables 4.20: T-test performed on correlations of LogBasic and LogDiluted EPS
| Mean | N | Std. Deviation | Std. Error of Mean | ||
| 1 | LogBasic EPS and LogShare price on date | .58 | 9 | .07 | .02 |
| LogDiluted EPS and LogShare price on date | .55 | 9 | .08 | .03 | |
| 2 | LogBasic EPS and LogShare price 20 days before | .58 | 9 | .04 | .01 |
| LogDiluted EPS and LogShare price 20 days before | .56 | 9 | .05 | .02 | |
| 3 | LogBasic EPS and LogShare price 20 days after | .60 | 9 | .06 | .02 |
| LogDiluted EPS and LogShare price 20 days after | .57 | 9 | .06 | .02 |
| Mean (paired difference) | t | df | Sig. (two- tailed) | ||
| Pair 1 | LogBasic EPS and LogShare price on date & LogDiluted EPS and LogShare price on date | .02 | 2.36 | 8 | .036 |
| Pair 2 | LogBasic EPS and LogShare price 20 days before & LogDiluted EPS and LogShare
price 20 days before |
.02 | 2.03 | 8 | .037 |
| Pair 3 | LogBasic EPS and LogShare price 20 days after & LogDiluted EPS and LogShare price 20 days after | .03 | 2.34 | 8 | .037 |
Source: Own research
From the tables listed above, it is evident that correlations for LogBasic EPS and LogDiluted EPS differed significantly (p < .05).
LogBasic EPS and LogShare prices on date had, on average, stronger associations (M =.58, SE =.02) than LogDiluted EPS and LogShare prices on date (M =.55, SE =.03); t (8) = 2.36, p <.05.
Few days before to publishing, the meanscore of LogBasic EPS and LogShare price (M =.57, SE =.01) was higher days prior to release than LogDiluted EPS and LogShare prices (M =.56, SE =.02), t (8) = 2.03, p <.05.
There were stronger associations between LogBasic EPS and LogShare price (M =.60, SE =.02) than between LogDiluted EPS and LogShare prices (M =.57, SE =.02), with t (8) = 2.34, p <.05.4
It is proposed based on these readings that the average correlation for LogBasic It is suggested from these interpretations that there was a substantial difference between the mean correlations for LogBasic EPS and the correlations found for LogDiluted EPS. Therefore, it is proposed that there was a statistically significant difference between LogBasic EPS and LogDiluted EPS and that this difference was not the result of chance.
The mean scores of LogBasic EPS and LogHeadline EPS were examined in accordance with Figure 4.2; the results are given in par. 4.4.2.
Testing the mean scores of correlation for LogBasic and LogHeadline EPS
The test for statistical significance between the variations in correlations for LogBasic EPS and LogHeadline is covered in this section. Tables 4.21 present the statistical findings obtained via t-testing.
Tables 4.21: T-test performed on correlations of LogBasic and LogHeadline EPS
| Mean | N | Std. Deviation | Std. Error of Mean | ||
| 1 | LogBasic EPS and LogShare price on date | .58 | 9 | .07 | .02 |
| LogHeadline EPS and LogShare price on date | .50 | 9 | .09 | .03 | |
| 2 | LogBasic EPS and LogShare price 20 days before | .58 | 9 | .04 | .01 |
| LogHeadline EPS and LogShare price 20 days before | .50 | 9 | .05 | .02 | |
| 3 | LogBasic EPS and LogShare price 20 days after | .60 | 9 | .06 | .02 |
| LogHeadline EPS and LogShare price 20 days after | .52 | 9 | .07 | .02 |
| Mean (paired difference) | t | df | Sig. (two- tailed) | ||
| Pair 1 | LogBasic EPS and LogShare price on date & LogHeadline EPS and LogShare price on date | .08 | 5.58 | 8 | .001 |
| Pair 2 | LogBasic EPS and LogShare price 20 days before & LogHeadline EPS and LogShare price 20 days before | .08 | 6.21 | 8 | .000 |
| Pair 3 | LogBasic EPS and LogShare price 20 days after & LogHeadline EPS and LogShare price 20 days after | .07 | 6.34 | 8 | .000 |
Source: Own research
The aforementioned tables show a considerable difference in the correlations between LogBasic EPS and LogHeadline EPS.
LogBasic EPS and LogShare prices on date had, on average, stronger associations (M =.58, SE =.02) than LogHeadline EPS and LogShare prices on date (M =.50, SE =.03); t (8) = 5.58, p <.05.
The mean score of the LogBasic EPS and LogShare price (M =.58, SE =.01) was higher than the meanscore of the LogHeadline EPS and LogShare prices (M =.50, SE =.02), t (8) = 6.21, p <.05.
There were stronger associations between LogBasic EPS and LogShare price (M =.60, SE =.02) than there were between LogHeadline EPS and LogShare prices (t (8) = 6.34, p <.05. (M =.52, SE =.02).
It is argued that the mean correlations for LogBasic EPS were higher and showed a significant difference from the mean correlations for LogHeadline EPS based on the interpretations given above. Therefore, it is possible to propose that variations in these relationships are not the result of random chance.
Testing the mean scores of correlation for LogDiluted and LogHeadline EPS
As indicated by Figure 4.2, it was also tested whether the difference between correlations of LogDiluted EPS and LogHeadline EPS was statistically significant.
Tables 4.22: T-test performed on correlations of LogDiluted and LogHeadline EPS
| Mean | N | Std. Deviation | Std. Error of Mean | ||
| 1 | LogDiluted EPS and LogShare price on date | .55 | 9 | .08 | .03 |
| LogHeadline EPS and LogShare price on date | .50 | 9 | .09 | .03 | |
| 2 | LogDiluted EPS and LogShare price 20 days before | .56 | 9 | .05 | .02 |
| LogHeadline EPS and LogShare price 20 days before | .50 | 9 | .05 | .02 | |
| 3 | LogDiluted EPS and LogShare price 20 days after | .57 | 9 | .06 | .02 |
| LogHeadline EPS and LogShare price 20 days after | .52 | 9 | .07 | .02 |
| Mean (paired difference) | t | df | Sig.(two- tailed) | ||
| Pair 1 | LogDiluted EPS and LogShare price on date & LogHeadline EPS and LogShare price on date | .05 | 6.56 | 8 | .000 |
| Pair 2 | LogDiluted EPS and LogShare price 20 days
before & LogHeadline EPS and LogShare price 20 days before |
.05 | 5.98 | 8 | .000 |
| Pair 3 | LogDiluted EPS and LogShare price 20 days after & LogHeadline EPS and LogShare price 20 days after | .05 | 6.08 | 8 | .000 |
Source: Own research
Tables 4.21 demonstrate that correlations for LogDiluted EPS and LogHeadline EPS differed significantly.
On average, correlations between LogDiluted EPS and LogShare prices on date (M = .55, SE = .03) were greater than correlations between LogHeadline EPS and LogShare prices on date (M = .50, SE = .03), t (8) = 6.56, p < .05.
The mean score of LogDiluted EPS and LogShare price 20 days before publication (M = .56, SE = .02) was greater than that of LogHeadline EPS and LogShare prices days before publication (M = .50, SE = .02), t (8) = 5.98, p < .05.
Correlations between LogDiluted EPS and LogShare price 20 days after publication (M = .57, SE = .02) were greater than correlations obtained for LogHeadline EPS and LogShare prices days after publication (M = .52, SE = .02), t (8) = 6.08, p < .05.
It may be inferred from these interpretations that the LogDiluted EPS and LogHeadline EPS scores differ significantly from one another. Compared to LogHeadline EPS, LogDiluted EPS showed higher average correlations. Thus, it may be argued that there is no chance explanation for the discrepancy between LogDiluted EPS and LogHeadline EPS.
In conclusion, the research yielded the following conclusions. There were significant differences in the average correlations between LogBasic EPS and LogDiluted EPS where the LogBasic EPS mean score was higher; there were also significant differences in the average correlations between LogBasic EPS and LogHeadline EPS where the LogBasic EPS mean score was higher; and there were significant differences in the average correlations between LogDiluted EPS and LogHeadline EPS where the LogDiluted EPS mean score was highest. Then, it is evident that LogBasic EPS produced the average correlations that were highest.
Testing the mean scores of correlation for LogBasic EPS and share prices
To ascertain whether there were differences in the mean scores of correlations between LogBasic EPS and particular share prices, t-testing was utilized. This would show whether LogBasic EPS is a better indicator of a certain share price or not. Table 4.23 presents the statistical results that were obtained.
Tables 4.23: T-test performed on correlations of LogBasic EPS and share prices
| Mean | N | Std. Deviation | Std. Error of Mean | ||
| 1 | LogBasic EPS and LogShare price on date | .58 | 9 | .07 | .02 |
| 2 | LogBasic EPS and LogShare price 20 days before | .58 | 9 | .04 | .01 |
| 3 | LogBasic EPS and LogShare price 20 days after | .60 | 9 | .06 | .02 |
| Mean (paired difference) | t | df | Sig. (two- tailed) | ||
| Pair 1 | LogBasic EPS and LogShare price on date & LogBasic EPS and LogShare price 20 days before | .00 | .03 | 8 | .974 |
| Pair 2 | LogBasic EPS and LogShare price on date & LogBasic EPS and LogShare price 20 days after | -.02 | -1.35 | 8 | .213 |
| Pair 3 | LogBasic EPS and LogShare price 20 days before & LogBasic EPS and LogShare price 20 days after | -.02 | -1.66 | 8 | .068 |
Source: Own research
According to the above tables, correlations for LogBasic EPS and selected share prices did not differ significantly.
On average, correlations between LogBasic EPS and LogShare prices on date
(M = .58, SE = .02) were greater than correlations between LogBasic EPS and LogShare prices (M = .58, SE = .01), t (8) = .03, p >.05..
The mean score of LogBasic EPS and LogShare price on date (M = .58, SE = .02) was smaller than that of LogBasic EPS and LogShare prices 20 days after publication (M = .60, SE = .02), t (8) = – 1.35, p > .05.
Correlations between LogBasic EPS and LogShare (M = .58, SE = .02) were lower than correlations obtained for LogBasic EPS and LogShare prices (M = .60, SE = .02), t (8) = – 1.66, p > .05 as of March 2024.
It is argued from these readings that the correlations shows no distinct variation with respect to any of the chosen share prices. The idea that LogBasic EPS did not correlate more strongly with one of the chosen share prices is then put forth, given that p >.05 for every observation. Even though pair 3 had the strongest association, it was still not very significant.
It is evident that basic EPS was able to best correlate with the behavior of share prices but it did not show any preference for any particular share price. The lowest mean scores and correlations were found for headline EPS. Consequently compared to other EPS categories headline EPS appears to have a worse association with share prices. In the paragraph that follows, a summary of all research findings is given.
Synopsis of statistical findings with regard to correlation modelling
| EPS category with highest correlation | EPS category with the lowest correlation | ||
| Year | EPS category type | Maximum shared variance | |
| March 2016 | Basic EPS | 29.20% | Headline EPS |
| March 2017 | Basic EPS | 36.80% | Headline EPS |
| March 2018 | Basic EPS | 43.40% | Headline EPS |
| March 2019 | Diluted EPS | 45.10% | Headline EPS |
| March 2020 | Basic EPS | 26.10% | Headline EPS |
| March 2021 | Basic EPS | 39.00% | Headline EPS |
| March 2022 | Basic EPS | 44.00% | Headline EPS |
| March 2023 | Basic EPS | 37.90% | Headline EPS |
| March 2024 | Basic EPS | 28.50% | Headline EPS |
Source: Own research
According to Table 4.24, the most favorable connections were found for the following years: 2016, 2017, 2018, 2019, 2020, 2021, 2022, 2023, and 2024. The greatest correlation for 2018 was seen for diluted earnings per share. For basic EPS, the maximum share variations were from 26.10% to 44%. Objectively speaking, this range appears to be quite vast given that as indicated investment decisions are influenced by a multitude of other factors. It is a really large impact when one element (basic EPS) can affect share prices by 26.10% to 44%. Throughout all nine years, headline earnings per share showed the lowest correlations. It seems that headline EPS has the least correlation with stock prices. There was no association modeling done only t-testing. In this case, the correlations’ mean scores were examined. A rank demonstration of the results acquired from oft-testing is presented.
CONCLUSION
A stock’s intrinsic value can be determined using the fundamental analysis approach by looking at the company’s core competencies, including its financial performance, earnings growth, management, industry, and overall economic conditions. This approach centers on examining both numerical and non-numerical data to ascertain the accuracy of a stock’s valuation. Techniques for fundamental analysis assist investors in comprehending and evaluating the long-term prospects of a company.
Investors can assess a company’s past performance and project its future success by examining its financial statements. This enables investors to base their choices not only on the erratic price movements of the market but also on the stock’s underlying value. Investors should take into account outside variables that could have an impact on the business and the industry at large while using the fundamental analysis method. Examples of things to take into account in basic analysis are the state of the economy, governmental regulations and industry trends. Through comprehension of this external environment investors can steer clear of unforeseen hazards and arrive at more informed investing choices.
The stocks of firms whose EPS is a significant factor in investment decisions can also be valued using fundamental analysis techniques. These techniques are helpful not just for valuing stocks of companies that are already listed on the capital market.EPS numbers show how well a company is performing, and gains in EPS are positively correlated with share prices, which create wealth for shareholders (Petty et al., 2022). Researchers that have examined the connection between EPS and share prices, including Almumani (2023), have discovered a strong correlation between changes in EPS and share prices. The research topic for this paper was derived from these conclusions. Basic, diluted, and headline EPS are the three categories of EPS that ZSE listed businesses must post. Which category of EPS basic, diluted, or headline EPS best correlates with share price behaviour has not been the subject of similar prior research.
The share price behaviour of the chosen top 20 companies from 2016 to 2024 is most closely correlated with basic EPS because paired t-testing was unable to detect significant differences (at a confidence level of 5%) for correlations obtained between basic EPS and share prices days prior, basic EPS did not prove to correlate better with any particular type of selected share price. Because of this, basic EPS can correlate equally well with all of the chosen share prices. However, statistical analysis revealed that in 2018, basic EPS did not offer the highest correlation coefficients. It appears that diluted EPS is taken into account during financial crises, while basic EPS is not a primary factor taken into account when the economy is under a lot of strain. It is argued that in the end while making investments in the top 20 ZSE listed businesses, investors ought to take basic EPS into account. Generally speaking, these firms’ share price behaviour was best correlated with basic EPS. However, it is advised that investors consider the state of the economy when making decisions because, during recessionary times, diluted EPS appears to be able to offer significant correlations with share prices.
In conclusion, the paper provided strong evidence that fundamental analysis has a significant impact on the earnings per share concept in stock valuation within the Zimbabwe Stock Exchange. The findings showed a direct correlation between a company’s EPS and its stock performance on the ZSE indicating that fundamental analysis can effectively guide investors in their decision-making process. The paper demonstrated the importance of considering fundamental factors, such as earnings per share, when valuing stocks in the ZSE. This information can be particularly useful for investors seeking to build a well-diversified portfolio, as it allows them to make informed choices based on a company’s financial strength and growth prospects. Furthermore, the research highlighted the need for investors to stay updated on key financial indicators and market trends to better navigate the Zimbabwe Stock Exchange. By employing a comprehensive approach that combines fundamental analysis with other evaluation methods, investors can enhance their understanding of the market and make more informed decisions. In conclusion, the study emphasized the importance of fundamental analysis, particularly the earnings per share concept, in stock valuation on the Zimbabwe Stock Exchange. It serves as a valuable guide for investors seeking to maximize returns and minimize risks within this market.
REFERENCES
- Arnold G., 2010, Inwestowanie W Wartość. Jak Zostać Skutecznym Inwestorem (Value Investing. How To Become A Disciplined Investor), Wydawnictwa Profesjonalne Pwn, Warszawa.
- Auret, C.J. & De Villiers, J.U. (2000). A Comparison Of Earnings Per Share And Dividends Per Share As Explanatory Variables For Share Prices. Journal For Studies In Economics And Econometrics, 24(1), 39-53.
- Baresa, Suzana; Bogdan , Sinisa; Ivanovic, Zoran (2019) : Strategy of stock valuation by fundamental analysis, UTMS Journal of Economics, ISSN 1857-6982, University of Tourism and Management, Skopje, Vol. 4, Iss. 1, pp. 45-51
- Besley, S. And Brigham, F. (2006) Essential Of Managerial Finance. Thoson:South-Western
- Borowski K., 2014, Analiza fundamentalna. Metody wyceny przedsiębiorstwa (Fundamental Analysis. Company Valuation Methods), Difin SA, Warszawa.
- Chang, H., Su, C., Chen, Y. & Chang, Y. (2008). The Relationship Between Stock Price And Eps: Evidence Based On Taiwan Panel Data. Economics Bulletin, 3(30), 1-12.
- Cooper,D and Schindler,P. (2003). “Business Research Methods” Eighth Edition Tata McGraw-Hill publishing company”
- Cunningham L. A., 2001, How To Think Like Benjamin Graham And Invest Like Warren Buffett, Mcgraw-Hill, New York
- Dębski W., 2018, Rynek finansowy i jego mechanizmy: podstawy teorii i praktyki (Financial Market and its Mechanisms: The Basis of Theory and Practice) [in Polish], Wydawnictwo Naukowe Pwn, Warszawa.
- Erasmus, P.D. (2010). Earnings, Dividends And Cash Flow Volatility: A South African Perspective. Corporate Ownership & Control, 8(1), 508-514
- Figurska M., Wisniewski R., 2016, Fundamental Analysis – Possiblity of Application on the Real Estate Market, Real Estate Management and Valuation, vol. 24, no. 4, pp. 35-46.
- Gao Y., Li H., 2011, A Consolidated Model Of Self-Fulfilling Expectations And Self-Destroying Expectations In Financial Markets, Journal Of Economic Behavior & Organization, Vol. 77, No. 3, Pp.: 368-381.
- Gereff, Gary (1999) “International trade and industrial upgrading in the apparel commodity chain” Journal of international economics 48
- Jajuga K., Jajuga T., 2018, Inwestycje: Instrumenty Finansowe, Aktywa Niefinansowe, Ryzyko Finansowe, Inżynieria Finansowa (Investments: Financial Instruments, Non-Financial Assets, Financial Risk, Financial Engineering), Wydawnictwo Naukowe Pwn, Warszawa
- Kotharic.C. (2004) : Research Methodology, Methods and Techniques, New Delhi International P.ltd
- Lev, B. (1989). On The Usefulness Of Earnings And Earnings Research: Lessons And Directions From Two Decades Of Empirical Research. Journal Of Accounting Research, 27(3), 153-191.
- Malinowska U., 2018, Rola Analizy Fundamentalnej W Warunkach Kryzysu (Role Of Fundamental Analysis In Conditions Of Crisis), Acta Universitatis Lodziensis. Folia Oeconomica, No. 262, Pp. 29-40.
- Mugenda, O. and Mugenda, A., (2003), Research Methods Qualitative and quantitative App. Africa Centre for Tecnology Studies (ACTS).
- Ostrowska E., 2007, Rynek Kapitałowy: Funkcjonowanie I Metody Oceny (Capital Market: Functioning And Appraisal Methods), Polskie Wydawnictwo Ekonomiczne, Warszawa
- Panfil M., Szablewski A., 2019, Dylematy wyceny przedsiębiorstwa (Dillemas of Company Valuation), Wydawnictwo Poltext, Warszawa.
- Sharma, S. (2011). Determinants Of Equity Share Prices In India. Journal Of Arts, Science & Commerce, 2(4), 51-60.