
Growth, Biomass Production, Pollutant Removal Capacity of Chlorella Vulgaris Cultivated in Water Polluted with Phosphates, Nitrates, Cadmium and Lead Ions; A Possible Strategy for Bioremediation, Carbon Dioxide Utilization and Simultaneous Biodiesel Productivity
Growth, Biomass Production, Pollutant Removal Capacity of Chlorella Vulgaris Cultivated in Water Polluted with Phosphates, Nitrates, Cadmium and Lead Ions; A Possible Strategy for Bioremediation, Carbon Dioxide Utilization and Simultaneous Biodiesel Productivity
Chathurika. H. Herath1, Manawadevi. Y. Udugala Ganehenege*1, 2
1Postgraduate Institute of Science, University of Peradeniya,
Peradeniya, Sri Lanka
2Department of Chemistry, Faculty of Science, University of Peradeniya,
Peradeniya, Sri Lanka
*Corresponding Author
DOI: https://doi.org/10.51244/IJRSI.2024.1105040
Received: 24 April 2024; Accepted: 10 May 2024; Published: 11 June 2024
ABSTRACT
The main objective of the work reported herein was to study the possibility of simultaneous use of microalgae for bioremediation and biodiesel production. Determination of optimum nitrate and phosphate concentrations for the maximum algal growth in the presence of heavy metal ions in the growth media was the other objective. In this regard, Chlorellavulgaris, a microalga, was cultivated separately for 30 days at ~28 °C in the presence and absence of known cadmium, lead, phosphate ion concentrations in growth media containing an optimum nitrate ion concentration. The concentrations of these ions in the growth media, dry algal biomass and extractable algal-oil percentage after 30 days of their growth were determined. According to the study, the optimum total nitrate and total phosphate concentrations required for the maximum algal growth were 200 mg L-1 and 10 mg L-1, respectively. The maximum tolerable Pb2+ and Cd2+ concentrations were 8 mg L-1 and 2.5 mg L-1, respectively. The results revealed that Chlorellavulgaris has a high capacity for both removing these ions (> 70%) from the growth medium, and generating algal biomass, simultaneously. Moreover, the algal biomass generated under these harsh conditions yields algal-oil (~41% in terms of dry algal biomass) that is free from these ions.
Keywords: Chlorella sp., Microalgae, Biomass, Renewable resources, bioremediation, algal-oil
INTRODUCTION
The rise of industrialization has left the environment exposed to various pollutants which are harmful to living beings. Numerous types and quantities of pollutants are released to the environment during the industrial production processes. Different methods are attempted to either mitigate or adopt for the environmental pollution caused by these numerous pollutants. Considering the high cost and the inconvenience associated with each of these procedures, identification of a single low cost method to remove different types of pollutants simultaneously is very beneficial. In this regard, microalgal bioremediation could be integrated with existing waste water treatment methods and potential applications of microalgal biomass for making biofuels (Li et al. 2020). However, the efficiency of these processes depends on the type of microalgae, microalgal growth in various water bodies, and the water quality. Some ions such as nitrates and phosphates are the nutrients required for algal growth. Excessive release of these nitrates and phosphates through various anthropological activities to the water bodies has been identified as the main cause for eutrophication in natural water bodies (Oswald et al. 1957). Excessive eutrophication ultimately reduces the dissolved oxygen content in water bodies resulting in many adverse effects to the aquatic environment. In addition, excess nutrients themselves are toxic to fish and other aquatic organisms. Therefore, wastewater containing these nutrients should be treated before discharging it into the environment. Many conventional methods which are used for nutrient removal are kind of undesirable, due to their high cost and sludge production. In place of these conventional methods, microalgae could be used as natural nutrient removal materials from the waste water treatment process, because they consume these nutrients for their growth (Ruiz-Marin et al. 2010). In contrast, the growth of microalgae may be affected adversely by heavy metal ions such as Pb2+, Cd2+ present in the growth media, as the way they become toxic for human consumption, due to their carcinogenic, mutagenic, non-biodegradable, bioaccumulation and biomagnification properties (Kadirvelu et al. 2001). Even in the presence of very low concentrations, removing these heavy metal ions by applying conventional methods is expensive and limited, due to high sludge formation and energy requirement (Fu et al. 2011. Natural microalgae could be employed in removing heavy metal ions efficiently if the algal growth is not retarded under these conditions (Farooq et al. 2010). More importantly, it will be very important if the biomass obtained from the algal species, which contribute for these bio-remediation, could be utilized to get bio-oils for the production of biofuels (Tien 2002). A systematic study and extensive research is essential in correlating these ion concentrations in the growth medium with the biomass produced by the microalgae grown under such harsh conditions.
Chlorellavulgaris is a microalga that is used as a food supplement, an animal feed, a pharmaceutical product, a fertilizer, and a biomass for both biofuel production and wastewater treatment (Safi et al. 2014). It has been shown that Chlorellasp. is capable of adapting and growing rapidly in highly polluted water, and has an ideal capacity to remove water pollutants such a excess nutrients and heavy metal ions from polluted water (Pittman et al. 2011). An additional value could be added to these microalgae, if the biomass of Chlorellasp. grown under these hash conditions could be utilized efficiently for biodiesel production. At a time the world is looking for sustainable wastewater treatment methods and renewable alternatives for fossil fuels, (Singh et al. 2011) identifying the capacity of these microalgae grown in polluted water to remove water/air pollutants and produce enough biomass for getting biofuel simultaneously is very important (Demirbas 2010; Felizardo et al. 2006, and Chisti 2007). In addition, these microalgae utilize CO2 present in the environment spontaneously for their growth. In order to apply microalgae for these multi functions simultaneously, microalgae need to have the capacity to intake excess nutrients and heavy metal ions present in their growth medium and produce enough biomass that is sufficient enough to produce biodiesel.
To our knowledge, no systematic study has been reported in the literature to evaluate all these capacities of microalgae simultaneously. Hence, it would be important and novel if research could be planned to correlate the bio-sorbent capacity of microalgae with the biomass productivity of the same microalgae grown in a medium containing known concentrations of nutrients and heavy metal ions. If a significant amount of bio-oil could be extracted from the same microalgae used as a bio-sorbent, microalgae could be as a renewable resource for getting biomass to produce biodiesel, aside from using it as a source for alleviating both the air pollution caused by CO2 emission and water pollution caused by excessive nutrients and heavy metal ions. Therefore, extensive research is essential to identify the optimum growth conditions, parameters and biomass production capacity of a known microalgae under these harsh conditions. Thus, the work reported herein describes the optimum nutrient (NO3– and PO43-) requirement including the NO3– /PO43- concentration ratio to optimize the growth of Chlorellavulgaris., its capacity to remove excess nutrients and the heavy metal ions (Cd2+ and Pb2+) present in the growth medium, biomass productivity and the extractable oil content. Further, the paper describes Cd2+ and Pb2+ removal efficiency at different pH values, phosphate removal efficiency, and heavy metal ion content that could be transferred to the extracted microalgal lipids. In this regard, algal growth kinetics, which are used to determine the tolerance of microalgae for different concentrations of heavy metal ions, are studied using a logistic growth model (Yang et al. 2011).
MATERIALS AND METHODS
Sampling, isolation and identification of Chlorella vulgaris
Water samples containing microalgae were collected from the highly polluted Beira Lake (6° 55′ 55″ North, 79° 50′ 52″ East), Colombo, Sri Lanka. A serial dilution was performed (10-1-10-5) for collected water samples and 100 µL of each were introduced into solidified agar plates containing autoclaved (15 psi, at 121 °C for 15–20 minutes) BG-11 media (Richmond 2004) in solidified 1.6 % (w/v) agar. The plates were left in an incubator at 25 ± 1 °C with a constant illumination around 8000 lux for 10 days. The isolation of Chlorella vulgaris from these water samples was done using the spread plate culturing technique. In order to isolate Chlorella vulgaris, the streak plate technique was performed and the identification was done with an automatic cell counting microscope (Lumen era camera Infinity1-Accu-Scope 3025 microscope) at a 400 x magnification. The dominant microalgal strain, Chlorella vulgaris, was introduced into a liquid BG-11 growth medium and used throughout the study.
Culture conditions in liquid phase, nutrient (nitrates and phosphates) optimization, and effect of nitrate/phosphate ratio for the maximum algal growth
To determine the influence of initial concentration of major nutrients, NO3– and PO43- were used as the nitrogen and phosphorus sources. In order to study the effect of different nitrogen concentrations, nine samples with an initial total nitrate (TN) concentrations of 0.0 mg L-1, 5.0 mg L-1, 25.0 mg L-1,100.0 mg L-1, 175.0 mg L-1, 200.0 mg L-1, 325.0 mg L-1, 400.0 mg L-1, 500.0 mg L-1 were prepared. The initial total phosphate (TP) concentration for all the samples was kept at 25.0 mg L-1. In order to study the effect of different phosphorus concentrations, nine samples with the initial TP concentrations of 0.0 mg L-1, 5.0 mg L-1, 10.0 mg L-1, 25.0 mg L-1, 100.0 mg L-1, 175.0 mg L-1, 200.0 mg L-1, 325.0 mg L-1, 500.0 mg L-1 were prepared. The initial TN concentration for all the samples containing different TP concentrations was kept at 200 mg L-1.
In order to determine the relationship between TN / TP ratios and the maximum algal growth, samples with the initial TN concentrations of 100.0 mg L-1, 200.0 mg L-1 and 300.0 mg L-1, and the initial TP concentrations of 5.0 mg L-1, 10.0 mg L-1 and 15.0 mg L-1 were prepared. Each medium was prepared by adding a modified BG-11 growth medium into autoclaved glass Erlenmeyer flasks (1 L), and by adjusting the initial pH of each media at 7.0 (Oakton, pH 700 Model benchtop meter) with NaOH (1.00 mol dm-3) and HCl (1.00 mol dm-3). For the inoculum preparation, microalgae culture (5 mL) at the exponential stage was centrifuged (at 5000 rpm for 15 min), the deposited algae were washed twice with distilled water, and inoculated into a sterilized modified BG-11 growth medium [1% (v/v) of inoculums] of which the initial absorbance was zero. Outdoor environmental conditions were supplied with natural sunlight (0.541-1.951 Klux at daytime for 12 hours) and continuous aeration (5 mLmin-1) using an aquarium pump for 25 days at room temperature (25-30°C). Water samples were withdrawn daily at regular time intervals and algal growth was determined by measuring the optical density of algal culture.
Algae growth measurements
The maximum absorbance wavelength ( λmax) for algal samples was determined by using a UV 1800 Shimadzu Spectrophotometer. Algal growth was determined by measuring OD678 (the optical density of algal culture at 678 nm) and algal density (D, cells mL-1). Samples were diluted by appropriate ratios to ensure the measured OD678 values are in the range of 0.2–0.7 if applicable, and three separate trials were conducted in each. Algal density measurements were taken using Scientific Infinity 1 camera with an Accu-scope 3025 microscope in nine spots of a glass slide. Average algal cells in 1.00 mL were calculated using Eq. 1 where, A is the average cell count (cells); C is the surface area of the coverslip (cm2) and M is the visible surface area from microscope (cm2). The relationship between OD678 and D were obtained by applying data into a linear fit of Origin 8.5 software, and D was then calculated for further experiments by applying OD678 into Eq.12.
Cells in 1.00 mL = A×C/M×0.05 mL ×1.00 mL (1)
Phosphate uptake determination
The phosphate uptake activities were quantified by preparing a modified BG-11 growth medium in autoclaved glass Erlenmeyer flasks (1 L) with the optimum initial TN and TP concentrations reported in previous studies. The initial pH of the growth medium was adjusted to 7.0. A microalgae inoculum was introduced to the medium, and standard culture conditions were supplied for 25 days. At 3-day time intervals, 60 mL of the agitated sample was withdrawn and centrifuged (5000 rpm for 15 min). The resulting supernatant solution was filtered (Whatman Schleicher & Schuell 110 mm) and persulfate digestion (Eaton et al. 2005) was carried out to convert all phosphorus into orthophosphate. The resultant clear solution was used to determine the remaining soluble phosphate (PO43-) content in the culture medium using the vanadomolybdate method (Lipps et al. 2018). The UV-visible absorption of the samples was determined at 400 nm using a1800 Shimadzu UV-Spectrophotometer. At the same time, 5 mL of an agitated sample was withdrawn in regular intervals from the culture medium and OD678 was measured. Three separate trials were carried out in each. Experimental TP removal efficiency (R) was calculated using Eq. 2 where, R is the TP removal efficiency (%); Ciis the initial TP concentration in the growth medium (mg L-1); Cf is the remaining TP concentration in the growth medium (mg L-1).
R(%) = Ci-Cf/Ci ×100 (2)
Determination of the maximum tolerable cadmium and lead ion concentrations for microalgae
Growth capability under different Pb2+ and Cd2+ ion concentrations was assayed by exposing the Chlorella vulgaris to solutions containing known amounts of Pb(NO3)2 and CdCl2.2H2O. Known aliquots of these stock solutions were added to modified BG-11 growth media in volumetric flasks (1 L), with optimized TN and TP concentrations in order to obtain the desired initial Pb2+concentrations of 0, 4, 8, 12, 16, 20, 24, 28, 32 and 36 mg L-1 and Cd2+concentrations of 0, 1, 1.5, 2, 2.5, 3, 4, 6, 8 and 10 mg L-1, separately. After adjusting the initial pH of each media at 7.0, a microalgae inoculum was introduced, volume up to the mark, transferred into separate autoclaved glass Erlenmeyer flasks (1 L), stoppered with a cotton wool bung, and allowed to incubate under standard culture conditions. The initial Cd2+ and Pb2+ concentrations were measured using a flame atomic absorption spectrophotometer (Agilent, Thermo- M Series Model) at 228.8 nm and 217 nm for Cd2+ and Pb2+, respectively. In order to set the calibration in a linear range, samples were diluted before the required analysis was done. During the entire period of cultivation (30 days), agitated samples were withdrawn at regular time intervals and OD678 were taken to determine the algal growth in each media.
Determination of cadmium and lead ion removal efficiencies by Chlorella vulgaris under different pH values
Cadmium and lead ion removal capacity by Chlorella sp. at different pH was studied in triplicate by exposing the Chlorellasp. separately to initial concentrations of Pb2+ and Cd2+ at 8 mg L-1 and 2.5 mg L-1, respectively at different initial pH values (4, 5, 6 and 7) in BG-11 growth media. These concentrations were found as the maximum tolerable heavy metal ion concentration for microalgae. A microalgae inoculum was introduced to each of these growth media, and the concentration of these metal ions retained in the growth media was estimated at 4-day time intervals. The total concentration of Cd2+ and Pb2+ removed by microalgae was calculated by taking the difference between the initial and the remaining concentrations of Cd2+ and Pb2+ ions in the supernatant. In order to do that, at 4-day time intervals, 6 mL of the agitated sample was withdrawn and centrifuged (at 5000 rpm for 15 min). The supernatants obtained were subjected to vacuum filtration through 0.45 µm Millipore filters. The filtrates were analyzed for residual Cd2+and Pb2+ ions by taking the atomic absorption spectrophotometric (AAS) measurements at 228.8 nm and 217 nm for Cd2+ and Pb2+, respectively, until the AAS measurements became a constant. The OD678 measurements in each media were also taken during the entire period of the cultivation to determine the algal growth. Replicated blank controls at each of the above pH values were run for the samples containing only the culture medium, Cd2+ and Pb2+ ions to avoid precipitation interference. Experimental Pb2+ and Cd2+ removal efficiency (R) was calculated using Eq. 3 where, R is these metal ion removal efficiency (%); Ci is their initial concentrations in growth medium (mg L-1); Cr is the remaining concentration of metal ions in the growth medium (mg L-1) and Cp is the precipitated concentration of heavy metal ions (mg L-1). The OD678 were taken to determine the algal growth at different pH values.
R(%) = (Ci-(Cr+Cp ))/Ci ×100 (3)
Determination of dry algal biomass content under various cadmium and lead concentrations
Chlorellasp. was exposed to Pb2+ and Cd2+ concentrations of 8 mg L-1 and 2.5 mg L-1, respectively, at an initial pH value of 7 in modified BG-11 growth media. The same procedure as explained above was followed in triplicate. Replicate blank controls were run in the absence of these metal ions at an initial pH of 7. All physical and chemical conditions were maintained as mentioned previously, and the samples were allowed to incubate. After 16 days of incubation (at the exponential phase), algal biomass was harvested by centrifuging (at 5000 rpm for 15 min) followed by removing the supernatant aqueous solution. The resulting algal pellets were washed three times with distilled water, transferred into separate pre-weighted watch glasses and dried at 40 ºC for a day until a constant weight was obtained. Finally, the dry algae biomass per unit volume of culture was calculated using Eq. 4 where, W is the dry algal biomass per unit volume of the culture (g L-1); W1 is the weight of the watch glass (g); W2 is the weight of the watch glass with the dry algal biomass and V (L) is the volume of the growth medium.
W = (W2-W1)/V (4)
Determination of total lipid production from microalgae
The dried cell biomass was introduced to an ultrasonic cleaning bath (Labotec, Model-704 ultrasonic bath) and ultra-sonication was done for 15 min in order to destroy algal cell walls. Each biomass sample was transferred to separate round bottom flasks, mixed with a mixture of hexane/methanol (2:1, V/V), and the total lipid content was extracted separately using Folch method (Floch et al. 1957). The extraction was performed by maintaining the biomass/solvent ratio at 1/50 (W/V). Solvent refluxing was done for 2 h extraction time and allowed to cool. Then, the resulting mixture was centrifuged (at 5000 rpm for 10 min) to separate solid algae content from the solvent system, and the hexane phase was transferred to a pre-weighed glass tube (W1). The remaining solvent phases were evaporated and dried under vacuum conditions until a constant weight (W2) of the extracted total lipid was obtained. All experiments were conducted in triplicate. Lipid content per unit volume of each culture was calculated using Eq. 5, and the percentage of lipid production was calculated using Eq.6 where, L is the lipid content in unit volume (g L-1); and M is the dry algal biomass in unit volume (g L-1).
Lipid content in unit volume = L = (g L-1 ) = W2 – W1 (5)
Lipid production (%) = L/M × 100 (6)
Determination of cadmium and lead ion content in extracted lipids
The possibility of presence of cadmium and lead ions in extracted lipids were analyzed using X-Ray Fluorescence spectrometer (Siemens, D5000 model). In this regard, dry algal biomass, which were grown in Cd2+ and Pb2+containing growth media, and the Cd2+ and Pb2+content in extracted lipids were analyzed. At the same time, dry algal biomass and extracted lipids in replicated blank controls containing culture medium in the absence of these metal ions were also analyzed.
Algal density, specific growth rate and carrying capacity determination using a classical model
A logistic mathematical equation, a classic model describing the microorganism’s growth in limited environmental conditions, was used to calculate growth parameters of the most microorganisms (Yang et al. 2011). A basic logistic equation which is used to explain the growth of Chlorellasp. is shown in Eq. 7 where, dP/dt is the growth rate (cells mL-1 d-1); P is the population of microalgae in the medium (cells mL-1); t is the growth time (d); r is the specific growth rate (d-1) and K is the carrying capacity where the maximum value of the microalgal population (cells mL-1) is considered. Carrying capacity, the maximum number of individuals in a population that the environment can support, is an indirect measurement of growth. The specific growth rate is a quantitative measure of cell count increase per unit time.
dP/dt = rP (1-P/K) (7)
At the beginning of the growth when t = 0, the inoculum is considered in its initial concentration which is equal to zero. Integration of the above equation from t0 to t gives the final expression as in Eq.8 where, n is the K/C and C is a constant for integration.
P = K/(1+ne-rt ) (8)
The OD678 measurements were considered as the growth indicator and by applying these data into Eq.12, the algal density was determined. The experimental growth values obtained were applied to the logistic equation (Eq.8) by using Origin Pro 8.5 software, and K, r and n were calculated. The results are shown in Table 1.
Table 1 Parameters of logistic growth curve fit for the growth of Chlorella sp.
| Parameter | Value | Error |
| K/105 (cells mL-1) | 8.2152 | 0.4642 |
| n | 19.18 | 2.3822 |
| r (d-1) | 0.2884 | 0.0218 |
| R2 | 0.9956 | |
Application of a model to determine the phosphate, cadmium and lead ions consumption
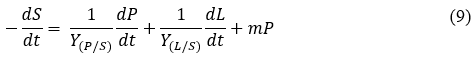
Substrate consumption kinetics could be expressed as substrate conversion to products and substrate consumption to maintenance (Yang et al. 2011), as shown in Eq. 9 where, – dS/dt is the total consumption rate of the substrate (mg L-1 d-1); Y (P/S) is the maximum microalgal growth coefficient (× 103 cells mg-1); Y(L/S) is the maximum lipid yield coefficient and m is the maximum specific consumption rate for maintaining microalgae life/ maintenance coefficient (× 10-3 mg cells-1); S is the substrate concentration (mg mL-1) and t is the cultivation time (d). The model parameters Y (P/S) and m are estimated from experimental data.
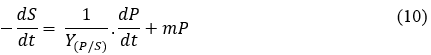
As lipids are intracellular metabolism products, the substrate is consumed mainly for microalgae growth, along with the accumulation of lipids, and the maintenance of microalgae. Upon making these assumptions, Eq. (9) could be simplified as:
Integrating the above equation from S0 to S, P0 to P and t0 to t and by substituting P from Eq.8 gives the final expression as shown in Eq.11.
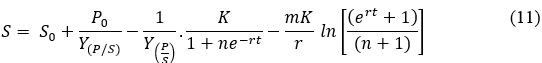
Eq. 11 was used in Origin Pro 8.5 both to fit the developed models and to estimate the parameters related to TP , cadmium and lead ion consumption.
RESULTS
Algae growth optimization
Chlorella sp. growth variation
The isolated Chlorella sp. cells are green, unicellular, oval shaped (diameter 3-10 µm), and surrounded by a thin cell wall. The maximum absorbance wavelength ( λmax) for algal samples was 678 nm. The correlation between OD678 and algal density (D, cells mL-1) are shown in Fig 1 and Eq. 12 where; D (cells mL-1) is the algal density; OD678 (Abs.) is the optical density; 9.367 ×10³ is the intercept and 12.642 ×10⁵ is the slope of the graph.
D =12.642 ×10⁵ OD678 + 9367, R2 = 0.9892 (12)
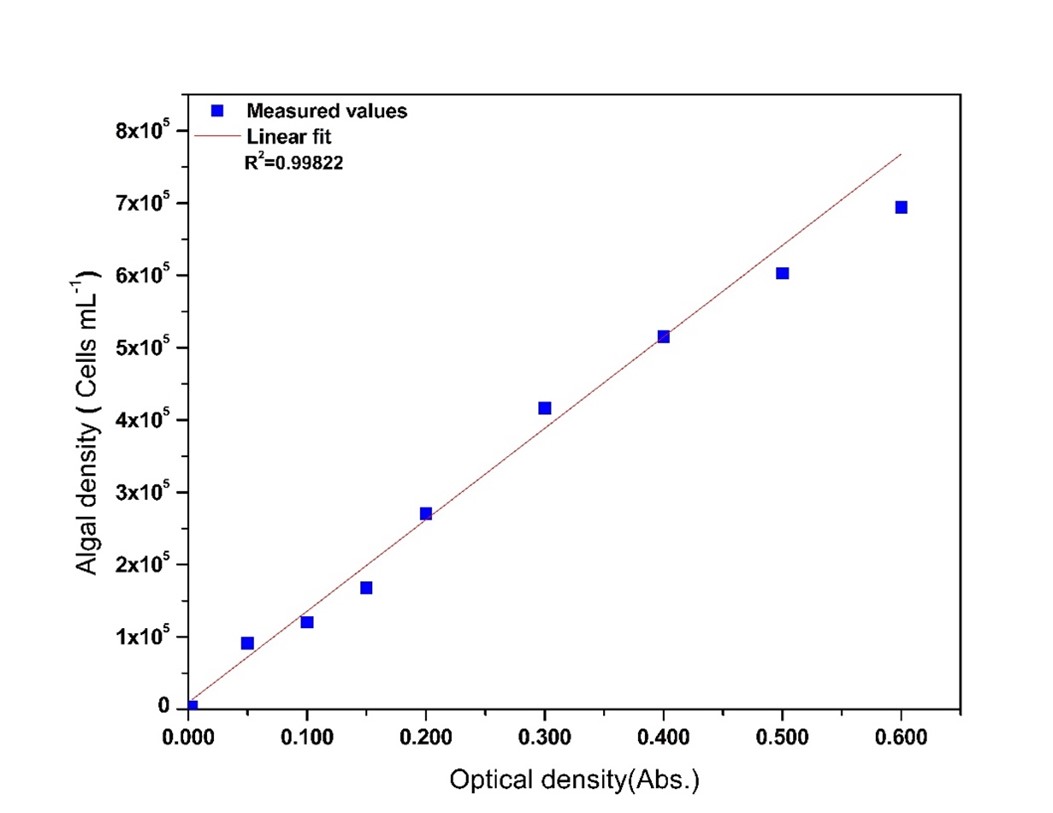
Fig 1.The correlation between optical density (OD678 at 678 nm) and algal density (D, cells mL-1) in terms of cell count.
Table 1. Parameters of logistic growth curve fit for the growth
| Parameter | Value | Error |
| K (×105 cells mL-1) | 8.2152 | 0.4642 |
| n | 19.18 | 2.3822 |
| r (d-1) | 0.2884 | 0.0218 |
| R2 | 0.9956 | |
Fig. 2 shows the growth profile of Chlorella sp. According to the profile, there are five main stages in algal growth, as expected (Richmond 2008); lag phase from starting day to the 2nd day, exponential phase from the 3rd day to the 8th day, linear growth phase from the 7th day to the 16th day, stationary growth phase from the 16th day and decline or death phase after the 16th day. The highest algal density was obtained at the stationary growth phase. Estimated parameters K, r and n by applying experimental growth values to the Eq.8 using Origin Pro 8.5 software are presented in Table 1 whereas the experimental results and corresponding fit to the model equation are shown in Fig 2.
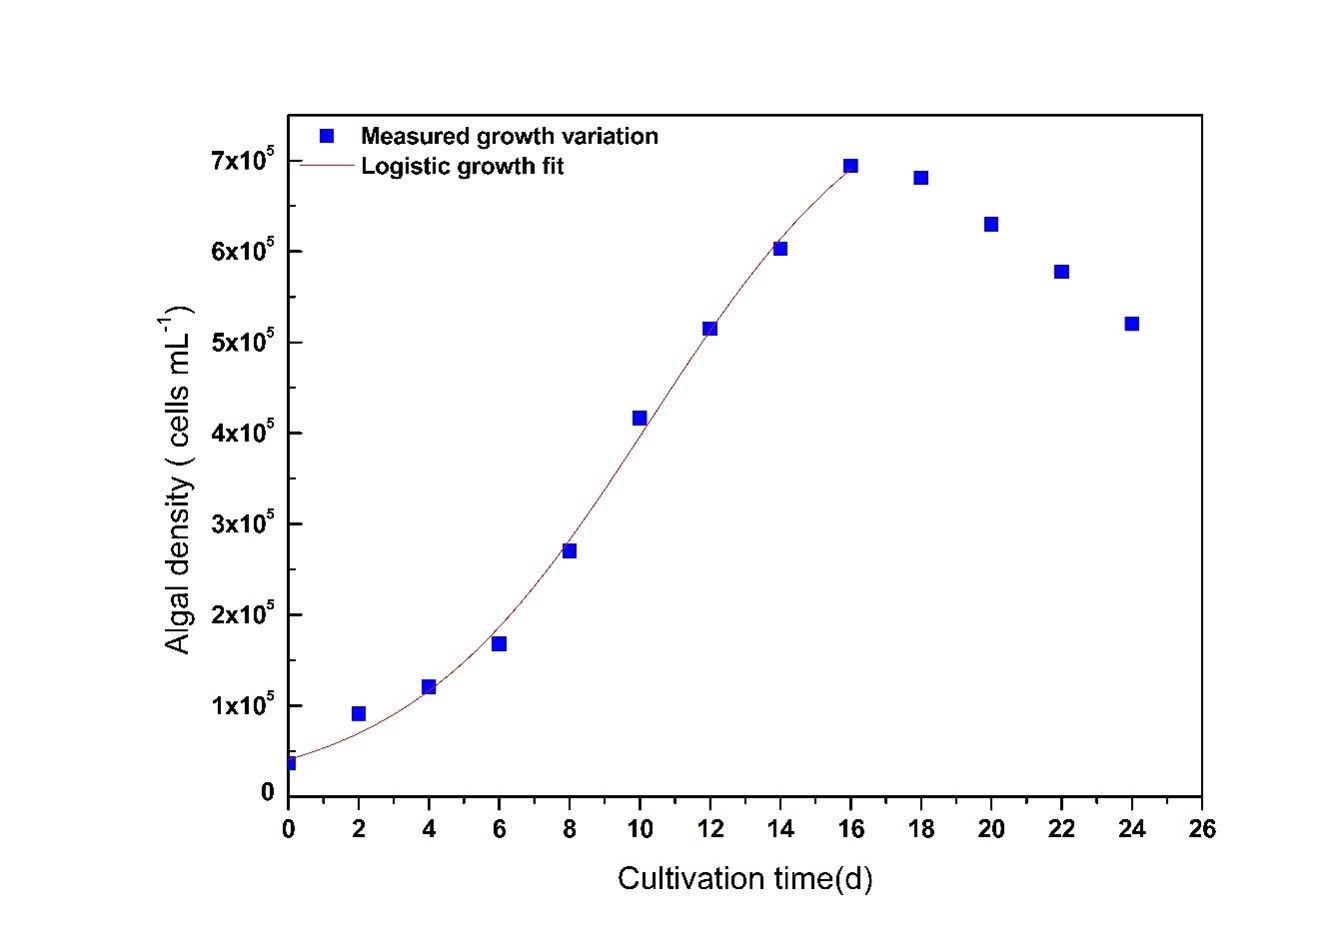
Fig 2. Growth profile of Chlorella sp. showing experimental (■) and calculated ( ) cell counts with cultivation time in days (d).
Chlorella vulgaris growth variation inside the Erlenmeyer flask at different cultivation time (in day 0, day 5, day 10, day 15, day 20 and day 25), and light microscopic images (×200) of Chlorella vulgaris growth variation from day 0 to day cultivation time are shown in Fig. 3 and Fig.4, respectively.
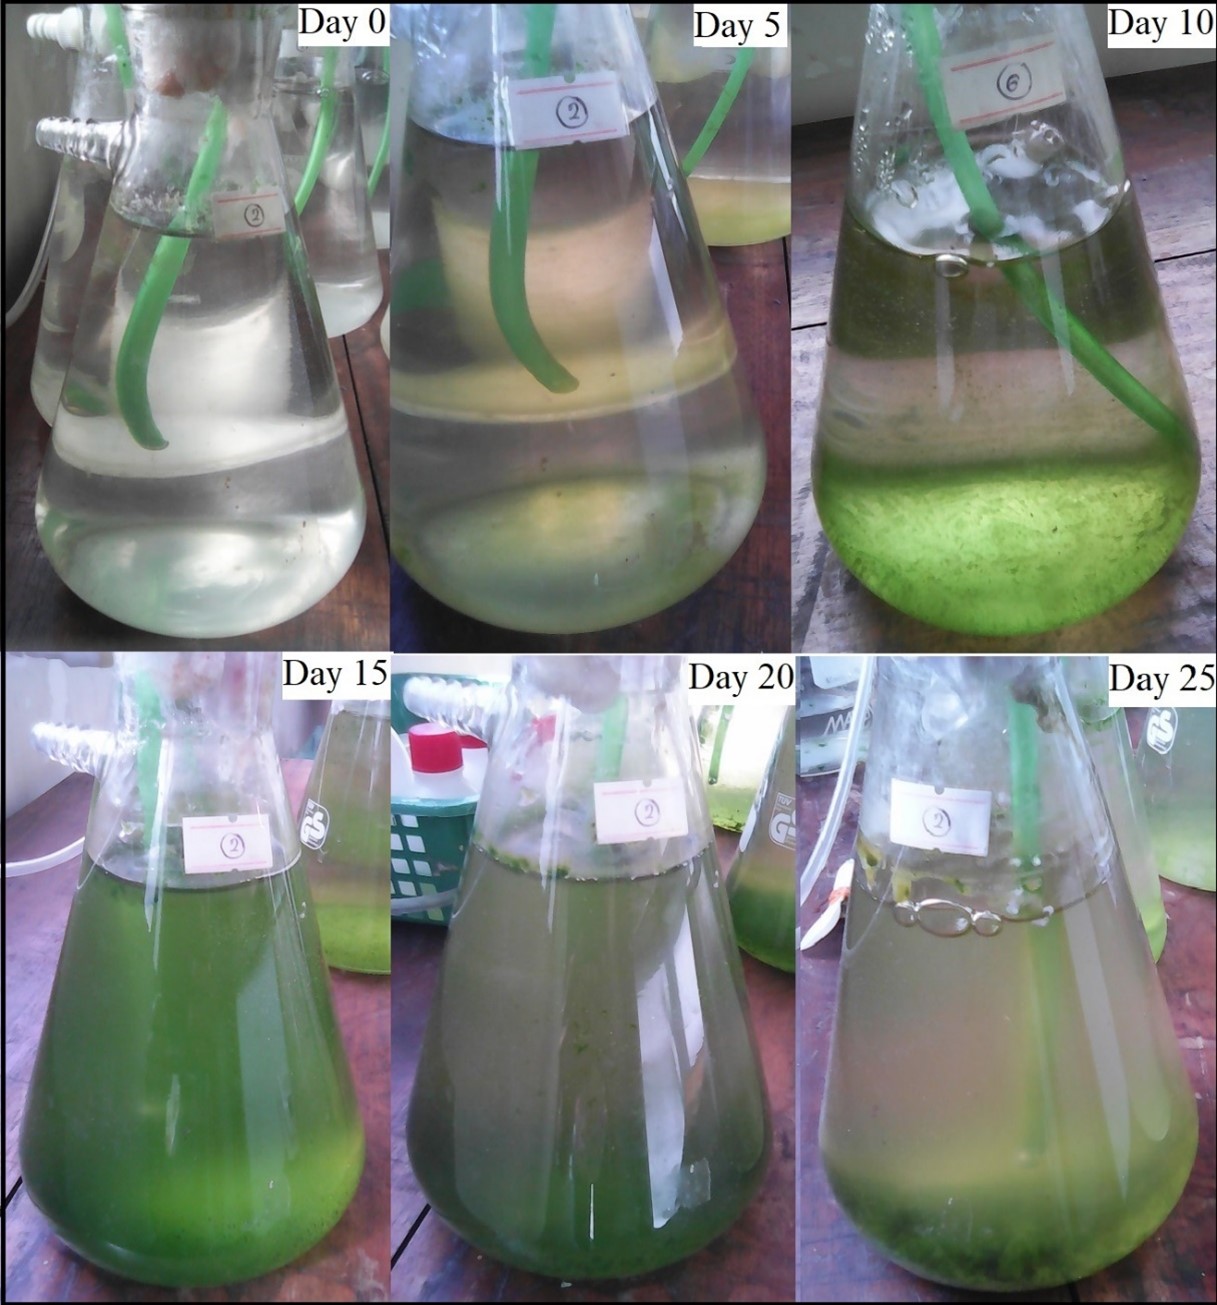
Fig 3. Chlorella vulgaris growth variation inside the Erlenmeyer flask at different cultivation time (in day 0, day 5, day 10, day 15, day 20 and day 25).
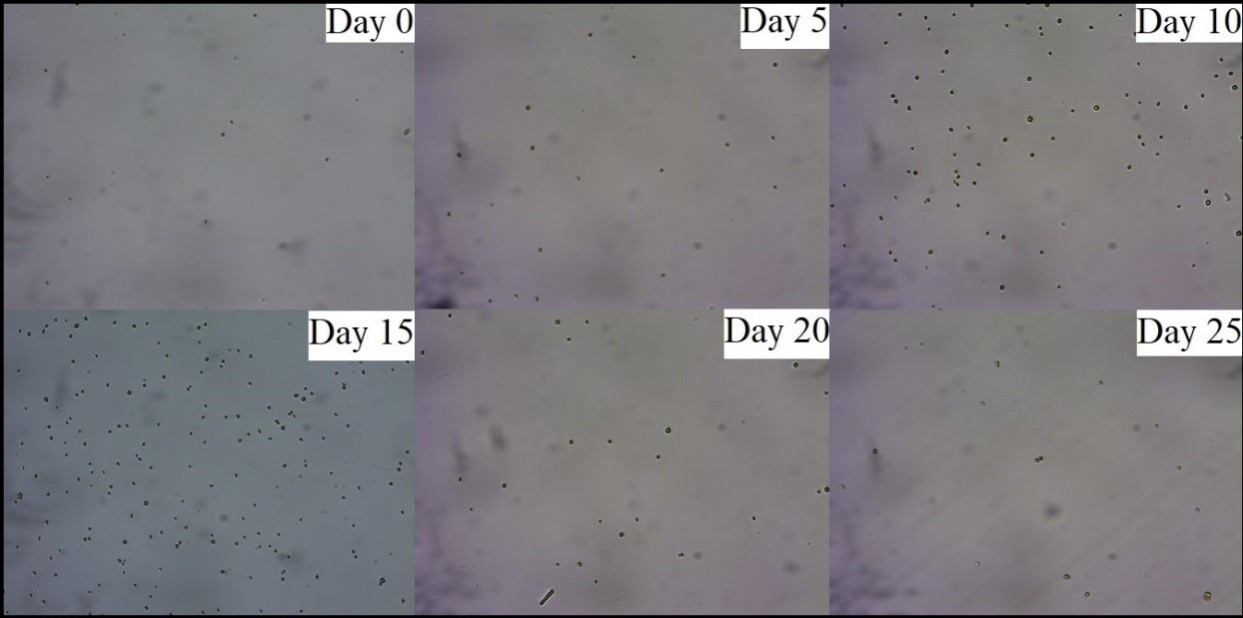
Fig 4.Light microscopic images (×200) of Chlorella vulgaris growth variation from day 0 to day 25 cultivation time.
Optimum nitrate and phosphate concentrations for microalgae growth
The experimental growth curves and corresponding logistic growth curves of Chlorellavulgaris. in growth media at different initial TN and TP concentrations are shown in Fig 5 and Fig 6, respectively. Through logistic model analysis of the growth data, the respective specific growth rate (r) and the carrying capacity (K) for different initial TN and TP concentrations were calculated, and the results are shown in Table 2 and Table 3, respectively.
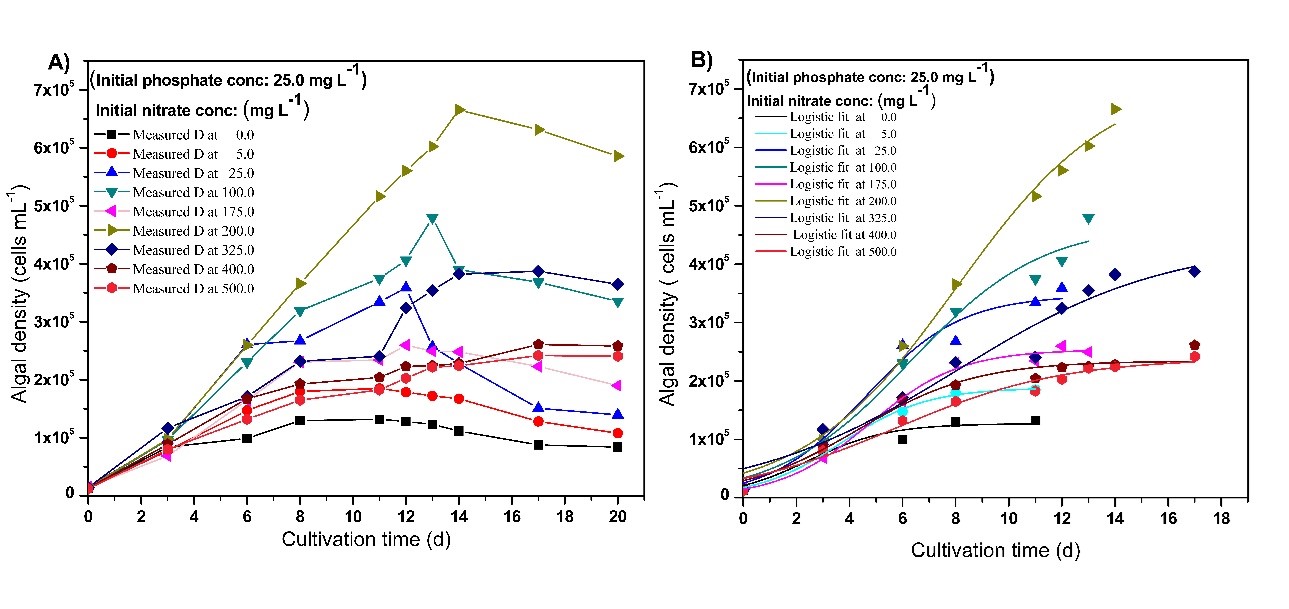
Fig 5.Experimental (A) and predicted (B, based on the model) growth curves of Chlorella vulgaris in growth media at different initial TN concentrations (at initial TP: 25 mg L-1).
Fig 6. Experimental (A) and predicted (B, based on the model) growth curves of Chlorella vulgaris in growth media at different initial TP concentrations (at initial TN: 200 mg L-1).
Table 2 Calculated specific growth parameters according to logistic growth curve fit for Chlorella sp. at different initial TN concentrations and at a constant initial TP concentration of 25 mg L-1.
| Initial TN (mg L-1) | K/105 (cells mL-1) | r (d-1) | n | R2 value | |||
| Value | Error | Value | Error | Value | Error | ||
| 0.0 | 1.27 | 0.12 | 0.6642 | 0.3104 | 5.1036 | 4.1055 | 0.9859 |
| 5.0 | 1.88 | 0.05 | 0.6202 | 0.0726 | 9.8851 | 2.4088 | 0.9937 |
| 25.0 | 3.47 | 0.24 | 0.5545 | 0.1406 | 12.9214 | 6.3894 | 0.9621 |
| 100.0 | 4.68 | 0.43 | 0.4058 | 0.1008 | 12.9214 | 6.3894 | 0.9680 |
| 175.0 | 2.53 | 0.69 | 0.5869 | 0.0729 | 16.3188 | 5.6784 | 0.9892 |
| 200.0 | 7.21 | 0.51 | 0.3463 | 0.0456 | 16.1645 | 3.8001 | 0.9913 |
| 325.0 | 4.37 | 0.63 | 0.2546 | 0.0672 | 7.7679 | 2.7323 | 0.9389 |
| 400.0 | 2.34 | 0.94 | 0.4509 | 0.0916 | 7.7074 | 2.9206 | 0.9583 |
| 500.0 | 2.39 | 0.14 | 0.3183 | 0.0590 | 6.2456 | 1.8029 | 0.9671 |
Table 3 Calculated specific growth parameters according to the logistic growth curve fit for Chlorella sp. at different initial TP concentrations and at a constant initial TN concentration of 200 mg L-1.
| Initial TN (mg L-1) | K/105 (cells mL-1) | r (d-1) | n | R2 value | |||
| Value | Error | Value | Error | Value | Error | ||
| 0.0 | 1.27 | 0.12 | 0.6642 | 0.3104 | 5.1036 | 4.1055 | 0.9859 |
| 5.0 | 1.88 | 0.05 | 0.6202 | 0.0726 | 9.8851 | 2.4088 | 0.9937 |
| 25.0 | 3.47 | 0.24 | 0.5545 | 0.1406 | 12.9214 | 6.3894 | 0.9621 |
| 100.0 | 4.68 | 0.43 | 0.4058 | 0.1008 | 12.9214 | 6.3894 | 0.9680 |
| 175.0 | 2.53 | 0.69 | 0.5869 | 0.0729 | 16.3188 | 5.6784 | 0.9892 |
| 200.0 | 7.21 | 0.51 | 0.3463 | 0.0456 | 16.1645 | 3.8001 | 0.9913 |
| 325.0 | 4.37 | 0.63 | 0.2546 | 0.0672 | 7.7679 | 2.7323 | 0.9389 |
| 400.0 | 2.34 | 0.94 | 0.4509 | 0.0916 | 7.7074 | 2.9206 | 0.9583 |
| 500.0 | 2.39 | 0.14 | 0.3183 | 0.0590 | 6.2456 | 1.8029 | 0.9671 |
Except at 175 mg L-1, D and K increased gradually upon increasing initial TN concentration up to 200 mg L-1, and decreased when TN exceeded 200 mg L-1. The highest specific growth rate was 0.6642 d-1, and it was obtained at the lowest initial TN concentration (0 mL-1). The data revealed that as the initial TN concentration increases, the specific growth rate decreases.
As shown in Fig 6, by varying the initial TP concentration at a constant initial TN concentration (200 mg L-1), the maximum specific growth rate of 0.7274 d-1 was observed even at 0 mg L-1 concentration of TP. Similar to the effect of TN, as the initial TP concentration increased in the growth media, the specific growth rate decreased. The highest K obtained was 6.70 ×10⁵ Cells mL-1 at 10 mg L-1 concentration of TP on the 14th day, and that could be considered as the optimum TP concentration. It was clear that K decreases when the initial TP concentration exceeds 10 mg L-1.
Effect of nitrate and phosphate concentrations and their ratios on microalgae growth
The optimum TN and TP concentrations required for the maximum growth were obtained as 200 mg L-1 and 10 mg L-1, respectively from previous experiments, and the TN/TP ratio was 20. Fig 7 and Table 4 show the parameters related to the growth in which TN to TP ratio is 20 under different concentrations. According to the results, the highest carrying capacity (12.4 ×10⁵ cells mL-1) was obtained when the initial TN was 200 mg L-1 and TP was 10 mg L-1 while the lowest carrying capacity was obtained when the initial TN was 100 mg L-1 and TP was 5 mg L-1. In the condition of nitrogen limitations (TN =100 mg L-1), algal density was very low. Surprisingly, at the excess nitrogen concentrations (TN = 300 mg L-1), the carrying capacity is comparatively lower than that at the optimum initial TN. The specific growth rate was the highest (0.4645 d-1) at the lowest initial nutrient concentrations.
Fig 7. Growth curves and calculated parameters of Chlorella vulgaris in growth media at different initial TN to constant TP concentration (20) ratios; based on the A) experimental data, B) data fitted into model, C) calculated carrying capacity, D) calculated specific growth rate.
Table 4 Growth parameters of Chlorellasp. at TN/TP =20(Xin L, 2010) with different concentrations of TN and TP
| Initial TN (mgL-1) | Initial TP (mg L-1) | K/105 (cells mL-1) | r (d-1) | n | R2 value | |||
| Value | Error | Value | Error | Value | Error | |||
| 100 | 5 | 2.49 | 0.32 | 0.4645 | 0.1504 | 8.7322 | 4.9819 | 0.9469 |
| 200 | 10 | 12.4 | 0.33 | 0.3172 | 0.5785 | 48.7681 | 14.0617 | 0.9874 |
| 300 | 15 | 5.13 | 0.15 | 0.3396 | 0.1198 | 29.4844 | 18.9129 | 0.9468 |
Phosphate uptake determination
According to the results (Table 5), PO43- concentration of 2.2722 mg L-1, which is equivalent to 7.6413 mg L-1 PO43- removal, was the lowest remaining PO43- concentration in the growth media on the 18th day implying a 77.04% removal of PO43-. After the 18th day, an increase of PO43- concentration was noticed. By applying data into the substrate consumption model (Eq.11), the calculated maximum PO43- removal was 7.7453 mg L-1 (78.01%), and the maximum specific consumption rate was 1.782 ×10⁻¹¹ mg cells-1 d-1. Correlation coefficient (R2) for the model (Fig 8) was 0.99503 indicating the results produced by the proposed calibrated mathematical model are consistent with those obtained experimentally.
In finding the relationship between microalgae growth variations and TP uptake, algal density increased until the 14th day, and decreased afterwards. By applying Eq.8, the calculated specific growth rate was 0.3223 ± 0.0421 d-1 and the carrying capacity was 6.98 ×10⁵ ± 0.88 ×10⁵ cells mL-1. A close relationship could be observed between the growth variation and TP removal. At the exponential growth phase, TP removal also occurs exponentially until it reaches its carrying capacity at the14th day. However, the TP removal rate gradually decreased when microalgae started to die.
Fig 8. Experimental and calculated values of algal growth and TP consumption: Measured algal density based on the cell count (■), Measured remaining TP concentration (■), logistic fit for the algal growth ( upward curve and substrate consumption fit ( downward curve) according to the model equations proposed in this study.
Table 5 Chlorella sp. growth and the measured and calculated parameters of its initial TP uptake
| Parameter | Readings | Error |
| Growth | ||
| Initial algal density /Y0 (cells mL-1) | 0.12 ×10⁵ | |
| Carrying capacity / K (cells mL-1) | 6.98×10⁵ | 0.88 ×10⁵ |
| Growth rate / r (d-1) | 0.3223 | 0.0421 |
| n | 29.8351 | 6.47669 |
| R2 | 0.99295 | |
| Measured TP removal | ||
| Initial TP(mg L-1) | 9.9185 | 0.0358 |
| Lowest remaining TP (mg L-1) | 2.2772 | 0.1073 |
| Maximum TP uptake (mg L-1) | 7.6413 | |
| TP removal efficiency (%) | 77.04 | |
| Calculated TP removal | ||
| Lowest remaining TP concentration: (mg L-1) | 2.1689 | |
| Maximum TP uptake (mg L-1) | 7.7453 | 0.36788 |
| TP removal efficiency (%) | 78.01 | |
| Y (P/S) (× 103 cells mg-1) | 8.22 ×10⁴ | 0.23 ×10⁴ |
| m (× 10-3 mg cells-1 d-1) | 1.782 ×10⁻⁸ | 1.2410-8 |
| R2 | 0.99503 | |
Capacity of cadmium and lead ion removal using microalgae
Effect of initial Cd2+ and Pb2+ concentrations for living microalgae growth
The growth variations and the growth parameters calculated using Eq.8 under different initial Pb2+ (0 – 36 mg L-1) and Cd2+ (0 – 10 mg L-1) concentrations are illustrated in Fig 9 and Fig 10, respectively.
Fig9. Growth of Chlorella vulgaris in growth media at different initial (A) Cd2+ and B) Pb2+concentrations. The curves represent the expected curves according to the model equation proposed in this study.
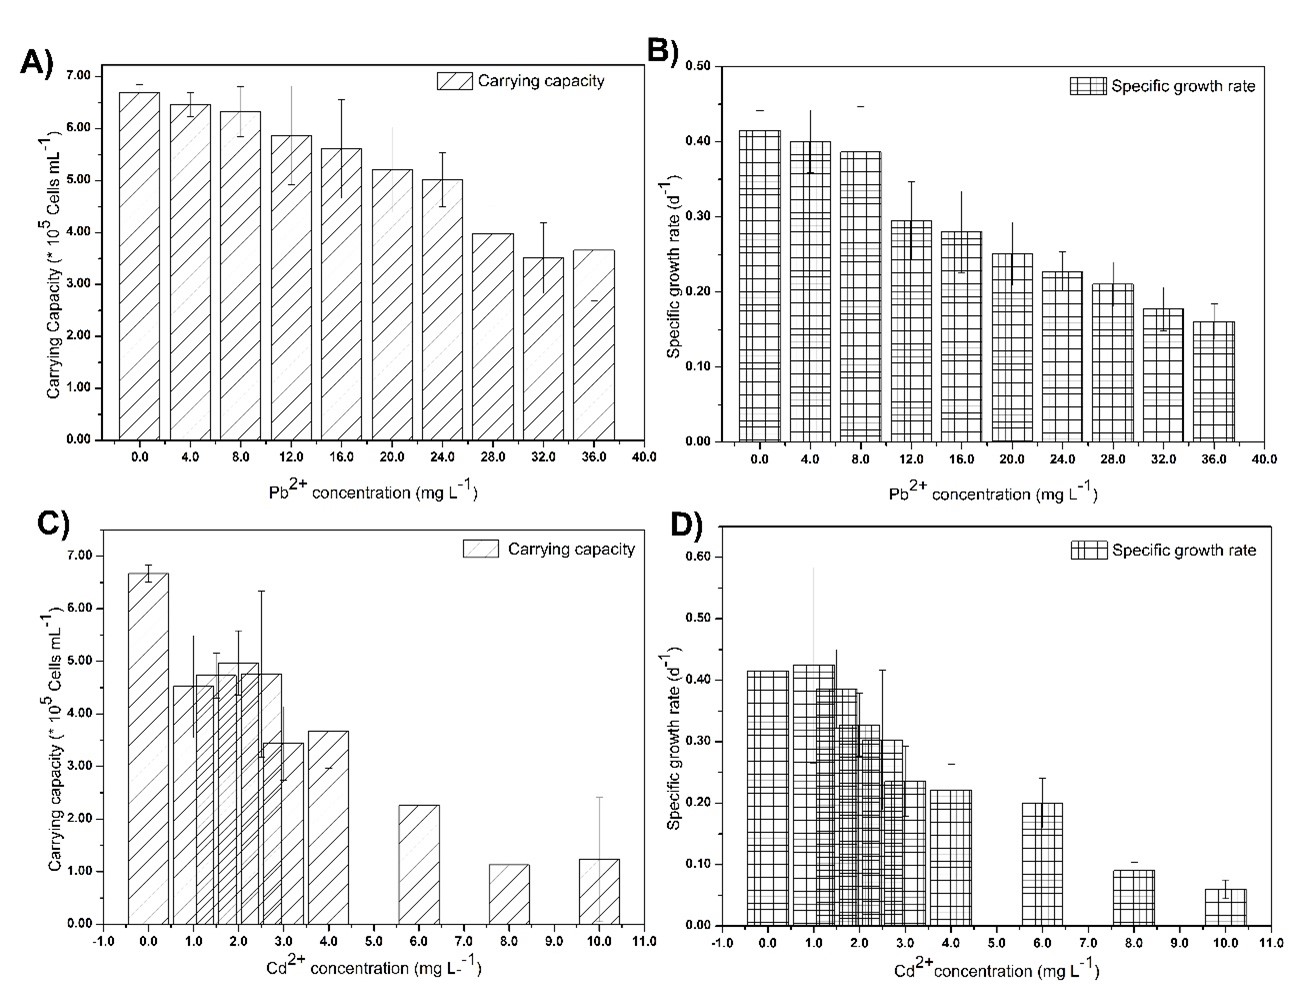
Fig 10. Calculated parameters related to growth of Chlorella vulgaris in growth media for different initial heavy metal ion concentration: A) Carrying capacity at different initial Pb2+ concentrations, B) Specific growth rate at different initial Pb2+, C) Carrying capacity at different initial Cd2+ concentrations, D) Specific growth rate at different initial Cd2+concentrations.
Results revealed that the K is being decreased (Fig 10), as the initial heavy metal ion concentration increases, and the K becomes highest in the absence of any heavy metal ions. Low K values were obtained even at low Cd2+ ion concentrations while relatively high K values were obtained at high Pb2+ ion concentrations implying Cd2+ is more toxic than Pb2+ for living algae. In order to remove these heavy metal ions from living microalgae effectively, algae should produce a considerable amount of algae biomass, and be tolerable for higher concentration of heavy metal ions. The results revealed that the maximum tolerable Pb2+and Cd2+ion concentrations for living microalgae were 8 mg L-1 and 2.5 mg L-1,respectively. Specific growth rates did not vary at lower concentrations, but reduced significantly at higher exposure levels of both Cd2+ and Pb2+ ions. Under higher toxicity levels, algae spent more time in the lag phase to adapt for harsh environmental conditions. However, in excessive heavy metal ion concentrations, specific growth rates have significantly gone down, due to the destruction of algal cells.
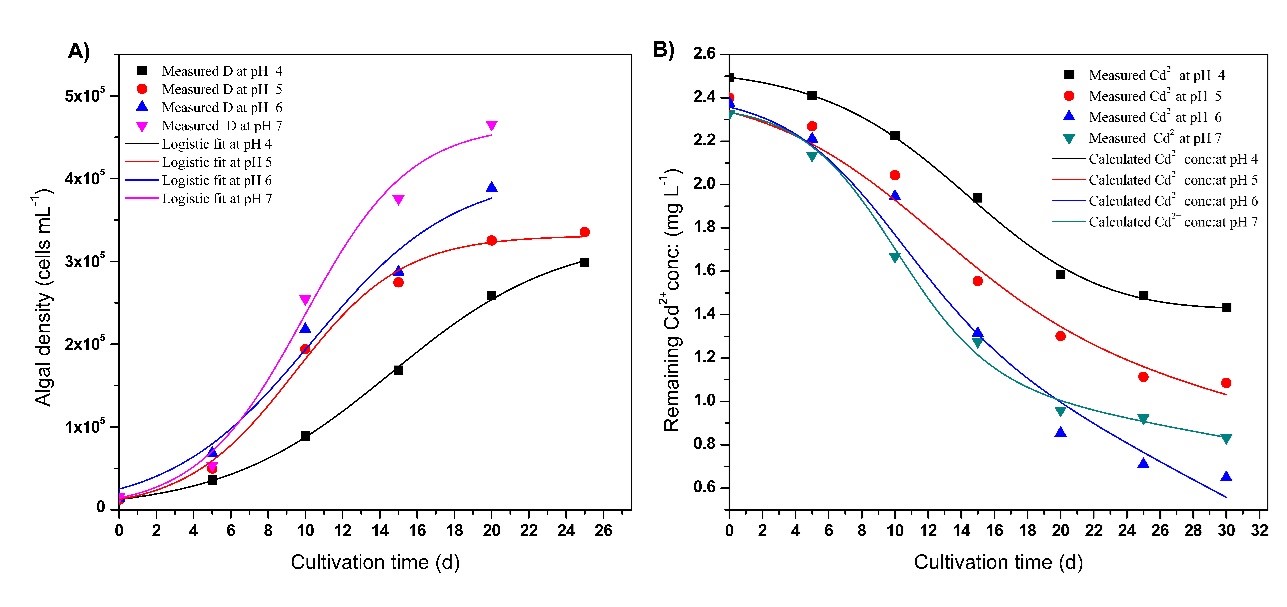
Fig 11.Chlorella vulgaris growth pattern (A) and Cd2+( with an initial concentration of 2.5 mg L-1) uptake patternat different cultivation timeand initial pH values of4 ( ),5(),6(),7(). A); Curves represent the expected patterns according to the model equations proposed in this study.
Influence of pH for heavy metal (Cadmium and lead) ion removal and algal growth
In order to determine the effect of pH on the removal of Cd2+ and Pb2+ by microalgae, the pH of the growth media was changed between 4 and 7. It was noticed that heavy metal ion removal from microalgae was pH dependent, as pH affects both algae growth and metal ion precipitation. The remaining residual metal ion concentration and their removal efficiency (R) in the supernatant were determined using Eq.3. Replicated control tests were used to avoid the interference of precipitation.
According to the results (Figs 11 and 12), the maximum Pb2+ and Cd2+ ions removal efficiency was observed at pH 5.0 and pH 6.0, respectively. The study on Pb2+ ions exhibited the highest measured uptake of 6.5943 mg L-1 (84 %) at pH 5.0 and the lowest uptake of 5.2063 mg L-1 (65 %) at pH 4.0 within 30 days. The study on Cd2+ ions exhibited the highest Cd2+ ion uptake of 1.7269 mg L–1 (72.7%) at pH 6.0 and the lowest uptake of 1.0607 mg L-1 (42.6%) at pH 4.0 within 30 days.
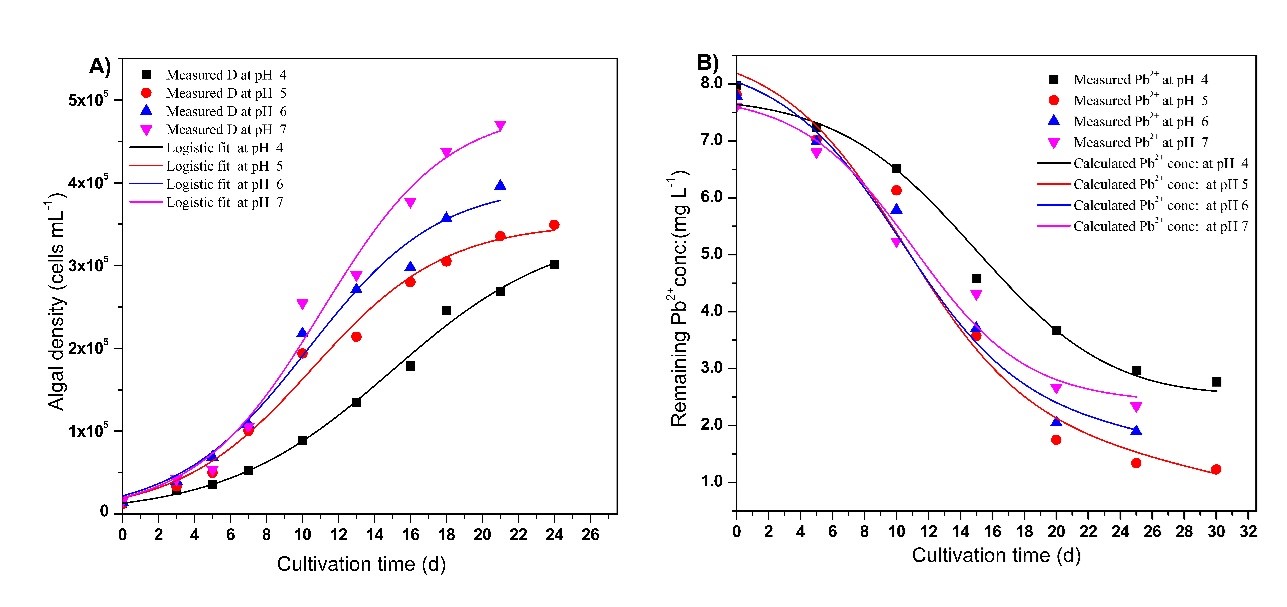
Fig 12. Chlorella vulgaris growth and Pb2+( with an initial concentration of 8.0 mg L-1) uptake patternat different cultivation timeand initial pH values of 4 ( ),5( ),6(. ),7( ). A); Curves represent the expected patterns according to the model equations proposed in this study.
By applying a substrate consumption model shown in Eq.10, remaining residual metal ion concentrations and their removal efficiency (R) were calculated and the results are tabulated in Table 6 and Table 7, respectively. The results provide an accurate match to the measured data of heavy metal ion uptake. The highest calculated Cd2+ and Pb2+ ion uptake was 1.7269 mgL-1 (76.58%) at pH 6 and 6.6594 mgL-1 (85.13%) at pH 5, respectively. The correlation coefficient (R2) for the fits (Eq.10) is closer to 1.0 indicating the proposed calibrated mathematical model fits well with the experimental data. The calculated maximum specific consumption rates were 1.0488 × 10⁻¹⁰ mg cells-1 d-1 at pH 6 and 1.6917 × 10⁻¹⁰ mg cells-1 d-1 at pH 5 for Cd2+ and Pb2+ , respectively.
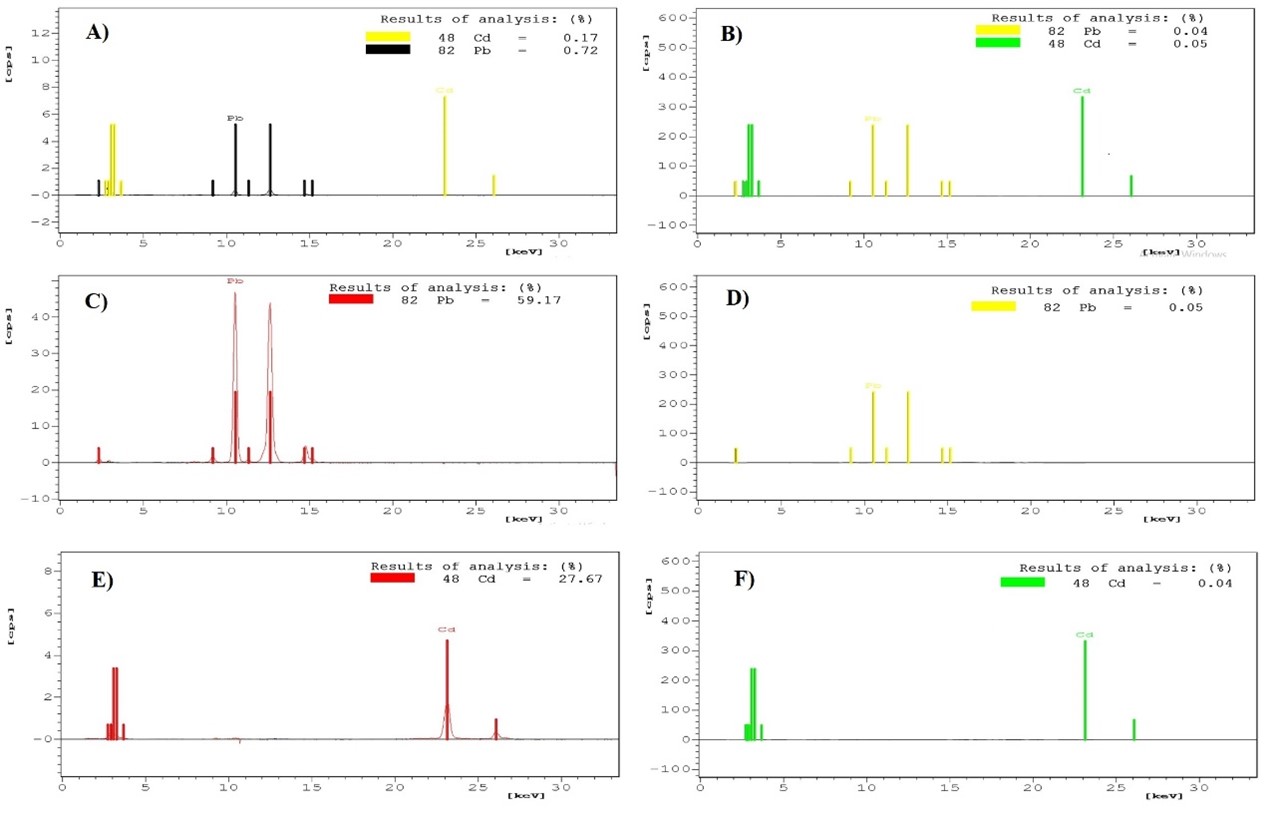
Fig 13. XRF analysis data on the surface of dry algae biomass prior to lipid extraction and in extracted lipids Pb2+ and Cd2+content A) on the surface of dry algae biomass prior to lipid extraction in controller, B) in extracted lipid in controller, C) on the surface of dry algae ( grown in lead containing media) biomass prior to lipid extraction from algae grown in lead containing growth media, D) in extracted lipid in controller; and Cd2+ contentE) on the surface of dry algae biomass prior to lipid extraction,F) in extracted lipid.
Table 6Measured and calculated parameters of initial Cd2+ ion uptake by microalgae at different pH values
| pH 4 | pH 5 | pH 6 | pH 7 | |
| Measured parameters | ||||
| Initial Cd2+ concentration:(mg L-1) | 2.4924 | 2.4011 | 2.3760 | 2.3290 |
| Lowest residual Cd2+ concentration: (mg L-1) | 1.4317 | 1.0851 | 0.6491 | 0.8322 |
| Maximum Cd2+ uptake (mg L-1) | 1.0607 | 1.3160 | 1.7269 | 1.4968 |
| Cd2+ removal efficiency (%) | 42.57 | 54.81 | 72.68 | 64.26 |
| Calculated parameters by the model | ||||
| Lowest residual Cd2+ concentration: (mg L-1) | 1.4304 | 1.0349 | 0.5564 | 0.8442 |
| Maximum Cd2+ uptake (mg L-1) | 1.0612 | 1.3160 | 1.7269 | 1.4848 |
| Cd2+ removal efficiency (%) | 42.60 | 56.89 | 76.58 | 63.72 |
| Y (P/S) (× 103 cells mg-1) | 2.6372 ×10⁵ | 2.9953 ×10⁵ | 3.5999 × 10⁵ | 3.6826 × 10⁵ |
| m (× 10-3 mg cells-1 d-1) | 2.0659 × 10⁻⁸ | 4.9868× 10⁻⁸ | 1.0488 × 10⁻⁷ | 2.9371× 10⁻⁸ |
| R2 | 0.9974 | 0.9773 | 0.9789 | 0.9952 |
Table 7Measured and calculated parameters of initial Pb2+ ion uptake by microalgae at different pH values
| pH 4 | pH 5 | pH 6 | pH 7 | |
| Measured parameters | ||||
| Initial Pb2+ concentration:(mg L-1) | 7.9716 | 7.8223 | 7.7901 | 7.6086 |
| Lowest residual Pb2+ concentration: (mg L-1) | 2.7653 | 1.2280 | 1.8930 | 2.3405 |
| Maximum Pb2+ uptake (mg L-1) | 5.2063 | 6.5943 | 5.8971 | 5.2681 |
| Pb2+ removal efficiency (%) | 65.31 | 84.30 | 75.67 | 69.24 |
| Calculated parameters by model | ||||
| Lowest residual Pb2+ concentration: (mg L-1) | 2.6240 | 1.1629 | 1.9555 | 2.5014 |
| Maximum Pb2+ uptake (mg L-1) | 5.3476 | 6.6594 | 5.8346 | 5.1072 |
| Pb2+ removal efficiency (%) | 67.08 | 85.13 | 74.90 | 67.12 |
| Y (P/S) (× 103 cells mg-1) | 5.5344 × 10⁴ | 6.1160× 10⁴ | 7.2129 × 10⁴ | 9.1978× 10⁴ |
| m (× 10-3 mg cells-1 d-1) | 8.01825× 10⁻⁸ | 1.6917× 10⁻⁷ | 1.0957× 10⁻⁷ | 7.1399× 10⁻⁹ |
| R2 | 0.98246 | 0.97525 | 0.9817 | 0.9732 |
Determination of dry algal biomass and extractable lipid content in the presence of Cd2+and Pb2+ ions in the growth media
Table.8 shows the average dry weight of algae biomass, lipid content and the percentage of algae lipid production to dry biomass. According to the results, the controller resulted both the largest dry algae biomass (0.8260 g L-1), and the total lipid yield (0.3362 g L-1) whereas the presence of Cd2+ in the growth medium during the stationary growth phase resulted the lowest dry algae biomass (0.2896 g L-1) and total lipid yield (0.1298 g L-1). As the growth has been suppressed in the presence of Cd2+, the algae grown in that medium resulted in a quantitatively low lipid content. However, the lipid content to the dry algal biomass as a percentage for media containing Cd2+, Pb2+ and the controller was 44.80%, 37.64% and 40.69%, respectively. Although the resultant dry algal biomass and lipid content in Pb2+ containing media were higher than those values in Cd2+ containing media, the lipid production to the dry algal biomass as a percentage in Pb2+ containing media was the lowest (37.64%).
Table 8 Average dry biomass production, average lipid production and percent lipid production per unit dry biomass of Chlorella sp. in the presence of Pb2+ and Cd2+ ions in the growth media
| Controller | Pb2+ containing media | Cd2+ containing media | |
| Average dry weight of algae biomass
(gL-1) |
0.8260±0.0359 | 0.5551±0.0204 | 0.2896±0.0280 |
| Average lipid production
(gL-1) |
0.3362±0.0139 | 0.2091±0.0140 | 0.1298±0.0143 |
| Percentalgae lipid production to dry biomass (%) | 40.69 | 37.64 | 44.80 |
To investigate whether these heavy metal ions are extracted into lipids, XRF analysis was done. Heavy metal content present on dry algal biomass surface prior to lipid extraction and in extracted lipids are shown in Fig 13. As shown in Fig 13, it is confirmed that the content of heavy metals in extracted lipids is negligible. Though 27.67% of Cd2+ was present on the surface of dry algae biomass prior to lipid extraction, only 0.04% of Cd2+ was present in the lipid extracted from this biomass. Similarly, 59.17% of Pb2+ was present on the surface of dry algae biomass whereas only 0.05% of Pb2+ was present in extracted lipids.
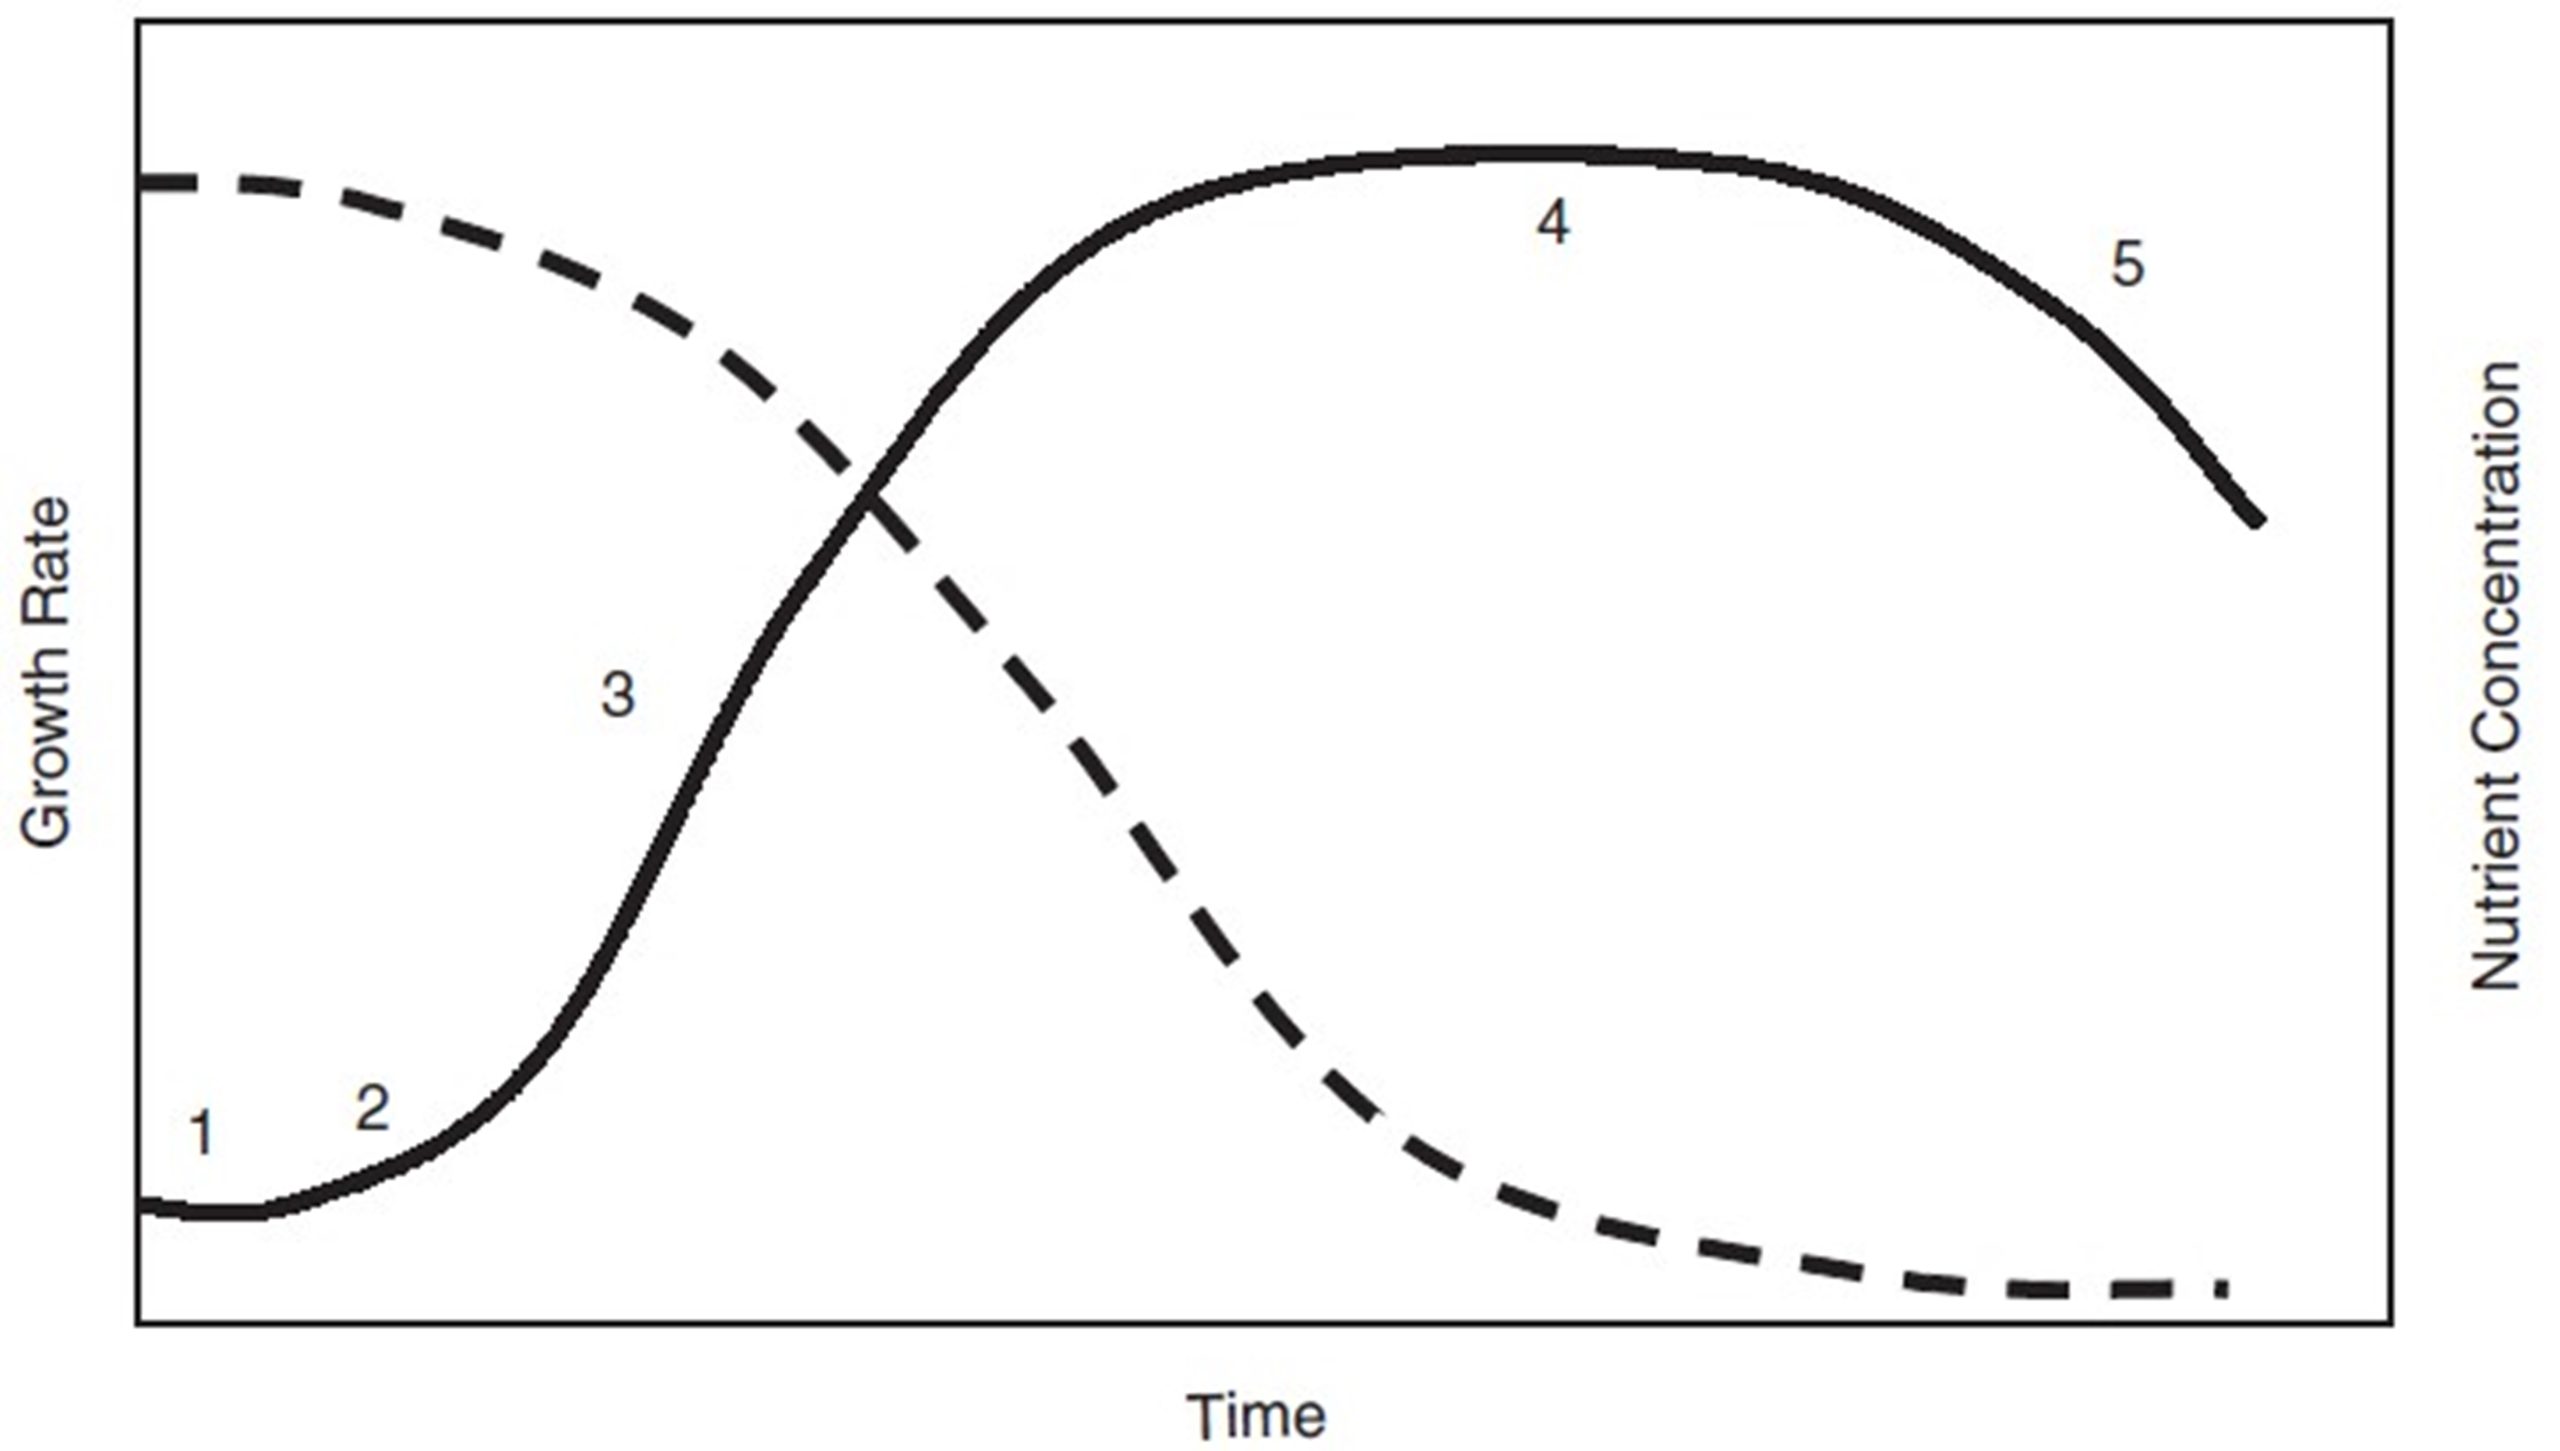
Fig 14. Schematic growth curve in a batch culture (solid line) with different growth phases and nutrient uptake (dashed line) with time (Richmond A 2004).
DISCUSSION
Beira Lake, which is situated in the heart of the Colombo city in Sri Lanka, is highly polluted and rich in microalgae. The presence of microalgae in Beira Lake is an indication of their capacity to survive under highly polluted conditions. In order to obtain pure cultures with required algal strain, isolation of Chlorella vulgaris was done at the initial step using the spread plate culturing technique. The maximum absorbance wavelength (λmax) of the Chlorella sp. was 678 nm and it was consistent with the reported value (680 nm) (Lichtenthaler H. K. et al. 1983), and not interfered from main pigments of chlorophyll a ( λmax= 662.6 nm) and chlorophyll b ( λmax= 645.6 nm). Since the OD678 measurements were proportional to the algal density, and showed a linear relationship between the OD678 with algal density, OD678 measurements were used to measure the algal growth in this study.
According to the experimental results, the 16th day was the stationary phase and the maximum D was 6.94 × 10⁵ cells mL-1 in that phase. The maximum D (K) calculated using a logistic model (Yang et al. 2011) was 8.21× 10⁵ cells mL-1 with a r value of 0.2884 d-1. Correlation coefficient (R2) for the model fit (Fig 2) was 0.9956 implying the proposed calibrated mathematical model is consistent with the experimental data.
In this study, optimization of limiting factors to obtain the maximum algal biomass was considered. However, optimization of physical factors is quite more expensive on an industrial scale than the optimization of nutrient content. Therefore, nutrient optimization is considered in the present study. Here, the TN and TP concentrations are considered as the important factors which directly influence algae growth kinetics (Xin et al. 2010). Algae readily use inorganic nitrogen in the form of NO3–, NO2–, NH4+ and N2 gas (Ding et al. 2016), and it is an essential element for chlorophyll production. As they reported, nitrate is the best nitrogen source for the maximum algae biomass production. Therefore, in this experiment, NaNO3 was used as the nitrate source. According to the experimental results, K increased significantly when TN concentration increased from 0 mg L-1 to 200 mg L-1. However, further increase in TN causes lowering the K. Therefore, the results suggest that TN has become the limiting factor below the optimum TN concentration, and excess TN might be inhibitive. Or else other limiting factors such as light may suppress the growth (Yanqun et al. 2008). The abnormally low D and K at 175 mg L-1 may also be due to other limiting factors such as light, space or foreign attack caused by other microbial organisms. When the TN concentration was kept at 200 mg L-1, the K obtained at the 14th day was the highest (7.21×10⁵ cells mL-1) and that TN concentration (200 mg L-1) can be considered as the optimum TN for algal growth.
Algae assimilates phosphorus as inorganic orthophosphate, preferably as H2PO4– or HPO42-. Phosphorus uptake is an active process and algae are capable of assimilating excess phosphorus and storing it within the cells in the form of polyphosphate granules (Larsdotter 2006). Therefore, under externally deficient conditions, algae consume internally stored phosphorus, grow quickly with less biomass, and decay quickly (Richmond 2004). This may be the reason why a significant D with pure green color was observed even at 0 mg L-1 TP concentration. The gradual increase in TP concentration of the growth media after the 18th day may be due to the release of phosphates from the dead microalgae back to the medium. In finding the relationship between microalgae growth variations and TP uptake, algal density increased until the 14th day, and decreased afterwards. This may be due to either the lack of available nutrients or another limiting factor after the 14th day.
The data revealed that as the initial nutrient (TN and TP) concentration increases, the specific growth rate decreases. This is consistent with the reported data and may be due to the overstimulation of growth of algae in the presence of excess nutrients, and algae’s ability to uptake available nutrients within a short period of time and decay quickly. However, as the nutrient concentration increases, algae spend more time on the lag phase, adapt to environmental conditions, and take a long time to reach its stationary phase (Ding et al. 2016).
Since nitrogen and phosphorus are the most essential elements for primary productivity, their ratios regulate the growth and biochemical composition of algae. Limiting nitrogen and phosphorus will enhance the carbon content of cells. Excess carbon accumulation may reduce nutrient utilization, and it directly affects macromolecule composition (Rasdi et al. 2015). The results revealed that the same TN:TP ratio with different initial nitrate and phosphate concentrations resulted in different growth indicating that not only the ratio but also the individual nutrient concentrations are important for microalgae growth. In the condition of nitrogen limitations (TN =100 mg L-1), algal density was very low. The lower carrying capacity than that at the optimum initial TN under the conditions of excess nitrogen (TN = 300 mg L-1), may be due to the nitrogen poisoning of algae when TN exceeds 200 mg L-1. The specific growth rate was the highest (0.4645 d-1) at the lowest initial nutrient concentrations.
In this study, it has been proven that both TN:TP ratio and their individual concentrations are equally important for microalgal growth. Results suggested that both D and K do not respond to its TN:TP ratio, under unfavorable nitrate concentrations (100 mg L-1 and 300 mg L-1) and phosphate concentrations (5 mg L-1 and 15 mg L-1). Under lower nitrate conditions (100 mgL-1), TN became the limiting factor and resulted in the lowest algal growth whereas under excess nitrate conditions (300 mgL-1), a comparatively lower microalgal growth could be observed , probably due to the nitrate poisoning.
Since phosphorus is the other important nutrient for algae growth, based on the assimilation, phosphorus can be easily removed from wastewater. According to the literature (Larsdotter 2006), phosphorus assimilation can be enhanced by increasing algal biomass. This property can be used to remove excess phosphorus from wastewater in tertiary treatment, and coupled with production of potentially valuable biomass (Larsdotter 2006).
Vanadomolybdophosphoric method was used for the analysis of phosphorus in the range of 1 to 20 ppm. Vanadomolybdate reagent forms a bright yellow complex with an uncertain formula [(NH4)3 PO4.NH4VO3.16MoO3] with orthophosphate. The λmax appears at 400 nm for this complex. Prior to the analysis, all phosphorus was converted into orthophosphate form as reported (Lipps WC 2018). A previous study has reported that nearly 75 – 90 % phosphate removal could be achieved by using microalgae (Sharma et al. 2013). As shown in Fig.8 and Table.5, both measured and calculated phosphate removal efficiencies are consistent with those reported values. In addition, the proposed mathematical model (Eq.11) has given some important parameters such as maximum specific consumption rate of these nutrients mainly for microalgae growth.
Since available microalgae biomass directly affects heavy metal ion uptake, algal density measurements were taken to identify the correlation between algal growth and heavy metal ion removal efficiencies. Algal biomass takes up more heavy metal ions at higher cell densities (Mehta et al. 2005). The algal density increased as pH increased and the highest K observed at pH 7 in the presence of both Cd2+ and Pb2+ ions. However, the maximum heavy metal ion removal was not obtained at pH 7. Heavy metal uptake pattern is consistent with the particular path of the growth pattern of microalgae, beginning with a lag phase, and continuing on to an exponential phase, a linear phase, and a stationary phase, and a decline of death phase. Heavy metal uptake increased slowly at the beginning of the growth, increased quickly in the exponential growth phase, became a constant, and started to decline, due to the death of microalgae.
Cd and Pb are non-essential elements and severely toxic even at low concentrations for microalgae (Fu et al. 2011). Therefore, prior to determining the heavy metal removal efficiencies, it is highly important to determine the maximum tolerable heavy metal ion concentration for living microalgae. That was achieved by obtaining algal density and K values (Fig.9 and Fig.10). Results of this study indicated that the maximum tolerable Pb2+ concentration (8 mg L-1) was higher than the maximum tolerable Cd2+ concentration (2.5 mg L-1) for living microalgae. This implies that Cd2+ ions are more toxic than Pb2+ions for macroalgae. Similar results were reported by Shanab S. et al. (2012).This may be the reason for comparatively low biomass production of microalgae when they grow in media containing Cd2+ ions, and is consistent with the literature reports (Volland et al. 2014) As the previous researchers have shown, this low biomass production may be related with cadmium’s ability to (i) inhibit the uptake of phosphorus and nitrate, growth and chlorophyll synthesis, (ii) displace essential Ca2+ ion channels in photosystem II from its binding hence, (iii) inhibit photoactivation and (iv) show strong interferes K+ and Ca2+ ions inside the cells.
Heavy metal ion uptake by microalgae is based on two processes: initial metabolically dependent process and subsequent metabolically independent process. Metabolically independent method is called the biosorption which is a relatively rapid, reversible, physicochemical phenomenon. Algae binds with metal ions in this method either by ionic or covalent interaction. Ion exchange and surface adsorption are the two processes involved there. Chojnacka et al. (2005), has reported that unicellular algae like Chlorella sp. have higher biosorption capacity than filamentous algae, due to high surface area/volume ratio. Functional groups (carboxyl groups, phosphate groups and hydroxyl and/or amine groups) present in algal cell walls are responsible for metal ion exchange and their biosorption performances at different pH levels. Among them, the carboxyl group (pKa 3-4.5) has the highest affinity for metal ions, due to their deprotonating capacity in a wide range of pH values. If pH value exceeds the pKa of functional groups, then active sites are mainly in dissociated form and the carbonyl group bound protons are exchanged with heavy metal ions in the solution. Some functional groups themselves are in dissociated form, and create negative charge on algal surfaces. Most common form is carboxyl ion (-COO–). Therefore, the algae surface is always anionic in nature and prone to high affinity for heavy metal cations (Chojnacka et al. 2005).
Metabolically dependent process is a kind of irreversible, active, and slow process compared to biosorption. Only living algae are capable of absorbing heavy metal ions, as the process requires energy. In this process, metal ions transport across the cell membrane into cytoplasm that may be mediated by the same mechanism used to convey metabolically essential ions such as Mg2+, Na+ and K+. The metal transport system may be confused by the presence of heavy metal ions with the same charge and ionic radius (Mehta et al. 2005). After the biosorption process, the surface bound heavy metal ions are then transported into cytoplasm through the diffusion barrier presented by the cell membrane (Ting et al. 1991). Heavy metal ion removal is dependent on the pH of the media, as it affects algae surface charge, degree of ionization and algae growth (Ghoneim et al. 2014)
Normally, living algae prefer neutral pH conditions for the maximum algal growth. Their growth has been suppressed under lower pH values (˂ pH 4) by altering their nutrient uptake. Therefore, as shown in Fig.11 and Fig.12, the highest K has been obtained at pH 7 while the lowest K has been obtained at pH 4 for both heavy metal ions. However, higher the pH values, higher the amount of heavy metal ion precipitation resulting in less availability of heavy metal ions. This may be attributed to the increase in OH– ions in the growth media, causing heavy metal ions to react with OH– ions and precipitate as metal hydroxides. Therefore, the highest heavy metal ion removal was not obtained at pH 7. Moreover, at lower pH values, H3O+ ions compete with the heavy metal ions for the exchange sites on algae surface making active sites not available for heavy metal ions (Benhimaa et al. 2008). Overall, the optimum heavy metal ion removal efficiency could be noticed at pH 5 and pH 6 for Pb2+ and Cd2+, respectively.
According to the measured results, Pb2+ removal efficiency (84 % at pH 5) of microalgae was higher than their Cd2+ removal efficiency (73 % at pH 6). This may be due to the toxicity and size differences between these two ions. Since the toxicity of Pb2+ is lower than that of Cd2+, the resulting higher algae biomass in algae grown in Pb2+ media would ultimately increase the ability of microalgae to remove more Pb2+ ions than Cd2+ ions. The other possible reason for the higher removal of Pb2+ over Cd2+ may be attributed to the smaller hydrated radius of Pb2+ ions. The steric hindrance created by a larger hydrated ionic radius of Cd2+ (2.75 °A) than that of Pb2+ (2.61 °A) may induce a quick saturation of adsorption sites by Cd2+ ions. Moreover, lower the hydrated ionic radius of Pb2+ ions , easier for them to penetrate the cell via cell plasma membrane and more efficient the Pb2+ ion uptake process (Benhimaa et al. 2008) than Cd2+ ion uptake process.
The proposed model for heavy metal ion uptake according to Eq.11 is shown in Fig 11 and Fig 12, and calculated parameters are tabulated in Table.6 and Table.7. According to the results, calculated maximum Pb2+ and Cd2+ ion removal efficiencies are 85.13% and 76.58%, respectively. These values are consistent with the experimental results. However, due to their death after a growth cycle, the accumulated heavy metal ions can be released back to the growth medium. Therefore, it is extremely important to harvest microalgae before their death phase.
If microalgae used for wastewater treatment has enough biomass for biodiesel production, it would be a quite interesting and cost-effective solution for future energy crises. Extensive work has been carried out to check algae lipid production under various conditions. According to the literature, Chlorella sp. is capable of producing 10 -50% lipid content from its dry biomass under the optimum nutrient conditions (Benhimaa et al. 2008). The amount of lipid extracted may vary based on the method of lipid extraction, silicon deficiency, nitrogen deprivation, temperature, heavy metal stress, pH of the growth media and iron(ш) content (Liu et al. 2008)
In this study, lipid extraction was done using a combination of chemical and physical methods. Sonication was done as a pre-treatment to disrupt cell membrane and release intracellular lipids to surrounding media before they were introduced into the solvent system. At the stationary phase, algae biomass was harvested and extractable lipid content (% dry weight biomass) was determined using gravimetric method. Hexane/ methanol solvent system was used to extract lipids. In there, polar lipids and remaining water were extracted into methanol and nonpolar lipids were extracted into a hexane layer. According to the results, the lowest dry algal biomass (0.2896 g L-1) as well as lipid content (0.1298 g L-1) were obtained in the presence of Cd2+ in the growth medium. However, by considering the lipid production percentage to the dry algal biomass, the highest (44.80%) was obtained in the presence of Cd2+. Some have reported that Cd2+ ions can competitively bind to photosystem II by replacing Ca2+ ions in photosystem I, due to the close similarities in the ionic radii of Ca2+ and Cd2+ (100 pm and 95 ppm, respectively). This, if it happens, would inhibit the photoactivation and the defense mechanism, but the exact mechanism of enhanced lipid production is still unclear. However, this may be related to the increased chlorophyll production in the presence of Cd2+ ions inducing increased lipid production, as reported (Jamers et al. 2013)
XRF results clearly show that cadmium and lead ions taken up by microalgae do not pass into extracted lipids. Yang. J.S. et al. also reported similar results indicating that heavy metals in extracted lipids are very low at microgram range as well as remaining heavy metal content in residual algal biomass after lipid extraction also very low (Yang et al. 2015). The reason for this may be due to the ability of heavy metal ions to dissolve easily in a more polar methanol layer during the lipid extraction. Therefore, it facilitates easy recovery of these ions by evaporating the solvent, and the remaining microalgae biomass collected into the nonpolar solvent, may be free from heavy metal ions, as reported (Shafik et al. 2008).
CONCLUSION
The study revealed that Chlorella sp. is capable of removing 77 % PO43- (from 10 mg L-1), 84 % Pb2+ (from 8 mg L-1) at pH 5, and 72.7% Cd2+ (from 2.5 mg L-1) at pH 6 from water contaminated with these ions. Those evidence suggest the possibility of using Chlorella sp. grown in wastewater for treating wastewater through bioremediation. The correlation between algal growth and TN:TP suggests that both TN:TP ratio and their individual initial concentrations are equally important for microalgal growth. The optimum TN and TP concentrations required for the maximum growth were found to be equal to 200 mg L-1 and 10 mg L-1 , respectively, with a TN/TP ratio of 20.In addition, it’s been clear that both algal density (D) and Carrying capacity (K) do not respond to its TN:TP ratio, under unfavorable nitrate concentrations (< 200mg L-1 and > 200 mg L-1) and phosphate concentrations (< 10 mg L-1 and >10 mg L-1). Under lower nitrate conditions than 200 mgL-1, TN became the limiting factor and resulted in the lowest algal growth whereas under higher nitrate conditions than 200 mgL-1, a comparatively lower microalgal growth could be observed, probably due to the nitrate poisoning.
The biomass yield of Chlorella sp. grown in the presence of Pb2+ , Cd2+ were 0.5551 g L-1, 0.2896 g L-1, respectively. Revealing algal growth retardation in the presence of these heavy metal ions, the biomass in the absence of these ions in the growth media was 0.8260 g L-1. However, the percentage oil content in terms of dry algae biomass were 37.64%, 44.80% and 40.69%, respectively for the Chlorella sp. grown in the presence of Pb2+ , Cd2+ ions, and in the absence of these ions in the growth media. The presence of these heavy metal ions in the oil extracted was negligibly less ( < 0.05%) implying that the heavy metal ions taken up from the growth medium by microalgae do not leach them back to the lipids extracted from them. Therefore, we can conclude that water contaminated with cadmium, lead and phosphate ions can be removed efficiently using Chlorella-based bioremediation and the oil extracted from such algal species could be used for producing biodiesel that is free from these ions. Though the biomass yield is low, Chlorella vulgaris is capable of growing in water polluted by these heavy metals and nutrients. Because atmospheric CO2 is also naturally consumed during the process of algal growth even under these conditions provided, microalgae used for the bioremediation would provide additional benefit in terms of mitigating environmental pollution caused by excessive emission of CO2 .
ACKNOWLEDGEMENTS
The authors are grateful to the Department Chemistry and the Postgraduate Institute of Science of University of Peradeniya for providing the necessary chemicals, equipment and the laboratory facilities. This research did not receive any specific grant from funding agencies in the public, commercial, or not-for-profit sectors.
DISCLOSURE STATEMENT
No potential conflict of interest was reported by the authors.
REFERENCES
- Benhimaa H, Chiban M , Sinan F, Seta P, M Persin (2008), Colloids and Surfaces B: Biointerfaces, vol.61(1),10-16. https://doi.org/10.1016/j.colsurfb.2007.06.024
- Chisti Y (2007) Biodiesel from microalgae. Biotechnology Advances 25:294-306.
- Chojnacka K, Chojnacki A, Gorecka H ( , 2005), Biosorption of Cr3+, Cd2+ and Cu2+ ions. kinetics, equilibrium and the mechanism of the process. Chemosphere 59 (1), 75-84.
- Demirbas A (2010) Use of algae as biofuel sources. Energy Conversion and Management 51:2738-2749. http://dx.doi.org/10.4236/epe.2014.69026
- Ding GT, Yaakob Z, Takriff MS, Salihon J, Rahaman MSA (2016) Biomass production and nutrients removal by a newly-isolated microalgal strain Chlamydomonas sp in palm oil mill effluent (POME). International Journal of Hydrogen Energy 41(8):4888-4895.
- Farooq U, Kozinski JA, Khan MA, Athar M (2010) Biosorption of heavy metal ions using wheat based biosorbents: a review of the recent literature. Bioresource Technology 101(14):5043-5053.
- Oswald WJ, Gotaas HB, Golueke CG, Kellen WR, Gloyna EF, Hermann ER (1957b) Algae in waste treatment. Sewage and Industrial Wastes 29:437–457.
- Felizardo P, Correia MJN, Raposo I, Mendes JF, Berkemeier R, Bordado JM (2006) Production of biodiesel from waste frying oils. Waste Management 26(5):487-494.
- Eaton AD, Clesceri LS, Rice EW, Greenberg AE (2005) Standard methods for the examination of water and wastewater, 21st ed. American Public Health Association, Washington DC.
- Floch J, Lees M, Stanley GHS (1957) A simple method for the isolation and purification of total lipids from animal tissues. Journal of Biological Chemistry 226:497-509.
- Fu F, Wang Q (2011) Removal of heavy metal ions from wastewater: a review. Journal of Environmental Management 92(3):407-418.
- Jamers A, Blust R, De Coen W, Griffin J L, & Jones O A H (2013) An omics based assessment of cadmium toxicity in the green alga Chlamydomonas Aquatic toxicology 126, 355-364.
- Kadirvelu K, Thamaraiselvi K, Namasivayam C (2001) Removal of heavy metals from industrial wastewater by adsorption onto activated carbon prepared from an agricultural solid waste. Bioresource Technology 76(1):63-65.
- Li M, Xiao X, Wang S, Zhang X, Li J, Pavlostathis SG, Luo X, Luo S, Zeng G (2020) Synergistic removal of cadmium and organic matter by a microalgae endophyte symbiotic system (MESS): an approach to improve the application potential of plant derived bios or bents. Environ Pollut 261:114177. https://doi.org/10.1016/j.envpol.2020.114177
- Lipps WC, Baxter TE (2018) Braun-Howland E Standard Methods for the Examination of Water and Wastewater. APHA Press, Washington DC. https://doi.org/10.2105/SMWW.2882.093. Accessed 19 Cot 2021
- Lichtenthaler H. K., and Wellburn A.R., (1983). Determination of total carotenoids and chlorophylls a and b of leaf in different solvents. Biol. Soc. Trans. 11: 591-592.
- Larsdotter K (2006) Microalgae for Phosphorus Removal from Wastewater in a Nordic Climate. Ph. D. thesis, Royal Institute of Technology, Stockholm, Sweden.
- Liu Z. Y., Wang G. C., & Zhou B. C. (2008) Effect of iron on growth and lipid accumulation in Chlorella vulgaris. Bioresource Technology, 99(11), 4717–4722.
- Mehta SK, Gaur JP (2005) Use of algae for removing heavy metal ions from wastewater: progress and prospects. Critical Reviews in Biotechnology 25(3):113-152.
- Mehta SK, Gaur JP (2005) Use of algae for removing heavy metal ions from wastewater: progress and prospects. Critical Reviews in Biotechnology 25(3):113-152. https://doi.org/10.1080/07388550500248571.
- Pittman JK, Dean AP, Osundeko O (2011) The potential of sustainable algal biofuel production using wastewater resources. Bioresource Technology 102:17-25.
- Rasdi NW, Qin JG (2015) Effect of N:P ratio on growth and chemical composition of Nannochloropsisoculata and Tisochrysis lutea. Journal of Applied Phycology 27:2221-2230.
- Ruiz-Marin A, Mendoza-Espinosa L, Stephenson T (2010) Growth and nutrient removal in free and immobilized green algae in batch and semi-continuous cultures treating real wastewater. Bioresource Technology 101:58-64.
- Richmond A (2004) Handbook of Microalgal Culture: Biotechnology and Applied Phycology. Blackwell Publishing, Oxford, pp 103-107.
- Sharma GK, Khan SA (2013) Bioremediation of sewage wastewater using selective algae for manure production. International Journal of Environmental Engineering and Management 4(6):573-580.
- Shanab S, Essa A Shalaby E (2012) Bioremoval capacity of three heavy metals by some microalgae species (Egyptian Isolates). Plant Signaling & Behavior 7(3):392-399.
- Shafik, M.A. (2008) Phytoremediation of some heavy metals by Dunaliellasalina. Global Journal of. Environmental Research, 2(1): 01-11. 12
- Safi C, Zebib B, Merah O, Pontalier P, Vaca-Garcia C (2014) Morphology, composition, production, processing and application of Chlorella vulgaris: a review. Renewable and Sustainable Energy Reviews 35:265-278.
- Singh A, Nigam PS, Murphy JD (2011) Renewable fuels from algae: an answer to debatable land based fuels. Bioresource Technology 102(1):10-16.
- Tien, C. J. (2002) Biosorption of metal ions by freshwater algae with different surface characteristics. Process Biochem., 38, 605-613.
- Ting YP, Lawson F, Prince IG. (1991) Uptake of Cadmium and Zinc by the Alga Chlorella-Vulgaris II. Multi-ion situation. Biotechnology and Bioengineering, 37(5):445–455.https://doi.org/10.1002/bit.260370506
- Volland S, Bayer E, Baumgartner V, Andosch A, Lütz C, Sima E, Lutz-Meindl U (2014) Rescue of heavy metal effects on cell physiology of the algal model system Micrasterias by divalent ions. Journal of Plant Physiology 171(2):154-163
- Xin L, Hu H, Gan Ke, Sun Y (2010) Effects of different nitrogen and phosphorus concentrations on the growth, nutrient uptake, and lipid accumulation of a freshwater microalga Scenedesmus sp. Bioresource Technology 101(14):5494-5500.Yanqun L. Horsman M. Wang B. Wu N. Lan C. Q. (2008) Effects of nitrogen sources on cell growth and lipid accumulation of green alga Neochlorisoleoabundans. Applied Microbiology and Biotechnology, 81(4), 629-636.
- Yang J, Rasa E, Tantayotai P, Scow KM, Yuan H, Hristova KR (2011) Mathematical model of Chlorella minutissima UTEX2341 growth and lipid production under photoheterotrophic fermentation conditions. Bioresource Technology 102(3):3077-3082.
- Yang, J., Cao, J., Xing, G., & Yuan, H. (2015) Lipid production combined with biosorption and bioaccumulation of cadmium, copper, manganese and zinc by oleaginous microalgae Chlorella minutissima UTEX2341, Bioresource Technology, vol.175, 537-544. https://doi.org/10.1016/j.biortech.2014.10.124