
Evaluating the Flood Control Measures and Resilience Employed by Communities Along the New Calabar River Catchment
- Nmehielle F.
- Ogoro M.
- Obafemi A. A.
- 289-302
- Oct 15, 2023
- Education
Evaluating the Flood Control Measures and Resilience Employed by Communities Along the New Calabar River Catchment
1Nmehielle F., ., 2Ogoro M. and 3Obafemi A. A.
1Center for Disaster Risk Management and Development Studies Faculty of Social Sciences University of Port Harcourt, Nigeria
2 & 3 Department of Geography and Environmental Management Faculty of Social Sciences University of Port Harcourt, Nigeria
DOI: https://doi.org/10.51244/IJRSI.2023.10927
Received: 25 August 2023; Revised: 05 September 2023; Accepted: 08 September 2023; Published: 16 October 2023
ABSTRACT
Floods are one of the most frequent and dangerous natural disasters, affecting human lives and resulting in significant economic damage throughout the world. It is known that future flood threats won’t go away, and the start of climate change will increase flood strength and frequency, endangering many parts of the world. It is the most commonly recorded catastrophe in the world continues to result in the susceptibility and adaptability of New Calabar Riverbank towns to floods, inundation, and erosion, which has had a persistent impact on the morphology of riverbanks and villages. These alterations, particularly in the New Calabar River, can be linked to the influence of the river’s human and natural influences. This has also prompted communities along the new Calabar Rivers banks to experience unstable environmental circumstances. As a result, this study assessed how well these communities have adapted to floods, inundation, and erosion. The Time-Series/Longitudinal study design was chosen as the methodology for this investigation. The Taro Yamanne formula was employed for the studies in deriving the sample size which was 400. Findings revealed that community-driven solutions were the last options in the mitigation of floods especially in the use of early warning systems. Therefore, the study suggests that institutional frameworks be implemented to improve resilience and catastrophe risk reduction.
Keywords: Adaption, Inundation, Flood, Susceptibility, Environmental
INTRODUCTION
Di Baldassarre et al. (2010) observed that a number of factors have contributed to a rise in the frequency of severe floods over the past several decades. Despite this, very little efforts were put in place to mitigate such impact hence, most flood affected parties still possess low flood forecasting capacity.. Floods affect all aspects of society, but the poor and marginalised are typically the most at risk since they have few safeguards against natural catastrophes, especially in developing countries where agriculture is the primary source of income (Chan and Parker, 1996). People may encounter the same kinds of dangers, but due to differences in exposure, sensitivity, and adaptation capability, they may be more or less vulnerable. Disasters not only disturb the poor’s way of life, but also cause them to suffer significant losses that may take some time to recover from. The majority of farmers in Sub-Saharan Africa Relies primarily on rain-fed agriculture and have no ability to reduce, adapt to, or deal with the consequences of extreme climatic events like floods, which severely hamper productivity. Smallholder farmers are particularly vulnerable to climatic extremes like floods, according to studies by Adhikari et al. (2014), Elum et al. (2016), and Hertel and Rosch (2010). This is because they are typically the least prepared for disaster, reside in the most vulnerable areas, and have few resources to help lower their level of risk.
Many people reside in flood-prone locations in the major cities of low-altitude nations (Hardoy et al., 2001). For instance, according to McGranahan et al. (2007), 10% of the world’s population and 13% of its urban population reside in low-elevation nations. Human settlements are susceptible to the impacts of climate change, according to IPCC (2001). Human settlements are impacted by climate change in a number of ways, including the economy, infrastructure, and public health. The most immediate dangers to human populations in coastal regions come from flooding brought on by sea level rise and storm surges. When they occur in metropolitan areas with poor drainage infrastructure and little adaptive ability, floods might be a major concern. Reducing climate change vulnerabilities is a pressing issue today, especially in low- and middle-income nations. In order to respond to actual and anticipated changes brought on by climate change, a system, people, and communities must adapt to the changing environment (McCharthy, 2001; Adger, et al., 2007). The first goal in many low- and middle-income nations in response to the effects of climate change is adaptation. Adger, et al. (2007) claim that adaptation entails altering social and environmental processes, how people perceive climate risk, as well as practises and functions, in order to lessen possible harm or take advantage of new possibilities.
Study Area
The research area is the New Calabar River, which flows through five local government areas in Rivers State, Nigeria: Obio Akpor, Emuoha, Asari-Toru, Degema, and Bonny. Along the way, it passes through the communities of Choba, Rumuparali, Emuoha, Ozuoba, and Rumulumini. The river runs between longitudes 60 50’ 00’’ E to 70 30’ 00’’ E at the beginning to latitudes 40 45’ 00’’ N to 50 00’ 00’’ N.
Relief and Drainage
All drainage channels in the studied region empty into the Atlantic Ocean, and the lowland areas are typically less than 30 metres above sea level in height (Oyegun et al., 1999). Alluvial sedimentary basin and foundation complex rocks make up its geology (Oyegun et al., 1999).
Soil
The soils in the area have several types of surface layers that are layered on top of substantial tertiary sandy and clayey soil deposits that, in some areas, are over 100 metres thick (Oyegun et al., 1999). The region temperature is unusually high from 640F to 900F and rains promote significant chemical weathering of rocks, which produces clay minerals that are common in the area (Oyegun et al., 1999).
Climate
According to Oyegun et al. (1999), the climate of this area is influenced by its location within the humid tropics with average monthly rainfall and humidity of 191.1mm and 69.08% respectively due to its proximity to the Atlantic Ocean, and the predominant tropical maritime air mass that blows over the area for the majority of the year. The climate of Rivers State is humid, with extended rainy seasons, significant rainfall, and a brief dry season. The wettest months in this region are July and September, whereas December and January, which is the harmattan season, are the driest. Similarly, the region’s weather indicates that temperatures are largely stable throughout the year, with a mean annual temperature of 280°C and an annual range of 3.80°C, and a humidity level of 85% (Oyegun et al., 1999).
Vegetation
The vegetation in the study region mostly consists of raffia palms and varies from a light rain forest to a deep mangrove forest. About 20–30 miles of saline water, as well as a network of rivers and streams, connect Rivers State to the ocean. There are woodlands throughout the city in addition to the mangrove forest that is typical around rivers and streams (Oyegun et al., 1999).
Population
According to the 1991 census, there were 756, 741 thousand people living in the studied LGAs (NPC, census data 1991). 1,347,644 people were counted in the population as of 2006 (NPC, census data from 1991).
Economic Activities
One of the principal hubs of the Nigerian economy and a significant city in the Niger Delta is Obio/Akpor. The city is home to several international corporations, many of which use petrochemicals in the creation and processing of their goods, which contributes to a portion of the state’s economy. However, there are more sources in the state, including those related to agro-based enterprises, education, medicine, engineering, and law.
Businesses that provide oil services, breweries, textile factories, hotels, and other commercial enterprises like merchants and hawkers are among the region’s economic activities. Farming, which includes the production of local products such plantains, cassava, and bananas, is the main economic activity of Emohua. Due to the abundance of seafood in the region’s rivers and tributaries, fishing is another well-liked pastime. The residents of Emohua also make boats and weave fishing nets as other businesses. A small number of community people work in the public sector, while others trade at the area’s several marketplaces, including the Emohua International Market (Oyegun et al., 1999).
The majority of Okrika people are fisherman, while the others make palm oil, make local salt, farm, and fish. The majority of the women also participate in small-scale commerce to supplement their income. Therefore, trading activities are more prevalent in the studied regions, notably in Port Harrcourt’s urban centres where there are many marketplaces to be seen, whereas small trading is more prevalent in the rural areas (Oyegun et al., 1999). Federal Government of Nigeria (FGN) (2007) states that refined petroleum products are Okrika’s sole notable exports. Produce handling and transportation across the New Calabar River has an impact on the river’s banks because of these economic activities.
Livelihood, Employment and Occupation
The residents in the research region work as crop farmers, fisherman, and other wage-earning jobs. All age groups and sexes in the research region predominantly engage in these jobs.

Figure 1 Map of Study Area Showing Communities
Source: Digitized from Google map, 2015.
RESULTS AND DISCUSSION
Bio data of respondents
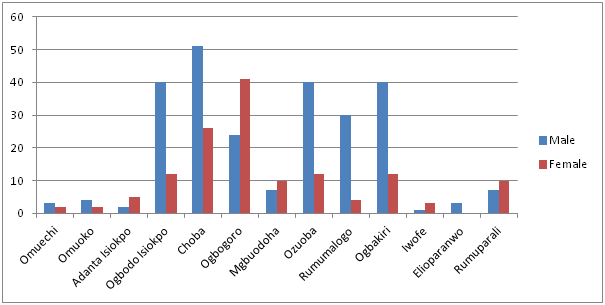
Figure 2: Sex of respondents
The figure 2 shows more male population of respondents in Choba , Isiokpo, Ogbodo Isiokpo, Ozuoba and Rumualogu and fewer female population in these mentioned places whereas, there is more female population in Ogbogoro, Rumuoparali and Adanta and fewer male population.
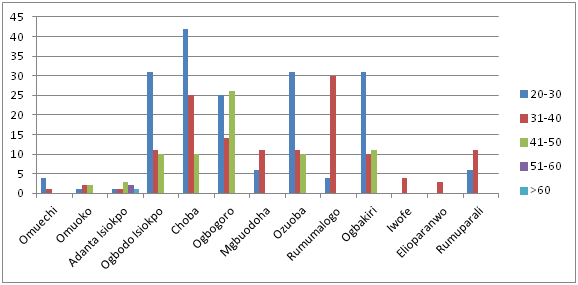
Figure 3 Age Category of respondents
The graph in figure 3 highlights the highest numbers of respondents are between the ages of 20-30 as seen in Choba, Ogbodo Isiokpo, Ozuoba and Isiokpo, with ages 31-40 following as seen in Rumualogu, Rumuoparali, Iwofe and Elioparanwo. The next ages following are from 41-50 with ages 51-60 following behind, the age with the minimum numbers of respondents is the age 60.
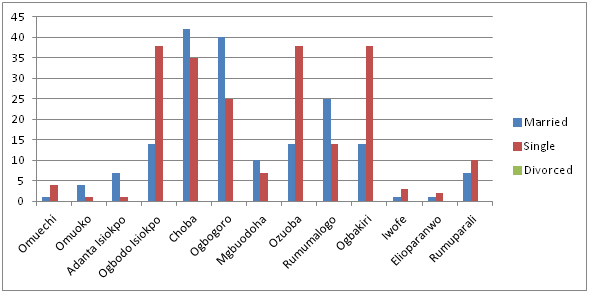
Figure 4 Marital Status of respondents
The figure 4 displays the marital status of respondents and reveals that there are more married people in Choba, Ogbogoro, Rumualogu, Rumuorlumeni, Adanta, and Omuoko while there are more single respondents in Ogbodo Isiokpo, Ozuoba, Isiokpo, omuiwhechi, Iwofe and Elioparanwo.
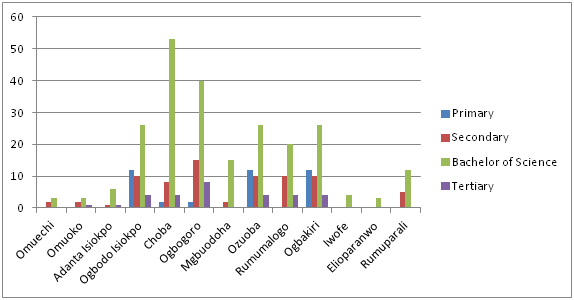
Figure 5 Educational qualifications of respondents
The chart in figure 5 is a representation of the educational qualifications of respondents which shows a majority people with Bachelor of Science qualifications across all the communities followed by Primary education qualifications in only Isiokpo and Ozuoba while the rest of the communities have more respondents who have Secondary educational qualifications leaving Post Graduate educational qualifications as the least amount of educational qualifications found in all the communities.
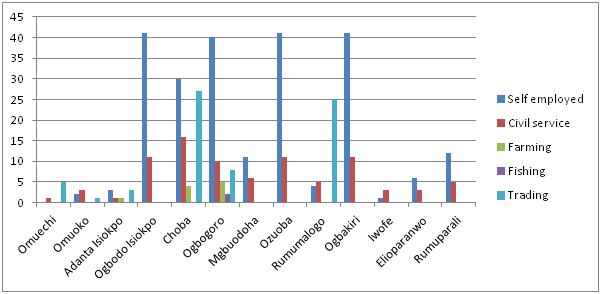
Figure 6 Occupations of Respondents
The chart in figure 6 represents the occupation of the respondents in the communities displaying that in all the communities there are more self-employed people in all the communities than other occupations, this means that respondents are majorly into businesses. This comes after trading which is likewise classified under self employed followed by people with Civil Service occupation before farming occupation and fishing as the least occupation being practiced in these communities.
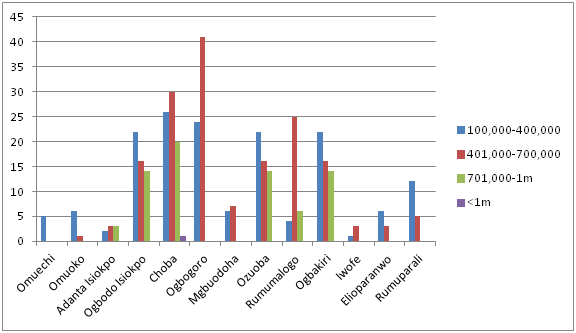
Figure 7 Income of respondents
From the chart in figure 7, it shows that the peak income is between 401-700 thousand in Ogbogoro, Choba, Iwofe and Rumualogu followed by 100-400 thousand in Omuiwhechi, Omuoko, Rumuoparali, Eliparanwo, Isiokpo, Ozuoba, and Ogbodo Isiokpo. The next income level which follows is from 701-1million while the least level of income is from 1million and above.
Flood control measures and resilience of communities along the New Calabar river catchment.
Table 1: Adequacy of Drainage
| Frequency | Percent | |
| Yes | 204 | 51.0 |
| No | 196 | 49.0 |
| Total | 400 | 100.0 |
The table 1 shows the response of respondents on the availability of drainages in their areas. 51% had drainages around their homes and 49% had no drainages, therefore, majority of the respondents had drainages around their homes.
Table 2: Frequency of Drainage Maintenance
| Frequency | Percent | |
| very often | 106 | 26.5 |
| rarely | 155 | 38.8 |
| never | 139 | 34.8 |
| Total | 400 | 100.0 |
The table 2 shows the response of respondents on how often they clean their drainages. 26% said they cleaned it very often, 38% cleaned their drainages rarely, 34% never cleaned their drainages, and therefore, the drainages were rarely cleaned.
Table 3 Availability of Flood control Measures
| Frequency | Percent | |
| Yes | 115 | 28.8 |
| No | 285 | 71.3 |
| Total | 400 | 100.0 |
The table 3 above shows the response of respondents on the availability of government’s flood control measures in their areas. 28 agreed that there were government flood control measures in their area while 71% said there were no government flood control measures in their areas. Therefore, in majority of the areas there was no government flood control measure.
Table 4 Flood control measures adopted
| Frequency | Percent | |
| chanelling of streams | 25 | 6.3 |
| creation of drainage network | 63 | 15.8 |
| desilting of drainage network | 14 | 3.5 |
| None | 6 | 1.5 |
| Total | 108 | 27.0 |
The table 4 above shows the government flood control measures in the studied areas. The result shows that the major flood control measures put in place is the creation of drainage network.
Table 5 Most relevant flood control measures
| Frequency | Percent | |
| creation of drainage system | 170 | 42.5 |
| raised foundations | 14 | 3.5 |
| sand bags to keep flood away | 21 | 5.3 |
| proper land use planning | 75 | 18.8 |
| Others | 114 | 28.5 |
| Total | 394 | 98.5 |
| Total | 400 | 100.0 |
The table 5 above shows the response of respondents on the most important measure to reduce flooding. The result shows that the most important measure to reduce flood hazards in the studied areas is the creation of drainage system.
Table 6 relevance of early warning system in flood detection
| Frequency | Percent | |
| Very relevant | 160 | 40.0 |
| Not relevant | 240 | 60.0 |
| Total | 400 | 100.0 |
The table 6 shows the responses of respondents on whether they used early warning signals to deduce flood hazards, the result shows that 40% used early warning signals while 60% do not use early warning signals to deduce flood hazards. Therefore, majority of the respondents did not use early warning signals to deduce impending floods.
Table 7 Flood early warning sources
| Frequency | Percent | |
| Rstv | 39 | 9.8 |
| Social media | 40 | 10.0 |
| Cool fm | 14 | 3.5 |
| Wazobia | 73 | 18.3 |
| NTA | 7 | 1.8 |
| Channels | 18 | 4.5 |
| Total | 191 | 47.8 |
The table 7 shows the media outlet through which respondents got the early warning signals for floods. 20% got their signal from Rstv, another 20% from social media, 7% from Cool Fm, 38% from Wazobia Fm, 3% from NTA and 9% from Channels TV. Therefore majority of the respondents got flood early warnings from Wazobia FM.
Table 8 Availability of flood relief programme in communities
| Frequency | Percent | |
| Yes | 180 | 45.0 |
| No | 220 | 55.0 |
| Total | 400 | 100.0 |
The table 8 shows the response of respondents to the availability of flood relief programs for victims of floods so as to enable them cope with the effects of flooding. 45% responded that there were no relief programs while 55% responded that there were relief programs. Therefore, most communities do not have relief programs for victims of floods.
Table 9 Building development are directed away from flood prone areas
| Frequency | Percent | |
| Strongly agree | 97 | 24.3 |
| Agree | 66 | 16.5 |
| Disagree | 191 | 47.8 |
| strongly disagree | 25 | 6.3 |
| undecided | 21 | 5.3 |
| Total | 400 | 100.0 |
The table 9 above shows the response of respondents on whether buildings are planned so as they are directed from flood prone areas as a strategy for adaptation to flooding. The result showed that 24% strongly agreed that buildings are planned such that they are directed away from flood prone areas, 16% agreed, 47% disagreed, 6.3% strongly disagreed and 5.3% were undecided. Therefore buildings are not planned so as they are directed from flood prone areas.
Table 10 Drainages have capacity to evacuate water adequately
| Frequency | Percent | |
| strongly agree | 51 | 12.8 |
| agree | 147 | 36.8 |
| disagree | 171 | 42.8 |
| strongly disagree | 31 | 7.8 |
| Total | 400 | 100.0 |
The table 10 shows the response of respondents to whether drainages are built in environmentally friendly ways to mitigate the impact of floods. 12% strongly agreed that buildings are built in environmentally friendly ways, 36% agreed, 42% disagreed, and 7.8% strongly disagreed, therefore, majority of the drainages were not built in environmentally friendly ways to mitigate the impact of flooding.
Table 11 Flood buffer are built in neighbourhood
| Frequency | Percent | |
| agree | 81 | 20.3 |
| disagree | 113 | 28.3 |
| strongly disagree | 192 | 48.0 |
| undecided | 14 | 3.5 |
| Total | 400 | 100.0 |
The table 11 shows the response of respondents to whether flood buffers are used in their area. The result shows that 20% agreed that flood buffers are used, 28% disagreed, 48% strongly disagreed and 3% were undecided. Therefore for majority of the areas, flood buffers are not used.
Table 12 Flooding result in the relocation of some residents
| Frequency | Percent | |
| strongly agree | 264 | 66.0 |
| agree | 81 | 20.3 |
| disagree | 28 | 7.0 |
| strongly disagree | 6 | 1.5 |
| undecided | 21 | 5.3 |
| Total | 400 | 100.0 |
The table 12 shows the response of respondents to whether those who can’t adapt to flooding vacate their homes. The result showed that 66% strongly agreed, 20% agreed, 7% disagreed, 1% strongly disagreed and 5% were undecided. Therefore the residents who could not adapt to flooding vacated their homes temporarily.
Table 13 Community members are sensitized on flood management
| Frequency | Percent | |
| strongly agree | 105 | 26.3 |
| agree | 94 | 23.5 |
| disagree | 65 | 16.3 |
| strongly disagree | 78 | 19.5 |
| undecided | 58 | 14.5 |
| Total | 400 | 100.0 |
The table 13 shows the response of respondents on whether there is sensitization of community members on flood preparedness, response and recovery measures. The result showed that 26% strongly agreed that there were sensitization, 23% agreed, 16% disagreed, 19% strongly disagreed and 14 were undecided. Therefore there was sensitization of community members on flood preparedness, response and recovery.
Table 14 The sensitization resulted flood adaptation among residents
| Frequency | Percent | |
| strongly agree | 91 | 22.8 |
| agree | 108 | 27.0 |
| disagree | 66 | 16.5 |
| strongly disagree | 71 | 17.8 |
| undecided | 64 | 16.0 |
| Total | 400 | 100.0 |
The table 14 shows the response of respondents on whether the sensitization led to high adaptation to flood among the residents. The result showed that 22% agreed that the sensitization led to better flood adaptation among the residents, 27% agreed, 16% disagreed, 17% strongly disagreed, 16% were undecided. Therefore, the sensitization has led to better flood adaptation among the residents.
CONCLUSION
From the analysis, there are more male population of respondents in Choba , Isiokpo, Ogbodo Isiokpo, Ozuoba and Rumualogu and fewer female population in these mentioned places also, there is more female population in Ogbogoro, Rumuoparali and Adanta and fewer male population. The graph analysis of age brackets highlights that the highest numbers of respondents are between the ages of 20-30 as seen in Choba, Ogbodo Isiokpo, Ozuoba and Isiokpo, with ages 31-40 following as seen in Rumualogu, Rumuoparali, Iwofe and Elioparanwo.
The next ages bracket are 41-50 with ages 51-60 following behind, the age with the minimum numbers of respondents is the age 60. The marital status of respondents and reveals that there are more married people in Choba, Ogbogoro, Rumualogu, Rumuorlumeni, Adanta, and Omuoko while there are more single respondents in Ogbodo Isiokpo, Ozuoba, Isiokpo, omuiwhechi, Iwofe and Elioparanwo. From the analysis of the sample representation, it’s obvious that the majority of the respondents educational qualifications were Bachelor of Science qualifications across all the communities followed by Primary certificate majorly in Isiokpo and Ozuoba while the rest of the communities have more respondents who have Secondary educational qualifications leaving Post Graduate educational qualifications as the least level of educational attainment found in all the communities. Therefore the occupation of the respondents as displayed that showed more self employed people in all the communities than other occupations, this means that respondents are majorly into businesses. This trend created a peak income of 401-700 thousand in Ogbogoro, Choba, Iwofe and Rumualogu followed by 100-400 thousand in Omuiwhechi, Omuoko, Rumuoparali, Eliparanwo, Isiokpo, Ozuoba, and Ogbodo Isiokpo. The next income level which follows is from 701-1million while the least level of income is from 1million and above. Responses on the availability of government’s flood control measures in their areas revealed that there were no government flood control measures in place in their areas. Respondents therefore employed other measure to reduce flood hazards in the studied areas which includes the creation of drainage system, early warning signals to deduce flood hazards, flood relief programs for victims of floods so as to enable them cope with the effects of flooding planned building in places that are not flood prone. Though, the majority of the drainages were not built in environmentally friendly ways to mitigate the impact of flooding which has resulted in increased flood occurrence. From the result of the findings of this work, it is therefore recommended that The Government should build bank protection facilities within the areas of human habitation along the new Calabar Rivers. There should be development control implemented by the government through the Local Government Administration within the areas inhabited along the river bank. Drainages should be constructed to direct water run-off to avoid flooding. Sand-mining or dredging should be discouraged by the river bank dwellers.
REFERENCES
- Adhikari K., Hartemink A. E., Minasny B., Bou Kheir R., Greve M. B., Greve MB, Greve MH (2014) Digital Mapping of Soil Organic Carbon Contents and Stocks in Denmark. PloS ONE 9(8)
- Aher, P. S. Bairagi, I. S. Deshmukh, P. P. Gaikwad, D. R. (2012) River Change Detection and Bank Erosion Identification using Topographical and Remote Sensing Data. International Journal of Applied Information Systems (IJAIS) – ISSN : 2249-0868 Foundation of Computer Science FCS, New York, USA Volume 2– No.3, www.ijais.org
- Ahmed, M. H. (2002). Multi-Temporal Conflict of the Nile Delta Coastal Changes, Egypt.
- Anderson, G. L. (1996). The Application of Spatial Technologies for Rangeland Research andManagement: State of the ART. Geocarto 11(3)
- Andrea, S. L., Douglas, E. J., Norman, R. H. and Grant, M. C. (2001). Stream ChangeAnalysis using Remote Sensing and Geographic Information Systems (GIS). J. Range Manage, 54
- Batalla, R.J., C.M. Gomez, G.M. Kondolf (2004) Reservoir-induced hydrological changes in the Ebro River basin (NE Spain) J. Hydrol., 290 (1)
- Bapalu, G. V., and Sinha, R., 2005. GIS in Flood Hazard Mapping: A Case Study of Kosi River Basin, India. GIS Development Weekly, 1(13)
- Callander, R.A., 1978. River Meandering, Annual Review of Fluid Mechanics. 10 Campbell, J. B. (2002). Introduction to Remote Sensing. Third Edition, The Guilford Press, 72 Spring Street, New York, NY 10012, USA.
- Cambridge Isaac Boakery (2010). Spatial Planning in Coastal Region. Facing the Impact of Climate Change International Federation of Surveyors, Denmark.
- Chan and Parker, (1996) Response to dynamic flood hazard factors in peninsular Malaysia. The Geographical Journal Volume 162, number 3
- Chava, F., David N. (2009) Research Methods inthe Social Sciences, Fifth Edition, Hodder Educational, London
- Coburn, (1994). Vulnerability and Risk Assessment, Disaster Management Training Programme module, United Nations Development Programme, Cambridge, United Kingdom
- David, V. S. (2008). Multi-Temporal Change Detection Analysis of Beach Erosion Using Satellite Remote Sensing. American Meteorological Society, ref. no. 360-027-80045. Beacon Street Boston, MA 02108- 3693, USA.
- Di Baldassarre, G., Montanari A., Lins H., Koutsoyiannis D., Brandimarte L., Bloschi G., (2010) Flood fatalities in Africa: From diagnosis to mitigation. Geophysical Research Letters Volume 37, issue 22
- Duan M., Zhang J., Liu Z., and Aekakkararungroj (2009) Use of Remote Sensing and GIS for Flood Hazard Mapping in Chiang Mai Province, Northern Thailand, Chinese Academy of Surveying and Mapping, Beijing, China
- Elum Z. A., Modise D. M., & Nhamo G. ( 2016) Climate Change Mitigation: the Potential of Agriculture as a Renewable Energy Source in Nigeria http://doi.org/10.1007/s11356-016-8187-7
- Eastman, J. R. and McKendry, J. E. (1991). Change and time series analysis, Explorations in Geographic Information Systems Technology. Vol. 1, United Nations, Institute for Training and Research, Geneva, Switzerland
- Ebisemiju F. S. (1987). An Evaluation of factors controlling present rate of shoreline retrogradation in the Western Niger Delta Nigeria, catena, Volume 14 Issue 1-3.
- FGN. (2007). Niger Delta Regional Development Master Plan Abuja.
- Gates, D. M., 1980. Biophysical Ecology, Springer-Verlag, New York, 611
- Gilvear, D.J., Winterbottom, S.J. and Sichingbula, H. (1999). Character of meander planform change on the Luangwa River, Zambia. Earth Surface Processes and Landforms 16
- Goel, M. K., Jain, S. K. and Agarwal, P. K. (2002). Assessment of Sediment Deposition Rate in Bargi Reservoir Using Digital Image Processing. Hydrological Sciences-Journal-des Sciences Hydrologiques, 47(S)
- Gornitz, V. M. (1990). Vulnerability of the East Coast, USA to Furture Sea Level Rise, Journal of Coastal Research, Special Issue
- Harrilik R. M (1980) A spatial Data Structure for Geographic Information System. Academic Press Inc, New York
- Hertel W. Hertel and Rosch S. D., (2010) Climate Change, Agriculture, and Poverty. Applied Economic Perspectives and Policy (2010) volume 32, number 3, doi:10.1093/aepp/ppq016
- Hassan, M. F., Ahmed, A. S., Imad-eldin, A. A. and Shinobu, I. (1999). Use of Remote Sensing to Map Gully Erosion along the Atbara River, Sudan. International Journal of Applied Earth Observation and Geoinformation, JAG, vol. 1, Issue ¾
- Hickin E. J., (2003). Meandering Channels. In Middleton, Gerard V. Encyclopedia of Sediments and Sedimentary Rocks. New York: Springer
- Hodgson, M.E., Jensen J.R., Tullis J.A., Riordan, K.D. & Archer C.M., 2003. ”Synergistic Use of LIDAR and Color Aerial Photography for Mapping Urban Parcel Imperviousness,” Photogrammetric Engineering & Remote Sensing, 69(9)
- Holbrook, J. & Alexandrowicz, N., 2011. Rethinking the classic oxbow filling model: Some hope for improved reservoir connectivity: American Association of Petroleum Geologists http://woodshole.er.usgs.gov/epubs/openfiles/ofr99-593
- IPCC (2001). Third Assessment Report – Climate Change 2001 vols 3. Intergovernmental Pannel on Climate Change. Cambridge University, Press
- Jensen, J. R., (2004). Introductory Digital Image Processing: A Remote Sensing Perspective.
- Jensen, R. J. (2005). Introductory Digital Image Processing: A Remote sensing Perspective, 3rd Edition. New York: Prentice-Hall, Inc.
- Kelarestaghi, A., Ahmadi, H., Jafari, M. and Tohmoures, M. (2007). Land Use Changes Detection and Spatial Distribution Using Digital and Satellite Data, Case Study: Farim 57 Drainage Basin, Northern of Iran. Department of Range and Watershed Management, Faculty of Natural Resources, College of Agriculture and Natural Resources, University of Tehran, Iran.
- Knighton, D., (1998). Fluvial Forms & Processes: A new Perspective. 383.
- Kolehmainen, K. (2008). Monitoring and Analysis of Urban Land Cover Changes over Stockholm Region between 1986 and 2004 using Remote Sensing and Spatial Metrics. Department of Urban Planning and Environment, Royal Institute of Technology, Stockholm, Sweden, TRITA- GIT EX 08-011
- Lagasse, P.F., Spitz, W.J.& Zevenbergen L.W., (2004). Handbook for Predicting Stream Meander Migration. National Cooperative Highway Research Programm Report 533, Washington DC.
- Lagasse, P.F., Spitz, W.J.& Zevenbergen L.W., (2004). Handbook for Predicting Stream Meander Migration. National Cooperative Highway Research Programm Report 533, Washington DC.
- Laliberte, A. S., Johnson, D. E., Harris, N. R. and Casady, G. M. (2001). Stream Change Analysis Using Remote Sensing and Geographic Information Systems (GIS). Journal of Range Management, 54
- Lillesand, T. M. and Kiefer, R. W. (2004). Remote Sensing and Image Interpretation. Third Edition, John Wiley & Sons, Inc., New York, USA.
- Lillesand, T. M., Kiefer, R. W. and Chipman, J. W. (2008). Remote Sensing and Image Interpretation. Sixth Edition, John Wiley & Sons, Inc., New York, USA
- Littoral 2002, The Changing Coast. EUROCOAST/EUCC, Porto – Portugal, ISBN: 972-8558-09-0.
- Liu, Y., Nishiyama, S. and Yano, T (2004). Analysis of Four Change Detection Algorithms in Bi-Temporal Space with Case Study. International Journal of Remote Sensing, 25:11
- Martin, A.J., (2000). Flaser and wavy bedding in ephemeral streams: a modern and an ancient example, Sedimentary Geology, 136
- Mathew J. P. C. Michael D. B. Michael O (2005). Future Sea Level Rise and the New Jersey Coast. Assessing Potential Impacts and Opportunities. Science, Technology and Environmental Policy Program
- McKnight T. L (1992): Essentials of Physical Geography, Prentice – Hall, inc, New Jersey.
- Minakshi, K., (2005). Digital Image Processing. Photogrammetry and Remote Sensing Division, Indian Institute of Remote Sensing, Dehra Dun.
- Narumalani, S., Hlady, J.T., & Jensen, J.R., (2002). Information Extraction from Remotely Sensed Data, in Bossler J.D., Jensen J.R., McMaster R.B. & Rizos C. (Eds.), Manual of Geospatial Science and Technologie, New York: Taylor & Francis
- New Jersey Department of Environmental Protection (1981). New Jersey Shore Protection Master Plan, Department of Environmental Protection, Trenton.
- Ogba Okoro C. &Utang Pius B. (2008) Biophysical & the Socio – Economic vulnerability of the Niger Delta coast to effective sea level rise, Africa Journal of Contemporary Issues Vol 18, Cameroon
- Olorunlana, F. A. (2013). State of the Environment in the Niger Delta Area of Ondo State. Paper presented at the 1st Annual International Interdisciplinary Conference Proceeding.
- Onoja, M. O. (2012). Flood Monitoring in Port Harcourt Metropolis using Geographic Information System. 1st Bachelor of Science Degree, University of Port Harcourt, Port Harcourt.
- Oyegun C. U. and Adeyemo A. A. (1999) Port Harcourt Region Paragraphics, Port Harcourt
- Pratt C., Kaly U., Mitchell J (2004), How to Use the Environmental Vulnerability Index, UNEP/SOPAC South Pacific Applied Geo-science Commission, Technical Report 383, On line at: www.vulnerabilityindex.net/Files/ EVI%20Manual.pdf.
- Prince, C. M., & Aifesehi, P. E. E. (2013). Vulnerability and Resilience of Niger Delta Coastal Commuities to Flooding. IOSR Journal of Humanistic and Social Sciences, 10(6).
- Queensland Governmant (2006) http://www.nrw.qld.gov.au/
- Robert E. G. James F. P. Michael T L. Dorothy S. (2009) Physical Geography ninth edition Brooks/Cole cengage learning, USA
- Rouse, J.W., Haas, R.H., Schell, J.A., & D.W. Deering, (1973). Monitoring the vernal advancement and retrogradation (green wave effect) of natural vegetation. Prog. Extracting River Features from remotely sensed data: An evaluation of thematic correctness
- Saroglu, E., Yasa, F., Akcay, O., Abali, H. and Musaoglu, N. (2003). Coastal and erosion risk analysis using remote sensing and GIS: A case study in Sile and Agva towns. Department of Geodesy and Photogrammetry Engineering, Istanbul Technical University, 34469, Ayazaga, Istanbul, Turkey
- Schowengerdt, Robert A., 2007. Remote sensing: models and methods for image processing (3rd ed.). Academic Press, 2
- Shekhar, S., & Chawla, S. (2003). Spatial Databases a Tour. New Jersey: Prentice hall.
- Tardie P. S. and Congalton R. G. (2002) Change Detection Analysis Using Remotely Sensed Data to Assess the Progress of Development in Essex County. Proceedings of ACSM/ASPRS Annual Confrence. Retrieved from http://www.unh.edu/naturalresources/pdf/tardie-paper1.pdf.
- Thieler, E. R. and Hammer – Klose, E. S. (1999). National Assessment of Coastal Vulnerability to Future Sea Level Rise: Preliminary Result for the U> S> Atlantic Coast, U. S. Geological Survey Open-File Report
- Twumasi, Y. A. and Merem, E. C. (2006). GIS and Remote Sensing Applications in the Assessment of Change within a Coastal Environment in the Niger Delta Region of Nigeria. International Journal of Environmental Research and Public Health, 3(1), . ISSN: 1661-7827
- Uzukwu, P.U. T.G. Leton and N.A. Jamabo, (2014). Survey of the Physical Characteristics of the Upper Reach of the New Calaber River, Niger Delta, Nigeria. Trends in Applied Sciences Research, 9: 494-502.
DOI: 10.3923/tasr.2014.494.502
URL: https://scialert.net/abstract/?doi=tasr.2014.494.502 - Vanacker V, Molina A, Govers G, Poesen J, Dercon G, Deckers S. 2005. River channel response to short-term human-induced change in landscape connectivity in Andean ecosystems
- Viet, P. B., Nguyen, L. D. and Duan, H. D. (2002). Using remotely sensed data to detect changes of riverbank in Mekong River, Vietnam. Information and Remote Sensing Division, Institute of Physics, Hochiminh City, Vietnam.
- Vossen, G. (1991). Data Models, database Languages and Database management Systems. Wokingham, England: Addison – Wesley.
- Winter (2009) Institute for Work & Health, Toronto At Work, Issue 55.
- Yao, Z., J. Xiao, W. Ta, and X. Jia. 2013. “Planform Channel Dynamics along the Ningxia–Inner Mongolia Reaches of the Yellow River from 1958 to 2008: Analysis Using Landsat Images and Topographic Maps.” Environmental Earth Sciences 70 (1): 97–106. doi:10.1007/s12665-012- 2106-0
- Yaw, A. T., & Edmund, C. M. (2006). GIS and Remote Sensing Application in the Assessment of Change within a Coastal Environment in the Niger Delta region International Journal of Environmental Research and Public Health.
- Zhang, K. Bruce C., Stephen L,. (2004). Global Warming and Coastal Erosion Kluwer Academic Publication, Netherland.