
Evaluation of the Correlation Between Climate Change and The Most Reported Cases of Diseases Due to Climate Change in The Study Area Over the Period Of 11 Years (2010-2020) In Selected South-Western States (Ekiti, Osun and Ondo), Nigeria.
- Sam-Ijadele Kemi
- Oluwatuyi Mayowa
- Adeyemi Mojisola
- 844-854
- Apr 24, 2024
- Health And Cybersecurity
Evaluation of the Correlation Between Climate Change and the Most Reported Cases of Diseases Due to Climate Change in the Study Area Over the Period of 11 Years (2010-2020) in Selected South-Western States (Ekiti, Osun and Ondo), Nigeria.
Sam-Ijadele Kemi1, Oluwatuyi Mayowa2 & Adeyemi Mojisola3
1Department of Environmental Health
2Department of Health Information Management
3Ekiti State College of Health Sciences and Technology, Ijero
DOI: https://doi.org/10.51244/IJRSI.2024.1103056
Received: 07 March 2024; Accepted: 26 March 2024; Published: 24 April 2024
ABSTRACT
Climate change, acting via less direct mechanisms, would affect the transmission of many infectious diseases (especially water, food and vector-borne diseases). The aim of this study is to evaluate the correlation between climate change and emerging and re-emerging diseases in selected south-west states (Ekiti, Osun and Ondo) Nigeria. This study covered the entire population of three south western states (Ekiti, Osun and Ondo) and relied more on secondary data from the Health records department (Data Bank) from the Federal Ministries of Health with additional data from NIMET (weather data or reports). Selection of health care facilities in each of the three states, health data indicating disease distribution and records from 2010 -2020 alongside climate data from Ekiti, Osun and Ondo State. An integrated approach using correlation study was employed in assessing the effect of climate change in particular reference to emerging and re-emerging disease in the study areas. Findings revealed that the higher the temperature the higher the emergence of Measles and Chicken pox, but the lower the temperature the higher the emergence of influenza and Pneumonia. The emergence of Lassa Fever however does not depend on the climatic change either with high or low temperature in South-West, Nigeria. Hence it was concluded that there is correlation between climate change and emerging and re-emerging of diseases.
Keywords: Climate Change, Disease Distribution, Health Data
INTRODUCTION
According to Maiden et al., (2015) “Human alteration of Earth is substantial and growing. Between one-third and one half of the land surface has been transformed by human action; the carbon dioxide concentration in the atmosphere has increased by nearly 30% since the beginning of the Industrial Revolution; more atmospheric nitrogen is fixed by humanity than by all natural terrestrial sources combined; more than half of all accessible surface fresh water is put to use by humanity; and about one-quarter of the bird species on Earth have been driven to extinction. By these and other standards, it is clear that we live on a human-dominated planet.”(Janicot et al.,2011)
Shuman (2011) stated that there is now widespread consensus that the Earth is warming at a rate unprecedented during post hunter-gatherer human existence. The last decade (2000 – 2010) was the warmest since instrumental records began in the nineteenth century, and contained 9 of the 10 warmest years ever recorded. The causes of this change are increasingly well understood. The Third Assessment Report of the Intergovernmental Panel on Climate Change, published in 2001, goes further than its predecessors, stating that “There is new and stronger evidence that most of the warming observed over the last 50 years is likely to be attributable to human activities”, most importantly the release of greenhouse gases from fossil fuels.
There is growing realization that the sustainability of population health must be a central consideration in the public discourse on how human societies can make the transition to sustainable development (Davis et al., 2010). Hence, public, policymakers and other scientists have an increasing interest in hearing from population health researchers, moving towards a view of population health as an ecological entity: an index of the success of longer-term management of social and natural. (Mari et al., 2012). Indeed this recognition will assist in altering social and economic practices and priorities, to avert or minimize the occurrence of global environmental changes and their adverse impacts.
Change in world climate would influence the functioning of many ecosystems and the biological health of plants and creatures. Likewise, there would be health impacts on human populations, some of which would be beneficial. For example, milder winters would reduce the seasonal winter-time peak in deaths that occurs in temperate countries, while in currently hot regions a further increase in temperatures might reduce the viability of disease-transmitting mosquito populations (Alexander et al., 2013). All of these changes are inextricably linked to the health of human societies. Climatic conditions affect human well-being both directly, through the physical effects of climatic extremes, and indirectly, through influences on the levels of pollution in the air, on the agricultural, marine and freshwater systems that provide food and water, and on the vectors and pathogens that cause infectious diseases.
STATEMENT OF THE PROBLEM
The incidence of infectious disease has been dramatically reduced over the past century by increasingly sophisticated vaccines however new research found that:
- Climate change could again; potentially lead to a resurgence of some of the deadliest illnesses on earth (Abdulsalam, 2014).
- Climate in the future might become more suitable for malaria transmission in the tropical highland regions, as being modeled. Malaria is transmitted to humans by mosquitoes of the genus Anopheles, which are highly sensitive to climatic variations, generally requiring moist conditions, and a temperature of around 25-28 degrees centigrade to breed (Abeku, 2004).
- Scientists suspect that rising global temperatures could cause the range of Anopheles mosquitoes to expand, and thereby increase the spread of malaria to humans. One of the places most at risk could be Africa. The continent is already the world’s malaria hotspot, with 92 percent of the world’s malaria deaths occurring there, but a growing number of scientific studies are suggesting that climate change could make malaria matters even worse in Africa. Malaria is not the only mosquito-borne disease that risks being exacerbated by a changing climate. (Colwell, 2004; Michael et al., 2006; Mari et al., 2012).
- Studies have also found that climate variability increases the risk of dengue fever, and there are concerns that the same could be true for yellow fever, encephalitis, hantavirus and even ebola (Adedokun and Emofurieta, 2009)
- There are even signs that climate change could already be altering the distribution of some of these diseases. Recent studies have found that some mosquito-borne diseases, including malaria, dengue fever and yellow fever, as well as tick-borne diseases like Lyme disease and tick-borne encephalitis, have begun to spread to higher latitudes, possibly due to increased temperatures. (Akanda et al., 2009). The spread of insect-borne pathogens is serious enough, but it is not the only way that climate change could impact human diseases.
- Increased precipitation, another likely result of climate change, is believed to increase the spread of waterborne infections, which can cause deadly diarrheal illness and flourish in the wake of heavy rainfalls. (Collier et al., 2008). Other infectious diseases, such as salmonellosis, cholera and giardiasis, may show increased outbreaks due to flooding and elevated temperature (Forgor , 2007)
- Scientists are also concerned that the melting of permafrost soils in polar regions due to climate change could release ancient viruses and bacteria that may be capable of coming back to life (James, 2013)
Objectives Of The Study
The specific objectives are to:
- Determine the variation in climate change in the study area over the period of 11 years 2010-2020).
- Identify the most reported cases of diseases due to climate change in the study area over the period of 11 years (2010-2020).
Research Hypotheses
HO: There exists no significant relationship between climate change and emerging and re-emerging diseases.
H1: There exists a significant relationship between climate change and emerging and re-emerging diseases.
Southwest Nigeria is no doubt vulnerable to the impact of climate change and variability because of its physical and socioeconomic characteristics, such as heavy rainfall, ecological disruption, high population growth rate and extreme weather events. The selected states are Ekiti, Osun and Ondo who are known to report extreme weather condition after Lagos State.
METHODOLOGY
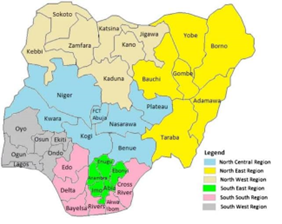
Figure 1 Map of Nigeria
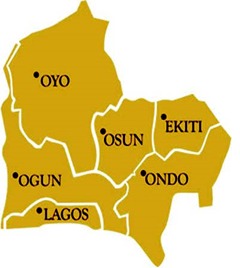
Figure 2 Map of southwest Nigeri
Scope Of The Study
This study is limited to Ekiti, Osun and Ondo State, South-Western, Nigeria.
Sample Size
This study covered the entire population of three south western states (Ekiti, Osun and Ondo). The population of Ondo State is 3,460,877 as at 2006 census. The population of Ekiti State stands at 2,384,212 as at 2006 census while Osun state population is 3,416,959. The total population covered is 9,262,048.
Data Collection Method
This study relied more on secondary data from the Health records department (Data Bank) from the Federal Ministries of Health with additional data from NIMET (weather data reports).
Selection of health care facilities in each of the three states, health data indicating disease distribution and records from 2010 -2020 alongside climate data from Ekiti, Osun and Ondo State were used.
An integrated approach using correlational study was employed in assessing the effect of climate change in particular reference to emerging and re-emerging disease in the study areas.
Statistical Analysis
With the data obtained from health care facilities and the climate data across the three study area, a correlation statistical analysis was done to find the commonalities of climate change on emerging and re-emerging disease.
RESULTS
Weather report from NIMET was obtained to show minimum temperature, Maximum Temperature and Rainfall. The study area are some selected south-west states( Ekiti, Osun and Ondo ) and as such, the data is relevant to the study.
Table 1: Maximum and minimum temperatures and rainfall variations averaged over the Ekiti State stations in south-west Nigeria for the period of 11 years (2010 – 2020).
| Year | Maximum Temperature(in Degree Celsius ) | Minimum Temperature(in Degree Celsius) | Rainfall(In millimeters) |
| 2010 | 35.2 | 24.2 | 1,228 |
| 2011 | 34.3 | 23.4 | 1,111 |
| 2012 | 31.8 | 19.2 | 1,000 |
| 2013 | 32.2 | 21.3 | 1,223 |
| 2014 | 34.1 | 24.4 | 891 |
| 2015 | 34.2 | 24.3 | 1,221 |
| 2016 | 36.2 | 19.6 | 1,245 |
| 2017 | 34.6 | 25.2 | 1,323 |
| 2018 | 37.3 | 23.4 | 1,409 |
| 2019 | 36.2 | 26.3 | 1,623 |
| 2020 | 35.2 | 26.8 | 1,532 |
Table 2: Maximum and minimum temperatures and rainfall variations averaged over the Ondo State stations in south-west Nigeria for the period of 11-years (2010 – 2020).
| Year | Maximum Temperature (in Degree centigrade) | Minimum Temperature (in Degree centigrade) | Rainfall (In millimeters) |
| 2010 | 32.2 | 22.1 | 1,301 |
| 2011 | 29.4 | 23.2 | 1,210 |
| 2012 | 34.6 | 23.6 | 1,101 |
| 2013 | 33.6 | 24.7 | 1,247 |
| 2014 | 34.4 | 20.7 | 932 |
| 2015 | 32.3 | 21.6 | 1,354 |
| 2016 | 35.6 | 20.4 | 1,266 |
| 2017 | 33.7 | 23.8 | 1,300 |
| 2018 | 36.2 | 22.3 | 1,399 |
| 2019 | 36.2 | 21.3 | 1,544 |
| 2020 | 35.2 | 22.6 | 1,500 |
Table 3: Maximum and minimum temperatures and rainfall variations averaged over the Osun State stations in south-west Nigeria for the period of 11-years (2010 – 2020).
| Year | Maximum Temperature (in Degree centigrade) | Minimum Temperature (in Degree centigrade) | Rainfall (In millimeters) |
| 2010 | 29.3 | 19.1 | 1,202 |
| 2011 | 30.1 | 20.2 | 1,200 |
| 2012 | 33.2 | 22.5 | 1,220 |
| 2013 | 36.4 | 21.4 | 1,207 |
| 2014 | 32.6 | 23.2 | 890 |
| 2015 | 32.4 | 20.3 | 1,211 |
| 2016 | 32.5 | 22.2 | 1,181 |
| 2017 | 34.3 | 22.6 | 1,214 |
| 2018 | 31.1 | 25.2 | 1,316 |
| 2019 | 32.7 | 22.1 | 1,216 |
| 2020 | 31.4 | 21.3 | 1,413 |
Table 4 Pooled Populations Of People Infected With Measles And Chicken Pox In The Study Area
| YEAR | MEASLES | CHICKEN POX |
| Dry Season Wet Season | Wet Season Dry Season | |
| 2010 | 2,356 958 | 546 1290 |
| 2011 | 2,458 764 | 725 2980 |
| 2012 | 2,654 632 | 937 3027 |
| 2013 | 2,301 1,003 | 536 2540 |
| 2014 | 2,367 708 | 463 2006 |
| 2015 | 2,424 832 | 756 2562 |
| 2016 | 2,309 534 | 423 1906 |
| 2017 | 2,355 730 | 290 1894 |
| 2018 | 2,734 791 | 203 1702 |
| 2019 | 2,844 827 | 278 1453 |
| 2020 | 2,578 521 | 301 1204 |
Table 5 Pooled Populations Of People Infected With Influenza And Lassa Fever In The Study Area
| Year | INFLUENZA | LASSA FEVER |
| Wet season Dry season | Wet Season Dry season | |
| 2010 | 5340 2034 | 6 7 |
| 2011 | 5329 1893 | 5 9 |
| 2012 | 6782 2182 | 7 8 |
| 2013 | 5302 983 | 4 6 |
| 2014 | 7392 2637 | 9 5 |
| 2016 | 5473 2216 | 2 5 |
| 2017 | 8673 1936 | 8 4 |
| 2018 | 5343 989 | 6 5 |
| 2019 | 6920 1290 | 5 7 |
| 2020 | 7821 1870 | 8 10 |
Table 6: Pooled Population Of People Infected With Pneumonia In The Study Area
| YEAR | PNEUMONIA |
| Wet Season Dry season | |
| 2010 | 4502 1004 |
| 2011 | 4201 932 |
| 2012 | 5232 873 |
| 2013 | 5301 739 |
| 2014 | 4802 846 |
| 2015 | 4902 786 |
| 2016 | 5032 874 |
| 2017 | 4823 850 |
| 2018 | 4702 893 |
| 2019 | 6032 1302 |
| 2020 | 7043 1542 |
Source: Federal Bureau of Statistics (FMOH) 2020.
DESCRIPTIVE STATISTICS
Research Question 1
What are the most reported cases of diseases in southwest Nigeria?
This question was answered using descriptive statistics and the result is presented in table 4 – 6 above.
The table revealed that Chicken pox with mean of 6428.82 cases is the leading disease emerging during dry season followed by Measles (2489.09), Pneumonia (967.36), Influenza (496.18), respectively. Pneumonia with a mean of 5142.91 cases is found to be the prevailing disease in the raining season followed by, Influenza, (2051.27) and Lassa Fever (6.00) respectively. It can be deduced from the table 6 below shows that Chicken Pox, Pneumonia and Measles are the most occurring and prevailing diseases considering the two seasons all together followed by others. Lassa Fever appears to be the least.
Table 7: Descriptive analysis of reported cases of diseases in southwest Nigeria
| Diseases | Seasons | N | Mean | Std. Deviation | ||
| Measles | Dry Season
Wet Season |
11
11 |
2489.09
754.18 |
185.649
153.870 |
||
| Influenza | Dry Season
Wet Season |
11
11 |
496.18
2051.27 |
232.137
643.389 |
||
| Chicken Pox | Dry Season
Wet Season |
11
11 |
6428.82
1851.91 |
1184.618
543.572 |
||
| Lassa Fever | Dry Season
Wet Season |
11
11 |
5.45
6.00 |
1.864
2.023 |
||
| Pneumonia | Dry Season
Wet Season |
11
11 |
967.36
5142.91 |
241.139
788.354 |
||
Table 8: Descriptive analysis of the level of variation in climate change in southwest Nigeria
| Variable | N | M | Std | Percentage of Variation |
| Dry Season Temperature | 11 | 100.97 | 3.493 | 3.46% |
| Wet Season Temperature | 11 | 67.68 | 2.885 | 4.26% |
Objective 1: Determine the Variation in Climate Change in the study area over a period of 11years (2010-2020)
There exists a little variation in the temperature and amount of rainfall recorded from (2010-2020) in southwest Nigeria i.e. the climate change was to a large extent, stable across the years. This agrees with the result of Adedokun 2019 who stated in his findings that, the seasonal variation in south-west Nigeria is slightly different but stable. He explained further that, the climate report indicated that, rainfall in the year 2013 – 2016 has average numbers which means, the variation is slightly different. However, Forgor (2012), had a different result indicating high variation in season in Ghana from 2005-2012.
Objective 2: Identify the most reported case of disease due to climate change or variation in the study area over the period of 11years (2010-2020)
The most reported case of disease identified in this study is Chicken pox and Pneumonia. This disagrees with the result of Abdusallam (2014), who identified typhoid as the most recorded cases in his study. This also negates the findings of Tobias (2011) who identify avian and swine Influenza as the most reported cases due to climate change in his study area (Angola).
CONCLUSION
Based on findings it was concluded there is correlation between climate change and emergence and re-emergence of diseases in South-West Nigeria.
RECOMMENDATIONS
The following recommendations were made:
- The general public should be educated on the need to improve upon sanitation of their environment and also to sensitize the general public more on the importance of immunization against immunizable diseases
- There is a scientific need for the quantification of the relationship between climate and diseases, and to investigate the geographical range and extent of the impacts of climate change on infectious disease.
- Government through NIMET should project the potential impact of climate change on meteorologically-sensitive infectious diseases especially for regions where the projected climate changes impact is likely to change the distribution, and seasonality of these diseases. For example, the Sahel and tropical West Africa, where northwest Nigeria lies.
- Furthermore, in order to assess long-term climate influences on disease trends, d must span numerous seasons and utilize proper statistics to account for seasonal fluctuations as this will allow the Government to develop a blueprint for seasonal disease monitoring and control.
Conflict of Interest
The Authors declared no conflict of interest.
REFERENCES
- Abdussalam, A. F., Monaghan, A. J., Dukić, V. M., Hayden, M. H., Hopson, T. M., Leckebusch, G. C., & Thornes, J. E. (2014). Climate Influences on Meningitis Incidence in Northwest Nigeria. Weather, Climate, and Society, 6(1), 62-76. doi: 10.1175/wcas-d-13-00004.1
- Abdussalam, A. F., Monaghan, A. J., Steinhoff, D. F., Dukic, V. M., Hayden, M. H., Hopson, T. M., Leckebusch, G. C. (2014). The impact of climate change on meningitis in northwest Nigeria: an assessment using CMIP5 climate model simulations. Weather, Climate, and Society, 6(3), 371-379. doi: 10.1175/wcas-d-13-00068.1
- Abeku, T. A., Hay, S. I., Ochola, S., Langi, P., Beard, B., de Vlas, S. J., & Cox, J. (2004).
- Malaria epidemic early warning and detection in African highlands. Trends in Parasitology, 20(9), 400-405. doi: 10.1016/j.pt.2004.07.005
- Adedokun, J., Emofurieta, W., & Adedeji, O. (2009). Physical, mineralogical and chemical properties of Harmattan dust at Ile-Ife, Nigeria. Theoretical and Applied Climatology, 40(3), 161-169.
- Agier, L., Deroubaix, A., Martiny, N., Yaka, P., Djibo, A., & Broutin, H. (2013). Seasonality of meningitis in Africa and climate forcing: aerosols stand out. Journal of the Royal Society Interface, 10(79). doi: 10.1098/rsif.2012.0814
- Akanda, A. S., Jutla, A. S., & Islam, S. (2009). Dual peak cholera transmission in Bengal Delta: A hydroclimatological explanation. Geophysical Research Letters, 36. doi: 10.1029/2009gl039312.
- Alexander, K. A., Carzolio, M., Goodin, D., & Vance, E. (2013). Climate Change is Likely to Worsen the Public Health Threat of Diarrheal Disease in Botswana. International Journal of Environmental Research and Public Health, 10(4), 1202-1230. doi: 10.3390/ijerph10041202.
- Alexander, L. V., Zhang, X., Peterson, T. C., Caesar, J., Gleason, B., Tank, A., . . . VazquezAguirre, J. L. (2006). Global observed changes in daily climate extremes of temperature and precipitation. Journal of Geophysical Research-Atmospheres, 111(D5). doi: 10.1029/2005jd006290
- Astrom, C., Rocklov, J., Hales, S., Beguin, A., Louis, V., & Sauerborn, R. (2012). Potential Distribution of Dengue Fever Under Scenarios of Climate Change and Economic Development. Ecohealth, 9(4), 448-454. doi: 10.1007/s10393-012-0808-0.
- Basu, R., and J.M. Samet. (2002). Relationship between elevated ambient temperature and Mortality: A review of the epidemiologic evidence. Epidemiol. Rev, 24, 190 – 202.
- Bertuzzo, E., Mari, L., Righetto, L., Gatto, M., Casagrandi, R., Blokesch, M., Rinaldo, A. (2011). Prediction of the spatial evolution and effects of control measures for the unfolding Haiti cholera outbreak. Geophysical Research Letters, 38. doi: 10.1029/2011gl046823.
- Building Nigeria’s Response to Climate Change (BNRCC. (2012, April 15). A report on vulnerability, impacts, and adaptation to climate change in Nigeria. Retrieved from www.nigeriaclimatechange.org.
- Buda, A. & A. Jarynowski. (2010). Life-time of correlations and its applications vol.1, Wydawnictwo Niezalezne: 5–21, December 2010 ISBN 978-83-915272-9-0
- Calvin, K., Edmonds, J., Bond-Lamberty, B., Clarke, L., Kim, S. H., Kyle, P., Wise, M. (2009). 2.6: Limiting, climate change to 450 ppm CO2 equivalent in the 21st century. Energy Economics, 31, S107-S120. doi: 10.1016/j.eneco.2009.06.006.
- Campbell-Lendrum, D., Woodruff, R., Prüss-Üstün, A., & Corvalán, C. (2007). Quantifying the health impact at national and local levels.
- Carrel, M., Voss, P., Streatfield, P. K., Yunus, M., & Emch, M. (2010). Protection from annual flooding is correlated with increased cholera prevalence in Bangladesh: a zero inflated regression analysis. Environmental Health, 9. doi: 10.1186/1476-069x-9-13.
- Charles, R. C., & Ryan, E. T. (2011). Cholera in the 21st century. Current Opinion in Infectious Diseases, 24(5), 472-477. doi: 10.1097/QCO.0b013e32834a88af.
- Cheesbrough, J. S., Morse, A. P., & Green, S. D. R. (2015). Meningococcal meningitis and carriage in western zaire – a hypoendemic zone related to climate. Epidemiology and Infection, 114(1), 75-92.
- Collier, P., Conway, G., & Venables, T. (2008). Climate change and africa. Oxford Review of Economic Policy, 24(2), 337-353. doi: 10.1093/oxrep/grn019.
- Colwell, R. R. (2012). Global climate and infectious disease: The cholera paradigm. Science, 274(5295), 2025-2031. doi: 10.1126/science.274.5295.2025.
- Davis, R. E., Knappenberger, P. C., Michaels, P. J., & Novicoff, W. M. (2004). Seasonality of climate-human mortality relationship in US cities and impacts of climate change. Climate Research, 26(1), 61-76. doi: 10.3354/cr026061.
- Davis, S. J., Caldeira, K., & Matthews, H. D. (2010). Future CO2 Emissions and Climate Change from Existing Energy Infrastructure. Science, 329(5997), 1330-1333. doi: 10.1126/science.1188566.
- de Magny, G. C., Cazelles, B., & Guegan, J. F. (2006). Cholera threat to humans in Ghana is influenced by both global and regional climatic variability. Ecohealth, 3(4), 223-231. doi: 10.1007/s10393-006-0061-5.
- Druyan, L. M. (2011). Studies of 21st‐century precipitation trends over West Africa. International Journal of Climatology, 31(10), 1415-1424.
- Dukic, V., Hayden, M., Forgor, A. A., Hopson, T., Akweongo, P., Hodgson, A., Pandya, R. (2012). The Role of Weather in Meningitis Outbreaks in Navrongo, Ghana: A Generalized Additive Modeling Approach. Journal of Agricultural Biological and Environmental Statistics, 17(3), 442-460. doi: 10.1007/s13253-012-0095-9.
- Easterling, D. R., Evans, J. L., Groisman, P. Y., Karl, T. R., Kunkel, K. E., & Ambenje, P. (2010). Observed variability and trends in extreme climate events: A brief review. Bulletin of the American Meteorological Society, 81(3), 417-425.
- Ebi, K. L., Hartman, J., Chan, N., McConnell, J., Schlesinger, M., & Weyant, J. (2013). Climate suitability for stable malaria transmission in Zimbabwe under different climate change scenarios. Climatic Change, 73(3), 375-393. doi: 10.1007/s10584-0056875-2.
- Tuite, A. R., & Fisman, D. N. (2011). A Transmission Model of the 2010 Cholera Epidemic in Haiti RESPONSE. Annals of Internal Medicine, 155(6), 404-404.
- UCAR. (2012, June 30). Forecasting to fight Meningtis. Atmos News: Retreived from https://www2.ucar.edu/atmosnews/impacts/forecasting-fight-meningitis
- UNEP. (2005). Environment for a Secure Future’ and ‘Protecting Nature’s Capital UNEP 2005 Annual Report (pp. 80): United Nations Environment Programme.
- UNHCR. (2014, March 22). 2014 United Nation Human Commission for Refugees (UNHCR)
- Regional operation profile – West Africa. Retrieved http://www.unhcr.org/pages/49e484f76.html
- UNICEF. (2013, April, 18). Report on the progress on drinking water and sanitation, report update 2012. UNICEF/WHO, New York. Retrieved from http://www.unicef.org/media/files/JMPreport2012.pdf
- Van der Werf, G. R., Randerson, J. T., Giglio, L., Collatz, G. J., Mu, M., Kasibhatla, P. S., van Leeuwen, T. T. (2010). Global fire emissions and the contribution of deforestation, savanna, forest, agricultural, and peat fires (1997-2009). Atmospheric Chemistry and Physics, 10(23), 11707-11735. doi: 10.5194/acp-10-11707-2010.
- van Vuuren, D. P., Den Elzen, M. G. J., Lucas, P. L., Eickhout, B., Strengers, B. J., van Ruijven, B., van Houdt, R. (2007). Stabilizing greenhouse gas concentrations at low levels: an assessment of reduction strategies and costs. Climatic Change, 81(2), 119159. doi: 10.1007/s10584-006-9172-9.
- Venables, W. N., & Ripley, B. D. (2002). Modern applied statistics with S: Springer.
- Vestrheim, D. F., Hoiby, E. A., Aaberge, I. S., & Caugant, D. A. (2010). Impact of a
- Pneumococcal Conjugate Vaccination Program on Carriage among Children in Norway. Clinical and Vaccine Immunology, 17(3), 325-334. doi: 10.1128/cvi.0043509.
- Vizy, E. K., Cook, K. H., Crétat, J., & Neupane, N. (2013). Projections of a Wetter Sahel in the Twenty-First Century from Global and Regional Models. Journal of Climate, 26(13), 4664-4687. doi: 10.1175/jcli-d-12-00533.1.
- Washington, R., Harrison, M., Conway, D., Black, E., Challinor, A., Grimes, D., Todd, M. (2006). African climate change – Taking the shorter route. Bulletin of the American Meteorological Society, 87(10), 1355-+. doi: 10.1175/bams-87-10-1355.
- Watson, J. T., Gayer, M., & Connolly, M. A. (2007). Epidemics after natural disasters. Emerging Infectious Diseases, 13(1), 1-5.
- Weil, A. A., Khan, A. I., Chowdhury, F., LaRocque, R. C., Faruque, A. S. G., Ryan, E. T., Harris, J. B. (2009). Clinical Outcomes in Household Contacts of Patients with Cholera in Bangladesh. Clinical Infectious Diseases, 49(10), 1473-1479. doi: 10.1086/644779.