
The Influences of Customer Expectation, Perceived Quality, and Perceived Value on Customer Satisfaction a Case Study for Huawei Company in Kuala Lumpur, Malaysia
- Wen Lang,
- Fridayana Yudiaatmaja
- Trianasari
- 3739-3753
- Aug 14, 2025
- Business Management
The Influences of Customer Expectation, Perceived Quality, and Perceived Value on Customer Satisfaction a Case Study for Huawei Company in Kuala Lumpur, Malaysia
Wen Lang, Trianasari, Fridayana Yudiaatmaja
Universitas Pendidikan Ganesha
DOI: https://dx.doi.org/10.47772/IJRISS.2025.907000304
Received: 09 July 2025; Accepted: 17 July 2025; Published: 14 August 2025
ABSTRACT
In today’s competitive smartphone market, customer satisfaction is a critical determinant of brand success, especially in emerging markets like Malaysia. This study investigates the influence of customer expectation, perceived quality, and perceived value on customer satisfaction with Huawei products in Kuala Lumpur. Drawing upon Expectancy-Disconfirmation Theory, Perceived Quality Theory, and Value-Based Theory, the research employs a quantitative approach using structured questionnaires distributed to 200 Huawei users. Data were analyzed through statistical methods to examine the relationships among the variables. The results indicated that customer expectations, perceived quality, and perceived value each had a significant and positive impact on customer satisfaction. Specifically, price fairness, product durability, and service reliability are key drivers of satisfaction among Malaysian consumers. The study offers theoretical contributions by contextualizing these constructs in the Malaysian smartphone sector and provides practical recommendations for Huawei and similar bands to enhance customer loyalty through innovation, value-based pricing, and improved after-sales service. The findings underscore the importance of aligning product strategies with local consumer expectations in order to achieve long-term competitive advantage.
Keywords: Customer Satisfaction, Customer Expectation, Perceived Quality, Perceived Value, Huawei, Malaysia Market
INTRODUCTION
In the highly competitive global smartphone industry, customer satisfaction plays a pivotal role in determining brand performance, market share, and long-term viability. This is particularly true in emerging markets such as Malaysia, where rapid technological advancements and changing consumer preferences demand continuous adaptation from smartphone manufacturers. For companies like Huawei, understanding the dynamics of customer satisfaction in localized markets is essential for maintaining competitiveness and driving growth.
Malaysia’s smartphone users are notably price-sensitive, yet they also demand high product quality, reliability, and innovation[11][26]. As such, customer satisfaction in this context is strongly influenced by three interrelated factors: customer expectation, perceived quality, and perceived value. Customer expectation serves as the baseline for product evaluation—when performance meets or exceeds expectations, satisfaction and loyalty are more likely to follow. Perceived quality, encompassing aspects such as device performance, brand reputation, and after-sales service, contributes significantly to the overall customer experience. Meanwhile, perceived value, defined as the trade-off between the benefits received and the cost incurred, is a decisive factor in consumer decision-making within price-conscious environments. Nevertheless, previous empirical research has shown inconsistent findings, for example the work of[9][32] showed the importance of perceived values on customer satisfaction,[39][40] found the opposite results. This highlights the need for additional research to further examine these variables.
Huawei’s strategic success in Malaysia depends on its ability to align its offerings with these key satisfaction drivers. By enhancing perceived quality and delivering strong value propositions that resonate with Malaysian consumers, the company can improve customer loyalty and maintain a competitive edge. Indeed, customer satisfaction and loyalty are critical to the quality of any business[41][42][43]This study aims to empirically investigate the influence of customer expectation, perceived quality, and perceived value on customer satisfaction among Huawei smartphone users in Kuala Lumpur, contributing to both theoretical understanding and managerial practice in the fields of consumer behavior and marketing strategy.
Theoretical Background
Understanding customer satisfaction requires a solid foundation in consumer behavior theories. This study draws upon three key theoretical frameworks: Expectancy-Disconfirmation Theory (EDT), Perceived Quality Theory, and Value-Based Theory (VBT), all of which are central to explaining how customer expectations, perceptions, and evaluations shape their satisfaction with products.
- Expectancy-Disconfirmation Theory (EDT):EDT posits that customer satisfaction is formed by comparing pre-purchase expectations with post-purchase performance perceptions[2][3]. Customer evaluations are subject to their personal criteria at any given occasion[34][38]. When performance exceeds expectations, positive disconfirmation occurs, resulting in satisfaction; conversely, unmet expectations lead to dissatisfaction. This theory is especially relevant in Malaysia, where consumers are highly influenced by price sensitivity, cultural norms, and brand reputation. For Huawei, setting realistic and culturally resonant expectations is crucial for fostering customer satisfaction and loyalty. By clearly communicating product features and value propositions, the brand can reduce negative disconfirmation and better align with consumer expectations. Although customer’s zone of tolerance toward product or service failures may vary[35][36][37], a clear communication may allow customer to anticipate and adjust their tolerance level toward negative evaluation In other words, securing their satisfaction level
- Perceived Quality Theory: Perceived quality refers to the consumer’s subjective judgment of a product’s overall excellence or superiority. It goes beyond objective product characteristics and includes elements such as brand image, user experience, and after-sales service. In the context of smartphones, perceived quality encompasses both tangible attributes (e.g., hardware, design) and intangible ones (e.g., software reliability, customer service). A strong perception of quality enhances consumer trust and loyalty[9][32], particularly in technology-driven markets like Malaysia where competition is intense and expectations evolve rapidly.
- Value-Based Theory (VBT): Value-Based Theory explains satisfaction in terms of perceived value—the trade-off between the benefits received and the costs incurred. In price-sensitive markets such as Malaysia, perceived value becomes a decisive factor in purchase decisions. Consumers are more likely to be satisfied when they perceive that the benefits of a product outweigh its price[5][13][15]. For Huawei, this implies the importance of balancing affordability with functionality. By offering feature-rich products at competitive prices, Huawei can enhance perceived value and thereby increase satisfaction and customer retention.
Together, these three theoretical perspectives provide a comprehensive understanding of the drivers behind customer satisfaction in the Malaysian smartphone market. Their integration allows Huawei to strategically align its products and services with the evolving expectations and needs of local consumers, ultimately contributing to sustainable competitive advantage. Justification for the Study (For Journal Publication)
Justification for the Study
Although numerous studies have examined the impact of customer expectation, perceived quality, or perceived value on customer satisfaction, most have focused on developed markets or global smartphone brands in a generalized context. There is a notable research gap in applying these constructs simultaneously to a specific brand within a localized setting, particularly in emerging economies such as Malaysia. In the case of Huawei, which holds a distinct position in the Malaysian market, limited empirical research has explored how these three factors collectively influence customer satisfaction. Therefore, this study is justified in both academic and practical terms. Academically, it contributes to the literature by contextualizing established theoretical constructs—[2], Perceived Quality Theory, and Value-Based Theory—within the behavioral patterns of Malaysian consumers. Practically, the findings can guide smartphone brands, especially Huawei, in crafting customer-centric strategies tailored to the expectations, perceptions, and value sensitivity of users in Kuala Lumpur and similar urban markets across Southeast Asia.
METHODOLOGY
This study adopts a quantitative research design to examine the relationships among customer expectation, perceived quality, perceived value, and customer satisfaction in the context of Huawei smartphone users in Kuala Lumpur, Malaysia. The research framework is grounded in established theories such as. [2](EDT), Perceived Quality Theory, and Value-Based Theory, which guide the selection and measurement of key constructs
Sampling and Participants
A convenience sampling method was used to recruit participants from high-traffic urban retail zones and online platforms frequented by Huawei consumers. The sample consisted of 200 respondents, selected to reflect the diversity of Kuala Lumpur’s smartphone user population, particularly among the 18–34 age demographic that dominates mobile technology adoption in Malaysia
Participants were eligible if they were current or recent users of Huawei smartphones within the last two years, ensuring relevance to contemporary brand experiences.
Instrumentation
Data were collected using a structured questionnaire based on validated scales from previous studies. The items measured four constructs:
Customer Expectation Perceived Quality Perceived Value Customer Satisfaction
Each construct was assessed using a 5-point Likert scale ranging from “strongly disagree” (1) to “strongly agree” (5). The questionnaire incorporated both positively and negatively worded items to reduce response bias[19].
The instruments were pre-tested in a pilot study, yielding high reliability scores (Cronbach’s α > 0.90 for all constructs), indicating strong internal consistency
Data Collection Procedure
The survey was administered via a dual-mode approach:
Online, through emails and social media platforms
Offline, through face-to-face interviews in malls and Huawei retail stores
This mixed mode enhanced accessibility and ensured representation across different demographic and geographic subgroups. Ethical considerations were strictly adhered to; informed consent was obtained from all participants, and anonymity and voluntary participation were ensured.
Data Analysis
Data were analyzed using SPSS statistical software. The analysis included:
Descriptive statistics to profile respondents Correlation analysis to examine relationships among variables Multiple regression to test the influence of the independent variables on customer satisfactionThese analytical techniques allowed the study to test the hypothesized model and draw meaningful conclusions about the determinants of customer satisfaction in Malaysia’s smartphone market.
Empirical Findings/Result
Introduction
This chapter presents the empirical findings of the study and provides a comprehensive analysis of the relationships among the key variables: customer expectation, perceived quality, perceived value, and customer satisfaction. Based on quantitative data collected from 200 Huawei smartphone users in Puchong Kuala Lumpur, Malaysia, the results are used to test the research hypotheses and interpret the implications within the context of the local market environment.
Huawei Technologies Co., Ltd., the subject of this case study, is a leading global provider of information and communications technology (ICT) infrastructure and smart devices. Founded in 1987 and headquartered in Shenzhen, China, Huawei has grown into one of the world’s largest technology companies, with approximately 207,000 employees and business operations in over 170 countries and regions as of 2024. The company’s core business segments include Carrier Network, Enterprise Solutions, and Consumer Devices, with the latter playing a significant role in its market presence through innovative and competitively priced smartphones and related consumer electronics.
Huawei faces intense competition in the Malaysian smartphone market, particularly from global brands such as Samsung and Oppo. In this context, understanding how customer expectations align with perceived quality and value is critical to improving satisfaction and building long-term brand loyalty. This chapter interprets the statistical findings in relation to Huawei’s market strategy and discusses their managerial and practical implications.
Huawei Smartphone Product Overview
Huawei smartphones have become a significant part of the global mobile device market, especially in emerging markets such as Malaysia. As part of Huawei Technologies Co., Ltd.’s consumer business segment, the company’s smartphones are well-regarded for their integration of cutting-edge technology, elegant design, and competitive pricing. Models such as the Huawei P Series and Mate Series are known for their advanced camera systems[29][30], AI-enhanced performance, long battery life, and sleek aesthetics.
In Malaysia, Huawei targets a broad spectrum of users—from tech-savvy professionals to price-sensitive consumers—by offering devices across multiple price tiers. Its mid-range models (e.g., Huawei Nova Series) appeal to younger demographics seeking style and functionality, while flagship models cater to users demanding high performance and premium features. The brand emphasizes features such as fast charging, high-resolution cameras, and 5G connectivity to meet modern consumer expectations.
Huawei also invests in after-sales service, including warranty programs, software updates, and dedicated service centers in Malaysia, reinforcing customer trust and enhancing perceived value. The brand’s consistent focus on innovation and affordability positions it competitively within the Malaysian smartphone market, despite challenges from strong global rivals.
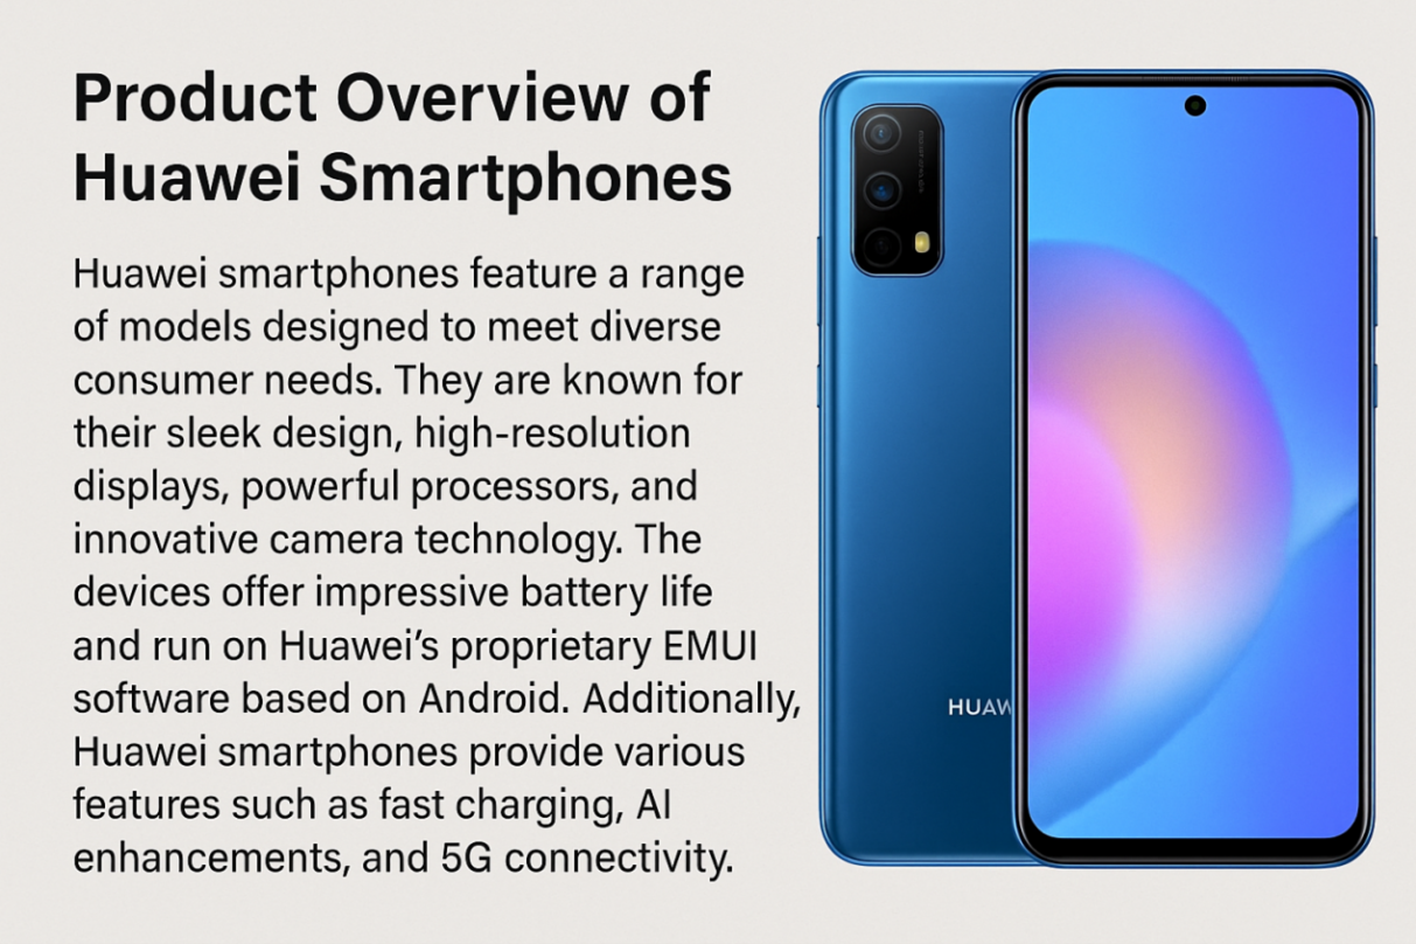
Fig. 1
Reliability Test
Table Ⅰ Reliability Test
| Variables | Items | Cronbach’s alpha |
| Customer Expectation | 6 | 0.908 |
| Perceived Quality | 6 | 0.918 |
| Perceived Value | 6 | 0.922 |
| Customer Satisfaction | 6 | 0.934 |
Analysis of the reliability test results in Table Ⅰ shows that each construct in the study exhibits high internal consistency. Exceptional reliability is demonstrated by all four measures, as Customer Expectation (α = .908), Perceived Quality (α = .918), Perceived Value (α = .922) and Customer Satisfaction (α = .934) all have Cronbach’s alpha values greater than 0.90. These strong values of Cronbach’s alpha suggest that the items in each scale are all highly interconnected and reliably capture what each construct represents. The strong reliability of the instrument increases the trustworthiness of the survey data and strengthens the accuracy of findings during analysis.
Characteristics of respondents
Table Ⅱ Age
| Frequency | Percent | Valid Percent | Cumulative Percent | ||
| Valid | 18–24 | 33 | 16.5 | 16.5 | 16.5 |
| 25–34 | 95 | 47.5 | 47.5 | 64.0 | |
| 35–44 | 51 | 25.5 | 25.5 | 89.5 | |
| 45–54 | 20 | 10.0 | 10.0 | 99.5 | |
| 55 and above | 1 | 0.5 | 0.5 | 100.0 | |
| Total | 200 | 100.0 | 100.0 | ||
The age distribution of the 200 participants surveyed is displayed in Table Ⅱ. The 25–34-year-age-group holds the largest share at 47.5% (n = 95) while the 35–44-year group makes up 25.5% (n = 51) and the 18–24 age group has 16.5% (n = 33) of the total respondents. People between 45 and 54 years old make up 10.0% (n = 20), and just 0.5% (n = 1) are older than 55 years. The total figures show that all responses were accounted for in the study. The majority of respondents falls into the young to middle-aged age range, closely matching the profiles of most smartphone users. This can help shed light on levels of satisfaction and patterns of usage among regular phone users.
Table Ⅲ Gender
| Frequency | Percent | Valid Percent | Cumulative Percent | ||
| Valid | Male | 98 | 49.0 | 49.0 | 49.0 |
| Female | 102 | 51.0 | 51.0 | 100.0 | |
| Total | 200 | 100.0 | 100.0 | ||
Table Ⅲ illustrates that within the pool of 200 respondents, an almost symmetrical split between males and females existed. The sample includes 98 participants who self-report as male and 102 who self-report as female. Having an equal distribution of data by gender strengthens the credibility of the results by considering the views of customers from both genders. The uniform distribution of genders in such research is significant since it allows researchers to better identify the ways in which consumer preferences, perceptions, and judgment vary according to gender.
Table Ⅳ Education Level
| Education Level | Frequency | Percent | Valid Percent | Cumulative Percent |
| Secondary | 153 | 76.5 | 76.5 | 76.5 |
| Diploma | 31 | 15.5 | 15.5 | 92 |
| Bachelor’s | 13 | 6.5 | 6.5 | 98.5 |
| Master’s or higher | 3 | 1.5 | 1.5 | 100 |
| Total | 200 | 100 | 100 | — |
Table Ⅳ illustrates the education backgrounds of the 200 participants. Most people in the survey had finished secondary education, with 76.5% (n = 153) saying so. Further, 15.5% (n = 31) have a diploma, 6.5% (n = 13) completed their bachelor’s degree and just 1.5% (n = 3) have earned a master’s or higher degree. These figures reflect the complete survey sample. Most of the participants appear to fall within the primary-to-secondary level of education. This could shape their expectations and views about smartphones and other types of consumer technology.
Table Ⅴ Monthly Income (MYR)
| Income Range | Frequency | Percent | Valid Percent | Cumulative Percent |
| Below 2,000 | 26 | 13 | 13 | 13 |
| 2,000–3,999 | 57 | 28.5 | 28.5 | 41.5 |
| 4,000–5,999 | 53 | 26.5 | 26.5 | 68 |
| 6,000 and above | 64 | 32 | 32 | 100 |
| Total | 200 | 100 | 100 | — |
| Frequency | Percent | Valid Percent | Cumulative Percent | ||
| Valid | Below 2,000 | 26 | 13.0 | 13.0 | 13.0 |
| 2,000–3,999 | 57 | 28.5 | 28.5 | 41.5 | |
| 4,000–5,999 | 53 | 26.5 | 26.5 | 68.0 | |
| 6,000 and above | 64 | 32.0 | 32.0 | 100.0 | |
| Total | 200 | 100.0 | 100.0 | ||
The following table displays the monthly income categories of the 200 participants using the Malaysian Ringgit (MYR) as the measurement unit. This study shows that most respondents earn at least 6,000 MYR monthly. A further 28.5% (n = 57) fell in the range of 2,000–3,999 MYR and 26.5% (n = 53) earned an income between 4,000–5,999 MYR. A subset of 13.0% (n = 26) participants reported income lower than 2,000 MYR. A review of the total show that all respondents have been accounted for. Such a diverse sample of earners can help us explore how individual perceptions and feelings of satisfaction might differ according to socioeconomic status among Malaysian smartphone users.
Table Ⅵ Are you a current Huawei smartphone user?
| Frequency | Percent | Valid Percent | Cumulative Percent | ||
| Valid | Yes | 32 | 16.0 | 16.0 | 16.0 |
| No | 148 | 74.0 | 74.0 | 90.0 | |
| Former User | 20 | 10.0 | 10.0 | 100.0 | |
| Total | 200 | 100.0 | 100.0 | ||
A breakdown of Huawei smartphone usage among the group of 200 participants is presented in Table Ⅵ. Most respondents (74.0%) didn’t use a Huawei smartphone at the time of the survey and just 16.0% were actively carrying a Huawei device. Furthermore, 10.0% of respondents (n = 20) stated they’d used Huawei in the past. That figure demonstrates that all the available data has been included in the analysis. These results indicate that the bulk of participants have interacted with Huawei products in the past or currently, yet the company still struggles to keep existing customers or attract new ones. The findings help inform how customer satisfaction and perceived value are connected with the degree of loyalty towards the brand.
Description of Research Variables
Table Ⅶ Distribution of Customer Expectation
| N | Mean | Std. Deviation | |
| CE1 | 200 | 3.33 | 1.029 |
| CE2 | 200 | 3.35 | 1.035 |
| CE3 | 200 | 3.33 | 1.047 |
| CE4 | 200 | 3.30 | 1.006 |
| CE5 | 200 | 3.30 | 1.003 |
| CE6 | 200 | 3.35 | 1.000 |
Descriptive statistics for the six items measuring CE are shown in Table Ⅶ. Each item was completed by 200 participants. Indices on average, the measured expectations showed a similar scale and can be considered moderate for each item. Respondents tend to express the greatest alignment with CE2 and CE6, which both have a mean value of 3.35. Variability of responses is evident with standard deviations ranging between 1.000 and 1.047. The fact that all the mean scores are similar suggests participants share common ideas about what to expect from a Huawei phone but there are also relatively small differences influencing the way each person approaches the product.
Table Ⅷ Distribution of Perceived Quality
| N | Mean | Std. Deviation | |
| PQ1 | 200 | 3.66 | 1.149 |
| PQ2 | 200 | 3.62 | 1.145 |
| PQ3 | 200 | 3.64 | 1.191 |
| PQ4 | 200 | 3.64 | 1.103 |
| PQ5 | 200 | 3.66 | 1.154 |
| PQ6 | 200 | 3.59 | 1.157 |
The statistics in Table Ⅷ are derived from 200 respondents for the six questions assessing Perceived Quality (PQ1–PQ6). Respondents’ ratings imply generally favorable views of Huawei’s product quality, although results aren’t uniformly high. Respondents appear to be somewhat more receptive to phrasing highlighting strength and appearance of Huawei’s products. The standard deviations show that the answers provided for each item differ to some extent among respondents. Participants find Huawei’s quality to be somewhat better than average yet there is some diversity in how individuals evaluate particular aspects of quality.
Table Ⅸ Distribution of Perceived Value
| N | Mean | Std. Deviation | |
| PV1 | 200 | 3.66 | 1.204 |
| PV2 | 200 | 3.59 | 1.170 |
| PV3 | 200 | 3.76 | 1.130 |
| PV4 | 200 | 3.60 | 1.157 |
| PV5 | 200 | 3.75 | 1.195 |
| PV6 | 200 | 3.76 | 1.113 |
The data in Table Ⅸ show the descriptive statistics for the six questions used to measure Perceived Value, drawing from responses of 200 people. Overall, the data shows that respondents view the proposed products from Huawei as offering solid value for their price point. Participants seemed to find the items regarding cost-efficiency and the overall benefit most attractive, as PV3 and PV6 received mean scores of 3.76. Differences in evaluation among respondents appear to be consistent, as expressed by the ranges of standard deviations between 1.113 and 1.204. According to the findings, the value proposition aligned with pricing and features provided by Huawei devices appeals to the majority of users.
Table X Distribution of Customer Satisfaction
| N | Mean | Std. Deviation | |
| CS1 | 200 | 3.52 | 1.042 |
| CS2 | 200 | 3.53 | 1.079 |
| CS3 | 200 | 3.49 | 1.084 |
| CS4 | 200 | 3.56 | 1.031 |
| CS5 | 200 | 3.60 | 1.094 |
| CS6 | 200 | 3.53 | 1.107 |
Data summarized in Table X show the descriptive statistics for each item assessing Customer Satisfaction (CS1–CS6), drawn from responses across 200 people. The mean scores show that customers are generally satisfied to a moderate degree with their experience. On CS5, respondents expressed the highest degree of satisfaction (mean score of 3.60) regarding various aspects of product or service quality. Significant variation among responses is reflected by standard deviations ranging from 1.031 to 1.107. All items produced similar mean scores, suggesting a generally constant level of satisfaction within the sample. Responses, however, demonstrated varying degrees of satisfaction with different Huawei products.
Results of Data Analysis
Table XI Result of t test
| Model | Unstandardized Coefficients | Standardized Coefficients | t | Sig. | ||
| B | Std. Error | Beta | ||||
| 1 | (Constant) | 0.970 | 0.255 | 3.801 | <0.001 | |
| CE | 0.289 | 0.077 | 0.263 | 3.765 | <0.001 | |
| PQ | 0.264 | 0.068 | 0.275 | 3.893 | <0.001 | |
| PV | 0.175 | 0.068 | 0.185 | 2.567 | 0.011 | |
| a. Dependent Variable: CS | ||||||
A multiple linear regression t-test was performed to determine how Customer Expectation (CE), Perceived Quality (PQ), and Perceived Value (PV) contribute to the outcome of Customer Satisfaction (CS). Analyses of the model reveal the importance of all three predictors by measuring their unstandardized and standardized coefficients, t-values, and associated levels of significance.
A baseline level of satisfaction (B = 0.970, p < .001) is present even when none of the predictors are considered. This coefficient is significant, indicating that respondents generally have a certain level of satisfaction, regardless of the influences of the independent variables.
An increase in customer expectations leads to a corresponding rise in customer satisfaction, measured by statistically significant unstandardized and standardized coefficients (B = 0.289 and β = 0.263, respectively). These results show that CE has a significant positive effect on CS and that this relationship is robust. This suggests that customers who have their demands and wishes fulfilled feel greater contentment with the services provided. Customers’ satisfaction with Huawei smartphones is influenced substantially by what they anticipate.
Customers’ perception of quality (PQ) is found to strongly increase their satisfaction, with a beta value of β = 0.275 and a coefficient of B = 0.264. The t-value of 3.893 shows that the predictor is both strong and significantly influential. The results indicate that Huawei smartphone users become more satisfied when they evaluate the product’s qualities to be of a high standard[10]. This result highlights the fact that Perceived Quality is the most important aspect in the model, as it’s the strongest influence.
A moderate positive relationship between PV and CS is established, evidenced by the values of B = 0.175, β = 0.185, and t = 2.567, all indicating statistically significant effects. This result is statistically significant according to the 5% confidence level. This implies that enhanced customer satisfaction follows when they see Huawei smartphones as providing a favorable return on investment[22][23]. However, the influence of perceived value on satisfaction is found to be somewhat less considerable than that of both CE and PQ.
Table XII F Test Results
| Model | Sum of Squares | df | Mean Square | F | Sig. | |
| 1 | Regression | 60.501 | 3 | 20.167 | 35.395 | <0.001b |
| Residual | 111.675 | 196 | 0.570 | |||
| Total | 172.176 | 199 | ||||
| a. Dependent Variable: CS | ||||||
| b. Predictors: (Constant), PV, CE, PQ | ||||||
The F-test results from the multiple linear regression model for studying how Customer Expectation (CE), Perceived Quality (PQ) and Perceived Value (PV) affect Customer Satisfaction (CS) are presented in Table 4.12. The total variation in customer satisfaction is split into the variation explained by the model (60.501) and the remaining unexplained variation (111.675).
Dividing the regression sum of squares by 3 results in a mean square value of 20.167. The unexplained variance or residual mean square amounted to 0.570 since it was obtained by dividing the residual sum of squares (111.675) by its corresponding 196 degrees of freedom. This model is considered significant since the obtained F-value is highly significant (p < .001). The findings suggest that variations in three factors (CE, PQ and PV) account for a significant amount of the variation in customer satisfaction, making it unlikely that the observed relationship is due to chance.
The results support the conclusion that Customer Expectation, Perceived Quality and Perceived Value jointly account for predicting Customer Satisfaction in a meaningful way. The large value of F-ratio indicates that our regression model captures most of the variance in customers’ satisfaction, making it a highly interpretable model. These findings also demonstrate that adding these three independent variables to the model significantly increases its predictive accuracy over a model with only the intercept.
Furthermore, the F-test corroborates what was shown by the previous t-tests, which demonstrated that each predictor has a significant impact on explaining customer satisfaction. The findings support and confirm the conceptual approach of the study based on.[2], Perceived Quality and Value theories, and reinforce the significance of effectively managing customer expectations, ensuring high product quality, and providing valuable offers to increase customer satisfaction in the intensely competitive smartphone industry.
Table XIII Test Results of the Coefficient of Determination (R2)
| Model | R | R Square | Adjusted R Square | Std. Error of the Estimate |
| 1 | .593a | .351 | .341 | .755 |
| a. Predictors: (Constant), PV, CE, PQ | ||||
Table XIII displays the findings of R² for the regression analysis examining the relationship between Customer Expectation (CE), Perceived Quality (PQ), and Perceived Value (PV) and Customer Satisfaction (CS). A correlation of 0.593 between the three predictors and the outcome variable was observed. According to the R Square value of 0.351 it can be inferred that 35.1% of the changes in customer satisfaction are accounted for by the effects of the three independent variables. This shows that other variables can also affect satisfaction, yet CE, PQ and PV together account for a significant share of the variance in satisfaction.
The Adjusted R Square value slightly decreases to 0.341 when considering the number of predictors to provide a more appropriate measure of the model’s variance explained in the population. The model’s fit is measured by the standard error, which is equal to 0.755.
The outcomes show that the model can explain a significant part of the variation present in the dataset. This result indicates that customer satisfaction can be explained by the combined influence of their expectations, perceptions of quality, and evaluations of value.
DISCUSSION
The findings of this study confirm that customer satisfaction with Huawei smartphones in Malaysia is significantly influenced by three key constructs: customer expectation, perceived quality, and perceived value.
First, the positive impact of customer expectation on satisfaction (β = 0.263, p < .001) supports the core assumptions of the[2]. This theory posits that when customer experiences meet or exceed expectations, satisfaction results. Malaysian consumers rely on marketing, peer recommendations, and personal experiences to form expectations about a brand
The study reveals that Huawei customers are more satisfied when their expectations regarding product features, reliability, and performance are fulfilled. This highlights the importance of clear, accurate, and culturally relevant communication strategies to manage expectations in local markets
Second, perceived quality emerged as the strongest predictor of satisfaction (β = 0.275, p < .001), reinforcing the findings from prior studies in consumer electronics. Huawei’s success depends not only on delivering quality performance but also on maintaining a trustworthy brand image, attractive design, and responsive after-sales support. This aligns with the Perceived Quality Theory, which suggests that consumer satisfaction arises from their subjective assessment of the brand’s excellence across tangible and intangible attributes
In the context of Malaysia’s competitive and technologically advanced smartphone market, perceived quality becomes a critical differentiator.
Third, although perceived value had a slightly lower regression coefficient (β = 0.185, p = .011), it still plays a meaningful role, especially in price-sensitive environments like Malaysia. This supports Value-Based Theory, which views customer satisfaction as a function of the trade-off between what consumers receive versus what they pay. Huawei’s strategy of offering advanced features at affordable prices appears to enhance perceived value and, consequently, satisfaction
Moreover, the combined model explained 35.1% of the variance in customer satisfaction (R² = 0.351), indicating that while CE, PQ, and PV are important, other variables such as brand loyalty, emotional engagement, and service experience may also influence satisfaction and deserve future exploration
These findings carry both theoretical and practical implications. Theoretically, they affirm the relevance of integrating multiple satisfaction-related theories in the Malaysian context. Practically, they suggest that Huawei and similar brands should enhance communication transparency, prioritize quality across the product lifecycle[17][25], and develop pricing strategies that reinforce value perception. In doing so, firms can achieve sustained customer satisfaction and loyalty in emerging markets.
CONCLUSIONS
RO1: Influence of Customer Expectations on Customer Satisfaction
This study finds that customer expectations have a strong and statistically significant effect on customer satisfaction in the context of Huawei smartphone users in Malaysia. The results support the. [2](EDT), which posits that satisfaction arises when product performance matches or exceeds pre-purchase expectations. In Malaysia’s rapidly evolving digital consumer landscape, expectations are shaped through exposure to advertisements, word-of-mouth communication, social media content, and past user experiences[20][24]. When these expectations are met, it leads to positive disconfirmation, resulting in higher satisfaction. Conversely, when expectations are unmet, it can result in customer frustration, negative reviews, and ultimately, brand switching.
The Malaysian market, characterized by high brand awareness and rapid technological adoption, demands accurate expectation management. Huawei must ensure that marketing claims are realistic and reflect the true features and performance of its products. Clear and transparent product descriptions, authentic customer reviews, and demonstration videos could help manage consumer expectations more effectively. Furthermore, localized marketing strategies that account for cultural nuances and regional preferences should be implemented. By aligning product development and communication strategies with the evolving expectations of Malaysian consumers, Huawei can enhance both customer satisfaction and brand trust. As expectations continue to rise in competitive markets, continuous innovation coupled with strategic expectation setting becomes vital for sustainable growth.
RO2: Impact of Perceived Quality on Customer Satisfaction
The research identifies perceived quality as the most influential determinant of customer satisfaction among the three variables studied. Malaysian consumers associate high perceived quality not only with functional features such as battery life, camera quality, display resolution, and processing speed, but also with intangible factors like brand reputation[27], durability, and innovation. This is in line with prior studies (e.g., Kim & Hyun, 2018; Hossain et al., 2021) which demonstrate that perceived quality is often the primary indicator of customer loyalty and repeat purchase behavior, particularly in the smartphone sector.
For Huawei, maintaining perceived quality involves continuous investment in R&D, especially in areas valued by Malaysian consumers—such as high-performance cameras, 5G compatibility, and secure operating systems. Moreover, after-sales services, including prompt warranty support and software updates, play a crucial role in reinforcing the perception of quality. Malaysian consumers are particularly sensitive to service responsiveness, and a strong after-sales network can help offset occasional product flaws.
To further enhance perceived quality, Huawei should also focus on maintaining a consistent brand narrative that emphasizes reliability, innovation, and user-centric design. Collaborations with local influencers, user-generated content, and tech-review platforms can help reinforce these perceptions. By creating a strong and consistent quality experience—before, during, and after the purchase—Huawei can secure a lasting competitive edge in the saturated Malaysian smartphone market.
RO3: Influence of Perceived Value on Customer Satisfaction
The results also confirm that perceived value significantly influences customer satisfaction, particularly in price-sensitive and value-driven markets like Malaysia[5][14]. Perceived value represents the consumer’s evaluation of what is received (product features, quality, brand experience) versus what is given (monetary and non-monetary cost). When consumers perceive that the benefits outweigh the price paid, they report greater satisfaction and stronger purchase intent. This is consistent with[15], which states that value-for-money plays a central role in consumer satisfaction, especially in emerging markets.
Huawei has strategically positioned itself by offering mid-range and premium smartphones with competitive specifications at affordable prices. Features such as long battery life, advanced AI cameras, and sleek industrial design enhance the overall perceived value. Malaysian consumers appreciate this balance of quality and affordability, particularly when compared to premium-priced global competitors such as Apple or Samsung. However, this competitive advantage can only be sustained if Huawei continues to innovate while keeping costs under control.
To maintain high perceived value, Huawei should offer bundled services (e.g., extended warranties, screen protection plans), loyalty programs, and regular software updates that prolong device usability. Strategic price positioning, without undermining brand prestige, is also essential. Furthermore, incorporating eco-conscious design or local language support may enhance perceived value among environmentally and culturally aware consumers. By consistently exceeding the value expectations of Malaysian consumers, Huawei can build stronger emotional connections with users, drive repurchase behavior and maintain long-term satisfaction. Page Layout
An easy way to comply with the conference paper formatting requirements is to use this document as a template and simply type your text into it.
ACKNOWLEDGEMENT
The authors are deeply grateful to Universitas Pendidikan Ganesha for providing not only the academic platform and resources necessary for this research, but also a supportive learning environment that fostered critical thinking and scholarly development.
Special thanks are due to the respondents in Kuala Lumpur who generously participated in the data collection process. Without their honest feedback and willingness to share their experiences as Huawei users, this study would not have been possible.
REFERENCES
- Ali, A. A. E. K. A. (2020). The impact of brand dimensions on customer satisfaction with the brand: An empirical study on mobile phone customers in Egypt. European Journal of Management and Marketing Studies, 5(3).
- Anderson, E. W., & Sullivan, M. W. (1993). The antecedents and consequences of customer satisfaction for firms. Marketing science, 12(2), 125-143.
- Anderson, E. W., & Mittal, V. (2000). Strengthening the satisfaction-profit chain. Journal of Service research, 3(2), 107-120.
- Chang, T. Z., & Wildt, A. R. (1994). Price, product information, and purchase intention: An empirical study. Journal of the Academy of Marketing science, 22, 16-27.
- Haba, H., Hassan, Z., & Dastane, D. O. (2017). Factors leading to consumer perceived value of smartphones and its impact on purchase intention. Global Business and Management Research: An International Journal, 9(1).
- Hendijani Fard, M., & Marvi, R. (2020). Viral marketing and purchase intentions of mobile applications users. International Journal of Emerging Markets, 15(2), 287-301.
- He, Y. (2024). Chinese digital platform companies’ expansion in the Belt and Road countries. The Information Society, 40(2), 96-119.
- Hinduan, Z. R., Anggraeni, A., & Agia, M. I. (2020). Generation Z in Indonesia: The self-driven digital. In The New Generation Z in Asia: Dynamics, Differences, Digitalisation (pp. 121-134). Emerald Publishing Limited.
- Hossain, M. A., Yesmin, M. N., Jahan, N., & Kim, M. (2021). Effects of service justice, quality, social influence and corporate image on service satisfaction and customer loyalty: Moderating effect of bank ownership. Sustainability, 13(13), 7404.
- Jahan, N., Rahman, M. M., Hossain, M. A., & Saiful, H. (2019). An empirical study on customer satisfaction: Mobile phone users in an emerging market. Journal of Digital Convergence, 17(4).
- Kabeyi, M. J. B. (2018). Michael porter’s five competitive forces and generetic strategies, market segmentation strategy and case study of competition in global smartphone manufacturing industry. IJAR, 4(10), 39-45.
- Kotler, P., Keller, K. L., & Ang, S. H. (2018). Marketing management: an Asian perspective. Pearson.
- Kuo, Y. F., Wu, C. M., & Deng, W. J. (2009). The relationships among service quality, perceived value, customer satisfaction, and post-purchase intention in mobile value-added services. Computers in human behavior, 25(4), 887-896.
- Liu, S. (2024). Analyzing Consumer Behavior and Brand Loyalty in the Chinese Smartphone Market: A Case Study of Huawei. Frontiers in Management Science, 3(3), 35-42.
- Monroe, C., Swann, W., Robinson, H., & Wieman, C. (1990). Very cold trapped atoms in a vapor cell. Physical Review Letters, 65(13), 1571.
- More, A. B. (2023). Implementing digital age experience marketing to make customer relations more sustainable. In New Horizons for Industry 4.0 in modern business (pp. 99-119). Cham: Springer International Publishing.
- Nguyen, D. T., Pham, V. T., Tran, D. M., & Pham, D. B. T. (2020). Impact of service quality, customer satisfaction and switching costs on customer loyalty. The Journal of Asian Finance, Economics and Business, 7(8), 395-405.
- Opata, C. N., Xiao, W., Nusenu, A. A., Tetteh, S., & John Narh, T. W. (2020). Customer value co-creation in the automobile industry: Antecedents, satisfaction, and moderation. SAGE Open, 10(3), 2158244020948527.
- Parasuraman, A., Zeithaml, V. A., & Berry, L. L. (1988). Servqual: A multiple-item scale for measuring consumer perc. Journal of retailing, 64(1), 12.
- Patil, D. R., & Rane, N. L. (2023). Customer experience and satisfaction: importance of customer reviews and customer value on buying preference. International Research Journal of Modernization in Engineering Technology and Science, 5(3), 3437-3447.
- Rani, M. S. B. A. (2021). Study on customer satisfaction, adoption, perception, Behaviour, and Security on financial technology (fintech) services. In International Conference on Multidisciplinary Innovation and Economics (Vol. 8, No. 9, pp. 146-160).
- Saut, M., & Bie, S. (2024). Impact of service expectation, experiential quality, and perceived value on hotel customer satisfaction. Journal of Quality Assurance in Hospitality & Tourism, 25(4), 781-809.
- Setiobudi, A., Sudyasjayanti, C., Singgih, K. J., & Gadi, A. F. (2021). Mobile Payment Products in Indonesia: Is it a Lifestyle or a Need? Journal Manajemen Bisnis, 12(1), 115-126.
- Singh, J., & Sirdeshmukh, D. (2000). Agency and trust mechanisms in consumer satisfaction and loyalty judgments. Journal of the Academy of marketing Science, 28, 150-167.
- Shaikh, E., Watto, W. A., Brahmi, M., Tunio, M. N., & Lighari, S. N. (2023). Customer satisfaction and Customer loyalty: An empirical case study on the impact of benefits generated through Smartphone applications. International journal of public sector performance management, 12(1-2), 119-139.
- Wilson, N., & Makmud, S. T. (2018). The Impact Of Brand Evaluation, Satisfaction, And Trust to Brand Loyalty: A Case Study of the Indonesian Smartphone Industry. Journal Muara Ilmu Social, Humaniora, dan Seni, 2(2), 633-649.
- Wiwaha, A., & Budiyanto, H. (2021). The effect of country of origin and product quality on purchase intention: Case of Huawei smartphones. International Journal of Digital Entrepreneurship and Business, 2(1), 1-10.
- Woodruff, R. B. (1997). Customer value: the next source for competitive advantage. Journal of the academy of marketing science, 25, 139-153.
- Wong, J. E. (2019). Repurchase intention towards Huawei smartphone brand (Doctoral dissertation, UTAR).
- Yu, L., Duan, Y., & Fan, T. (2020). Innovation performance of new products in China’s high-technology industry. International Journal of Production Economics, 219, 204-215.
- Zariman, N. F. M., Humaidi, N., & Abd Rashid, M. H. (2023). Mobile commerce applications service quality in enhancing customer loyalty intention: mediating role of customer satisfaction. Journal of Financial Services Marketing, 28(4), 649-663.
- Zeithaml, V. A. (1988). Consumer perceptions of price, quality, and value: a means-end model and synthesis of evidence. Journal of marketing, 52(3), 2-22.
- Zhuang, B. (2023). Factors Influencing the Intention of College Students in Guangdong Province to Continuously Purchase Huawei Mobile Phones. Journal of Reproducible Research, 2(1), 157-168.
- Trianasari, N. (2013). The Elasticity of Customer Tolerance toward Service Failure within a Hotel Setting (Doctoral dissertation, Griffith University). Griffith University Research Repository. https://research griffith.edu.au/server/api/core/bitstreams/e11a9519-49e4-52a9-a370-4987ea3c77e7/content
- Trianasari, N., Butcher, K., & Sparks, B. (2017). Understanding Guest Tolerance and the Role of Cultural Familiarity in Hotel Service Failures. Journal of Hospitality Marketing & Management, 27(1), 21–40. https://doi.org/10.1080/19368623.2017.1329677
- Trianasari, Nana. (2018). Hotel responses toward online complaints. Proceedings of ICEBA (pp.51-54). ICEBA 2018: Proceedings of the 2018 International Conference on E-Business and Applications https://doi.org/10.1145/3194188.3194198
- Trianasari, N., Butcher, K., & Sparks, B. (2018). Understanding guest tolerance and the role of cultural familiarity in hotel service failures. Journal of Hospitality Marketing & Management, 27(1), 21-40.
- Trianasari, B. S., & Butcher, K. (2012). The role of cultural familiarity on customer satisfaction in the context of hotel service failure. Current Issues in Hospitality & Tourism Research and Innovations (63).
- Putu Ayu Lalita Srivisakha, Trianasari, T., & Ni Made Suci. (2024). The influence of product quality, price perception and brand image on consumer satisfaction of Yamaha NMAX Motorcycles in Denpasar Bali. Journal Ekonomi, 13(01), 1944–1961. Retrieved from https://www.ejournal.seaninstitute.or.id/index.php/Ekonomi/article/view/4216
- Ni Wayan Sri Jayanti, Ni Luh Wayan Sayang Telagawathi, & Trianasari, T. (2023). THE ROLE OF CUSTOMER SATISFACTION IN MEDIATING BRAND IMAGE AND PERCEIVED VALUE ON BRAND LOYALTY FOR TRI PROVIDERS IN BALI. Journal Ekonomi, 12(04), 2058–2064. Retrieved from https://www.ejournal.seaninstitute.or.id/index.php/Ekonomi/article/view/3325
- Trianasari, Mahardika, Yudha Martin AA., Rahmawati, Indah. (2019). Hotel Customer Satisfaction: Who Cares? Proceeding TEAMS. https://www.atlantis-press.com/proceedings/teams-19/125924388
- Widiantara, I W. & Trianasari, T. (2021). Pengaruh Kualitas Produce dan Kualitas Pelayanan terhadap Kepuasan Pelanggan Toyota Avanza di Singaraja, Bisma: Journal Manajemen 7(1), DOI: https://doi.org/10.23887/bjm.v7i1.30525
- Trianasari, T., Rahmawati, P. I., Andiani, N. D., Nugraha, I. G. P., & Andayani, N. L. H. (2021, November). Dolphin Watching Tour from the Tourists’ Perspective. In 6th International Conference on Tourism, Economics, Accounting, Management, and Social Science (TEAMS 2021) (pp. 268-274). Atlantis Press.
- Agarwal, R., & Tiwari, M. (2021). Impact of Perceived Value and Brand Trust on Customer Satisfaction: A Study of Online Shoppers in India. International Journal of Research and Innovation in Social Science, 5(11), 387–393.
- Ogunleye, A. A., & Akinbode, M. (2023). Effects of Service Quality and Perceived Value on Customer Loyalty and Satisfaction in the Nigerian Banking Sector. International Journal of Research and Innovation in Social Science, 7(3), 114–120.
- Kumar, S., & Singh, R. (2022). A Study on the Impact of Customer Expectations and Perceived Service Quality on Customer Satisfaction in the Telecom Sector. International Journal of Research and Innovation in Social Science, 6(5), 232–238.