
Factors that Affect Patients’ Use of the Santri Application in the Hospital in Sidoarjo
- Gunawan, Nur Baity Rahma Ramadhani
- 1054-1067
- Aug 9, 2023
- Public Health
Factors that Affect Patients’ Use of the Santri Application in the Hospital in Sidoarjo
Gunawan, Nur Baity Rahma Ramadhani
Department Medical Records and Health Information Ministry of Health Malang Health Polytechnic
DOI: https://dx.doi.org/10.47772/IJRISS.2023.70782
Received: 16 June 2023; Revised: 08 July 2023; Accepted: 12 July 2023; Published: 09 August 2023
ABSTRACT
This study aims to identify the variables influencing the utilization of the SANTRI application at Sidoarjo Hospital. Cross sectional research design for observations. The Technology Acceptance Model (TAM) questionnaire used in the collection is standard, 95 respondents make up the population, which is limitless. According to the findings, the highly accepted group includes the following: 76% perceived usefulness (PU), 76% perceived ease of use (PEU), 82% attitude towards adopting technology, and 80% behavioral intention to use (BU). These four elements’ effects on actual technology usage (ATU) were investigated in part, with the following findings: effect of PU on ATU = 0.001, effect of PEU on ATU = 0.016, effect of AT on ATU = 0.043, and effect of BU on ATU = 0.011. When four test values are 0.05, a substantial effect has been found. Significant findings (Sig = 0.000) were achieved when the four variables were tested simultaneously on the ATU variable. It can be said that the perceived utility, perceived simplicity, attitude toward utilizing technology, behavioral intention to use, and actual usage of technology all have an impact on how the SANTRI application is used in Sidoarjo Hospital.
Keywords: technology acceptance model, online registration
INTRODUCTION
Government Regulation of the Republic of Indonesia Number 46 of 2014, which states that data, information, and health indicators that are managed in the health information system (SIK) are required in order to support the implementation of health development, regulates the Indonesian health information system [1]. As healthcare facilities, hospitals are obligated by Article 3 of the Minister of Health Regulation Number 24 of 2022 to manage electronic medical records. An online registration system is one of the ways that electronic medical records are being implemented [2].
Through the use of the Android-based registration app SANTRI (Hospital Queuing System), TRSUD Sidoarjo has created an online-based registration application. According to a pilot study done at the Sidoarjo Hospital IT installation, SANTRI users accounted for 58% of all patients; however, SANTRI still frequently encountered faults, and studies regarding SANTRI acceptance had never been done. It is necessary to have a way for determining how well users or patients have accepted online registration applications. The Technology Acceptance Model (TAM) is the technique employed. The TAM model was developed to examine program usage from the user’s perspective. According to the TAM hypothesis, human behavior in accepting technology is explained by perceptions of its perceived usability, ease of use, and attitude toward using it, Behavioural Intention to Use It, and Actual Use of It [3].
The user’s perception of an application’s usefulness, perceived usability, perceived technological attitude, perceived ease of use, perceived user interest, and perceived user motivation all relate to how much the user wants to use the application. Perceived usefulness refers to the user’s perception that an application improves performance. consumers approach each of these views differently so that they can affect how technology is really used, which leads to the conclusion that consumers either embrace or reject a technology.
This study uses the TAM model, which is coupled with the growth of the trust variable, to gauge user adoption of the Santri application. The study is titled “Factors Influencing Patients on the Use of the SANTRI Application (Hospital Queuing System) in Sidoarjo Hospital Using the TAM (Technology Acceptance Model) Method” as a result.
This study’s stages are built upon a number of hypotheses that are then merged to create a research flow. Input: An analysis is required to determine the acceptance of the SANTRI application because it has been determined that the application frequently encounters error issues. The TAM technique is the model in use. Method: In order to gather data for an acceptability analysis test, questionnaires were given to patients via SANTRI. Output: It is hoped that following this evaluation, the results of the measurement of SANTRI’s acceptability would be used to help Sidoarjo Hospital develop SANTRI and enhance the standard of its services.
LITERATURE REVIEW
A medical record is a written record of a patient’s identity, examination, treatment, actions, and other provided services [2].
Medical records are kept to aid in the attainment of orderly administration as part of initiatives to enhance hospital healthcare. One of the determining variables in attempts to deliver health care in hospitals that can be accomplished or achieved if supported by a good and correct medical record management system is this administrative order [4].
The registration service transitions to an online registration application, and as a result, the application will be involved in the public service process. The application must pay attention to the principles of public service based on the Regulation of the Minister of Administrative Reform and Bureaucratic Reform of the Republic of Indonesia Number 15 of 2014 concerning Guidelines for Service Standards carried out with due regard to several aspects, including Simple Aspects [5].
Based on the theory of Edwin Wand and Gerald W. Brow, they argue in their book Essential of Educational of Education that evaluation refers to an action or process to determine the value of something. Evaluation is a structured activity for assessing a problem using instruments, and the results can be compared as benchmarks to obtain conclusions and solutions[6].
To assess a system, perception is needed, namely past testing, selection of things based on needs, ignoring disturbing things, and information that has been processed from the testing and selection. So it is concluded that perception is a cognitive process to select, organize, understand, and interpret a particular object into a complete picture[7].
Human perceptions related to the selection of a system will lead to attitudes.[8] argues that attitude is an evaluation of various aspects of the social world, which gives rise to likes and dislikes towards issues, ideas, social groups, or certain objects. So it can be concluded that attitude towards the use of technology is an evaluation of the use of technology regarding feelings of likes and dislikes for the use of this technology.
This attitude will determine whether the system is accepted through the user’s attitude.[9] stated that the behavior of users and system personnel is needed in system development. This relates to the understanding and perspective of the user of the system. So it can be concluded that the perception of people involved in implementing technology influences the end of a technology, whether the technology is accepted or not, useful or not if applied.
Based on the TRA (Theory of Reasoned Action) concept, TAM was created by [3]. Perceived usability and perceived ease of use are the two fundamental constructs of TAM. The TAM model helps describe how a user’s attitude toward using technology will depend on how he perceives it. The following is the Technology Acceptance Model (TAM) technique model.

Figure 1. TAM Theory
Perceived Usefulness is the degree of assurance that a technology improves its capabilities, making it valuable to users. The perceived ease of use and the degree of technology trust make jobs easier. Technology use attitudes and behaviors indicate whether people are accepting or rejecting technology. In order to forecast behavior and the intention to use technology, attitude towards utilization refers to a person’s attitude of enjoying or disliking a product [10]. The phrase “Behavioral Intention to Use” denotes a propensity to use technology in the future. Users will be content utilizing a technology if they think it is simple to use and boosts their productivity, as shown by the actual circumstances of use.
The TAM model states that perceived utility and perceived ease of use influence a person’s attitude toward using technology, which in turn determines whether or not people intend to utilize a technology (Behavioral Intention to Use). People’s intentions will determine whether they employ a technology.
THEORITICAL FRAMEWORK
In the TAM scheme, the benefits and convenience of influencing actual system use through an intervening variable, namely behavioral intention to use, state that behavioral intention to use and actual system use can be replaced by the Acceptance of IT variable. So the model to be used in this study is as follows:

Figure 2 Theoritical Framework
The first construct is perceived usefulness, hereinafter referred to as usability. Usability is defined as the extent to which a person believes that using technology will improve his job performance[3] This construct is influenced by the ease of use construct. Previous studies have shown that usability is the most significant and important construct that influences attitudes, intentions, and behavior[11].
The second construct is perceived ease of use, hereinafter referred to as ease of use. This construct influences the actual use, attitude, intention, and use of technology. But the most significant is the effect on the usability construct, while the effect on other constructs is not significant[11].
The third construct is attitude toward using technology, hereinafter referred to as attitude. Attitude can be defined as positive or negative feelings from someone if they have to do the behavior to be determined[3]. In the TAM model, attitude influences intention and is influenced by ease of use and usability.
The fourth construct is behavioral intention to use, hereinafter referred to as intention. Intentions have an influence on the actual use of technology and are influenced by attitudes and usage. The fifth construct is actual technology use, hereinafter referred to as actual technology use.
Hypothesis
- H1: There is a significant influence between perceived usefulness and actual use of technology.
- H2: There is a significant influence between Perceived Ease of Use and Actual Technology Use.
- H3 : There is a significant influence between Attitude towards Use of Actual Technology.
- H4: There is a significant influence between Behavioral Intention To Use on Actual Technology Use.
RESEARCH METHODS
In this study, the TAM (Technology Acceptance Model) was employed in a cross-sectional observational (quantitative) approach. Davis et al. introduced the Technology Acceptance Model (TAM) or technology acceptance model in 1989. The following conceptual framework scheme served as the foundation for each stage of the investigation.
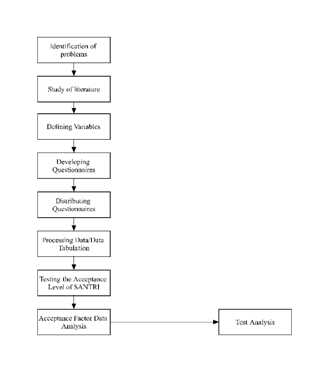
Figure 3. Research Framework
It was created at the research design stage, a comprehensive stage of the research being conducted, and it was based on the conceptual framework.
Finding the variables that take the form of X (Dependent) and Y (Independent) is the first stage. Application usability, application ease, application user attitude, and application user behavior make up variable X.
Application usability, user attitude, and user behavior.
The application user’s actual condition is represented by the variable Y. The creation of a questionnaire, which serves as a measurement indicator of the variables under study, is the second stage. An interval scale with a score range of 1 to 10 was used to calculate the questionnaire’s results, which were then given to respondents. The data will then be grouped and tabulated in order to further assess the viability of the SANTRI application. The researcher used the traditional assumption test, multiple linear regression test, T-test, and F test at this analytical stage to validate the findings.
Research Variable
- Independent Variables
Independent variables are variables that are causal factors that can affect the dependent variable. In this study, the independent variables are Perceived Usefulness, Perceived Ease of Use, Attitude toward Using Technology, and behavioral intention to Use.
- Dependent Variables
The dependent variable is a variable that is influenced by other variables. The dependent variable in this study is Actual Technology Use in the Santri application at Sidoarjo Hospital.
Research Population
The population in this study was outpatients using the SANTRI application (Hospital Queuing System). Based on data on outpatient visits in semester I of 2022, the percentage of student application users in semester 1 of 2022 was 58%, with a total number of approximately 167.780 visits. However, the number of patients using the SANTRI application cannot be predicted to visit the hospital when the research is being conducted. So that the population in this study cannot be determined with certainty as the sample, it is an infinite population[12].
Research Sample
The sample in this study was taken using the infinite formula according to Lame show theory [13]as follows:
![]()
Information:
n = Minimum sample size
Z1– α/2 = Standard normal distribution value
(Table Z) at a certain α
p = The price of the proportion in the
population
= Degree of inaccuracy
The level of inaccuracy taken is 0.1. According to[14] a population can be said to be large if the known population is greater than 100 respondents. So that the level of inaccuracy taken is 0.1, or 10%. Calculation as follows:

Sampling was done by purposive sampling. Purposive sampling is a sampling technique with certain considerations[15] The reason for using this purposive sampling technique is because it is suitable for use in quantitative research or studies that do not generalize, according to[15]. The inclusion and exclusion criteria of the samples taken are:
- Inclusion Criteria
- Outpatients at Sidoarjo Hospital who were receiving treatment at the time the study was carried out.
- Outpatients at Sidoarjo Hospital who use the SANTRI registration application (Hospital Queuing System) are aged 17–50 years.
- Outpatients at Sidoarjo Hospital who are users of the SANTRI registration application (Hospital Queuing System) and who are willing to be respondents.
- Exclusion Criteria
- Outpatients at Sidoarjo Hospital who are in an emergency condition such as unconsciousness, emergency room patients, or patients who are experiencing life-threatening conditions.
- Outpatients at Sidoarjo Hospital who experience communication disorders
In this study, inferential analysis was conducted through hypothesis testing methods. The analysis of the data used in this study is as follows:
Univariate Analysis
Univariate analysis was carried out to explain or describe the characteristics of the existing variables. In this study, univariate analysis was conducted by describing the characteristics of the score results in the respondents’ answers for each variable using the interval formula as follows:

Based on these calculations, the interval length is 3, so the following categories are obtained:
Table 1. Interval Categories
| No | Interval | Categories |
| 1 | 36-50 | Very Accept |
| 2 | 21-35 | Accept |
| 3 | 5-20 | Not Accept |
- Bivariate Analysis
Bivariate analysis is useful to determine the effect of two variables, namely the independent variable and the dependent variable. The statistical testing in this study is as follows:
- Classic assumption analysis
- Normality Test
- Multicollinearity Test
- Heteroscedasticity Test
- Multiple linear regression analysis
- Correlation analysis
- T-test
- F-test
RESULT AND DISCUSSION
Application simplicity, user mindset, and user behavior. The actual state of the application user is represented by the variable Y. The second phase involves creating a questionnaire that serves as a measurement indication for the variables under investigation. Respondents received the findings of the questionnaire, which were calculated using an interval scale with a score of 1–10 for the variables X and Y. To further assess the viability of the SANTRI application, the data are then grouped and tabulated. The traditional assumption test, multiple linear regression test, T-test, and F test were used by the researcher to test the analysis at this stage. Following is the order of the research phases:
Table 2. Respondent Characteristics
| Characteristics | Category | Frequency | Percentage |
| Gender | Male | 36 | 37,89% |
| Female | 59 | 62,10% | |
| Total | 95 | 100% | |
| Age | <17 | 0 | 0% |
| 17-28 | 28 | 29,47% | |
| 29-39 | 29 | 30,52% | |
| 40-50 | 38 | 40% |
The aforementioned data reveals that women make up the majority of responders, up to 59 or 62.10%, with a late adult age range (40-50 years) of 38 or 40%.
- Univariate analysis
- X1 for perceived usefulness.
Each question item will be tested using univariate analysis in the TAM test stages. Performance can be enhanced by the ease of use provided by the SANTRI application as measured by questions relating to the application’s credibility as follows:
Table 3. X1 Questions
| No | Questions |
| 1 | Using the SANTRI application helps me register patients more quickly. |
| 2 | Using the SANTRI application helps me improve my performance. |
| 3 | The use of the SANTRI application increases the effectiveness of patient registration. |
| 4 | Using the SANTRI application makes it easier for me to register patients. |
| 5 | Overall, the use of the SANTRI application is very useful to me. |
The research findings on variable X1 as a whole receive a score of 76%, indicating that the respondents strongly support it. By allowing users to register from any location, the SANTRI application can streamline and accelerate the online patient registration process, reduce patient wait times, and enhance the caliber of hospital services. The technology can facilitate and expedite transaction activities, according to research [16]. Because so many users are still unable to use the SANTRI program to its full capacity, just 24% of users have fully embraced it. The usability of a system is one of the most crucial variables determining user adoption since it facilitates and speeds up transaction processes, according to studies on perceived usability by [17].
- Perceived Ease of Use (X2)
Measured by asking users questions about how simple it is to learn and utilize the SANTRI application as follows:
Table 4. X2 Questions
| No | Questions |
| 1 | I think using the SANTRI application is easy to learn. |
| 2 | In my opinion, getting the information I need from the SANTRI application is easy. |
| 3 | In my opinion, the SANTRI application uses language that is easy to understand. |
| 4 | The menus in the SANTRI application are well structured so that the available features are easy to use. |
| 5 | In my opinion, the SANTRI application is very flexible for interaction. |
| 6 | In my opinion, the steps for using the SANTRI application are easy to remember. |
According to the study’s calculations, 78% of respondents fell into the category of very welcoming people. The SANTRI application is touted as being simple since the system is simple to understand and can be accessed with just one grip of a smartphone. [18] States that a person’s perception of a system’s perceived ease is their belief that using the technology doesn’t take much effort. Since most SANTRI users are between the ages of 40 and 50, they have not yet been able to fully adjust to information systems, which accounts for the percentage of 22% who have yet to obtain the Santri application. This is in line with research by [19], which asserts that perceived ease includes ease of use, learning, and convenience of doing a task.
- Attitude Towards Using Technology (X3)
By asking them questions about their trust in and comfort using the SANTRI app as follows:
Table 5. X3 Questions
| No | Questions |
| 1 | I feel happy using the SANTRI application. |
| 2 | I feel comfortable when using the SANTRI application. |
| 3 | I enjoy using the SANTRI application. |
The calculations’ findings indicate that 82% of respondents’ scores are highly acceptable. In keeping with the idea put forth by [20] that a system’s acceptance or rejection is based on the user’s conduct and attitude. This ease of use is a result of the SANTRI application’s straightforward interface design, which enables it to give consumers a light user experience. However, the SANTRI application has still not been received by 18% of responders. This is brought on by application problems, which frequently happen during open registration hours, according to the findings of observations. Additionally, issues with logging into the application make users uncomfortable. Theoretically, [21] behavioral attitudes will generate accurate or inaccurate information, leading to the development of either positive or negative attitudes.
- Behavioral Intention to Use (X4)
Based on user surveys that ask about how frequently they use the SANTRI app as follows:
Table 6. X4 Questions
| No | Questions |
| 1 | I want to use the SANTRI application when registering or registering patients. |
| 2 | I intend to continue using the SANTRI application to register patients. |
| 3 | I hope to continue using the SANTRI application in my registration orregistration process when seeking treatment at Sidoarjo Hospital. |
| 4 | I want to motivate others to use the SANTRI application. |
The calculations’ findings indicate that the 80% response rate is a very acceptable score. This demonstrates that patients’ interest in signing up for the SANTRI application has been very intense. According to research by [22], the behavioral intensity of using an information system refers to the desire to make usage of it a habit and continue doing so. About 20% of responders, according to the calculation findings, have not yet received their SANTRI applications. This may be brought on by users losing interest in the SANTRI application due to a lack of information regarding service availability. According to research by [23], a system’s user acceptance is also influenced by a user’s behavioral intention to utilize it.
- Actual Technology Use (Y)
By asking users how satisfied they are with using the SANTRI application as follows:
Table 7. Y Questions
| No | Questions |
| 1 | I use the SANTRI application every time I register or register a patient. |
| 2 | I am satisfied using the SANTRI application. |
According to the research done by [24], this Y variable describes the actual circumstances under which people utilize information technology systems. A person is content with a system if they think it is simple to use and enhances performance. According to the calculations, 89% of respondents indicated that they were highly accepting, indicating that the users were extremely satisfied. The satisfaction of the respondents demonstrated user interest from registration, identification entry, and receipt of a QR code. Furthermore, 11% or so of respondents said they had not received the SANTRI application. This resulted from user expectations that the SANTRI application was unable to meet. Users may feel dissatisfied with the SANTRI program because it still frequently encounters difficulties and no new features are being added to the Android or iOS operating systems. This is consistent with research showing that system quality influences user satisfaction positively [25].
- Bivariate Analysis
To identify the issues with multiple linear regression, the traditional assumption testing method is used. The normality test, multicollinearity test, and heteroscedasticity test were used to evaluate the traditional hypotheses. The data is normal distributed since the normality test only requires one straightforward Kolmogrov–Smirnov test with a probability value greater than 0.05.
Table 8. Normality Test
| One-Sample Kolmogorov-Smirnov Test | ||
| Unstandardized Residual | ||
| N | 95 | |
| Normal Parametersa,b | Mean | .0000000 |
| Std. Deviation | 1.75082103 | |
| Test Statistic | .084 | |
| Asymp. Sig. (2-tailed) | .097c | |
The data are normally distributed according to the results of the normality test, which were 0.084 and 0.097>0.05, respectively. The correlation between the independent variables is then ascertained using the multicollinearity test results. The categories in the multicollinearity test are determined by the tolerance value > 0.10 and the variance inflation factor (VIF) value 10. Results of the multicollinearity test are shown in the table below.
Table 9. Multikolinearity Test
| Model | Collinearity Statistics | |
| Tolerance | VIF | |
| 1 (Constant) | ||
| X1 | .897 | 1.115 |
| X2 | .833 | 1.201 |
| X3 | .872 | 1.146 |
| X4 | .768 | 1.303 |
Since there is no correlation between the independent variables and the VIF and tolerance values, according to the above table, the regression model is sound and complies with the conditions for data normality. The heteroscedasticity test results are used to compare the variance of the residuals between two observations in order to identify any differences. the category of the heteroscedasticity test with a sig value greater than 0.05 or 5% The test for heteroscedasticity yielded the following results:
Table 10. Heteroscedasticity Test
| Model | Nilai Sig. |
| X1 | 0,072 |
| X2 | 0,900 |
| X3 | 0,429 |
| X4 | 0,65 |
Based on the aforementioned table, the sig value is greater than 0.05 or 5%, which ensures that none of the independent variables employed in this study exhibit heteroscedasticity-related symptoms.
Multiple Linear Regression Test
Table 11. Multiple Linear Regression Test
| Model | Koef. Regresi | t-statistik | Sig t |
| X1 | 0,078 | 3,306 | 0,001 |
| X2 | 0,059 | 2,446 | 0,016 |
| X3 | 0,103 | 2,051 | 0,043 |
| X4 | 0,094 | 2,605 | 0,011 |
The test results produced the equation
y = 6.424 + 0.078X1 + 0.059X2 + 0.103X3 + 0.094X4 + 0
of the multiple linear regression model. A significance level of 0.05 is assigned to the conclusion of the multiple linear regression analysis of all independent variables.
Determination Test
To determine how interconnected the variables are, a determination test is performed. The determination test’s outcomes are as follows:
Table 12. Determination Test
| Korelasi Determinasi | |
| R | Adjusted R Square |
| .615a | .350 |
The coefficient of determination is 35% according to the findings of the correlation test utilizing determination. As a result, the four independent factors only account for 35% of the variance in the dependent variable, with the remaining 65% being explained by additional variables not taken into account in this study’s regression model.
Testing hypotheses
The t test is used to examine the impact of each independent variable on the dependent variable. with the presumption that H0 is accepted if t count t table and rejected if t count > t table. The following are the findings of the t test using SPSS version 25:
Table 13. T Test
| Variabel Independen | Nilai t-hitung | Nilai Sig. |
| X1 | 3,306 | 0,001 |
| X2 | 2,446 | 0,016 |
| X3 | 2,051 | 0,043 |
| X4 | 2,605 | 0,011 |
The obtained sig value was alpha 0.05 and was based on the findings of the hypothesis testing. In light of this, it can be said that all hypotheses are valid. This indicates that the variables Actual Using Technology (Y) is influenced by the factors Perceived Usefulness (X1), Perceived Ease of Use (X2), Attitude Towards Using Technology (X3), and Behavioral Intention to Use (X4). The F test is used to evaluate the impact of the independent factors on the dependent variable concurrently. Using the presumption that the independent variables will influence the dependent variable simultaneously if sig 0.05. The following are the outcomes of the F test using SPSS version 25:
Table 14. Anova Test
| ANOVAa | |||
| Model | F | Sig. | |
| 1 | Regression | 0,000 | 0,000a |
| Residual | |||
| Total | |||
The independent factors concurrently (simultaneously) affect the dependent variable, according to the findings of the F test computations.
The government’s policies on the implementation of health information systems are manifested in the online registration form. Information systems contribute to the establishment of a sustainable health system by fostering collaboration, coordination, and integration. This study demonstrates how real circumstances of usage or acceptance of the SANTRI application itself are influenced by the advantages of use, simplicity of use, attitude, and intention to use. According to the findings of statistical testing, respondents believe that the SANTRI application improves service and saves time. They also find it to be simple to use and comprehend. According to the study, there are 5 criteria that affect patient acceptability of using the Santri application at Sidoarjo Hospital, including perceived usefulness (X1), Perceived Ease of Use (X2), Attitude Towards Using Technology (X3), Behavioral Intention to Use (X4) and Actual Technology Use (Y).
According to research [26], the user-friendliness and intent of users affect how the Fatmawati Hospital’s online registration system is used. Users will find an application more appealing if it is adaptable, simple to use, and easy to understand. According to research by [27], user acceptability of the ALISTA application is determined by both the user’s actual usage circumstances and attitude toward the system. There are still some restrictions in this study. Additional research is required, taking a look at a number of other factors that might influence whether the SANTRI proposal is accepted.
The variables included in this study differ from similar studies that have been conducted. This study combines all the elements of TAM into constructs that are assumed to affect the real use of the system. Similar research was conducted by[28], acceptance of online registration applications at K.R.M.T. Wongsonegoro Hospital was examined with the variables perceived ease of use, perceived usefulness, and behavioral intention to use. Then the Nutrition Evaluation Study at the Trenggalek Health Service by[29] used the variables Perceived ease of use, perceived usefulness, behavioral intention to use, Attitude Toward Using, Computer self-efficacy, and Gender. Therefore, this study has outcome measurement indicators that differentiate it from similar studies.
Acceptance of the hypothesis partially or simultaneously in this study shows that each of the variables studied is a factor that can influence the real use of the SANTRI application by patients at Sidoarjo Hospital. This real use is an illustration of patient acceptance of the online registration system provided by the hospital. With the acceptance of the system, it can be said that the SANTRI application has achieved its goal of facilitating patient registration and has more or less been able to meet the expectations of patients regarding the description of a system that makes work easier and easy to learn.
CONCLUSION
Based on the results of the analysis tests carried out in this study, there are some limitations in the delivery of results that are influenced by the correlation value between variables, which is only able to explain 35%. So that there is still a need for further studies by including several other variables that can affect the acceptance of the SANTRI application. Such as user characteristics, namely gender, demographics, education, frequency of visits to the hospital, and a more comprehensive research description. Therefore, it can provide real and realistic results related to factors that affect real conditions in the use of the SANTRI application.
Respondents frequently voiced complaints about difficulty logging in, applications that malfunctioned when utilized, and the application’s operating system, which was still restricted to the Android system, which resulted in a narrow application coverage. With data integration, application simplicity, and the creation of an innovation ecosystem, it is envisaged that review and innovation will take place, particularly in support of the digital transformation of the health sector. It is hoped that this change will lead to evaluations that can help Indonesia Health Services (HIS) be implemented [30].
REFERENCES
- Kemenkes RI, “PP Nomor 46 Tahun 2014”.
- Kemenkes RI, “Permenkes Nomor 24 Tahun 2022,” Kemenkes RI, no. 8.5.2017, pp. 2003–2005, 2022.
- F. D. Davis, “Perceived Usefulness, Perceived Ease of Use, and User Acceptance of Information Technology,” 1989.
- Konsil Kedokteran Indonesia, “Manual Rekam Medis,” Buku Manual Rekam Medis, vol. Depkes. (2, p. 23, 2006.
- D. F. Septarini, “Pembuatan front-end pada aplikasi thrift shop berbasis website dengan metode user centered design laporan skripsi,” 2021.
- Gerald W. Wandt Edwin and Brown, Essentials for Educational Evaluation. Henry Holt and Co, 1957.
- H. Leavitt, L. Pondy, and D. Boje, “Readings in Managerial Psychology,” Bibliovault OAI Repository, the University of Chicago Press, Jul. 1973.
- Robert A. Baron dan Donn Byrne, Psikologi sosial jilid 1, 1st ed. Jakarta : Erlangga , 2004, 2007.
- R. Trisnawati, “Pertimbangan perilaku dan faktor penentu keberhasilan pengembangan sistem informasi”.
- J. G. M. David A. Aaker, Rajev Batra, Advertising management. 1997.
- H. M. Jogiyanto, “Analisis dan desain sistem informasi.” Yogyakarta: Andi Offset”.
- M. Churiyah and D. Hagayuna, “Faktor-Faktor Yang Menentukan Perilaku Pembelian Mi Instan Merek Sedaap (Studi Pada Konsumen Kecamatan Pakis Kabupatan Malang),” Jurnal Ekonomi Modernisasi, vol. 3, Jul. 2007, doi: 10.21067/jem.v3i3.944.
- S. LEMESHOW, Besar sampel dalam penelitian kesehatan. Yogyakarta : Gadjah Mada University Press , 1997, 1997.
- Husein Umar, Desain Penelitian Manajemen Strategik. Rajawali Pers , 2010, 2010.
- Prof.Dr.Sugiyono, Metode Penelitian Kuantitatif, Kualitatif Dan R&D. Penerbit Alfabeta , 2016, 2016.
- A. M. , & dan J. Sarce, “05 Februari 2019 Fakultas Ekonomi dan Bisnis Universitas Islam Malang 109.”
- C. Gardner and D. Amoroso, “Development of an Instrument to Measure the Acceptance of Internet Technology by Consumers.,” May 2004. doi: 10.1109/HICSS.2004.1265623.
- M. Syahidah, “Pengaruh Manfaat Yang Dirasakan (Perceivedusefulness) Dan Kemudahan Penggunaan Yangdirasakan (Perceived Ease Of Use) Terhadap Minat Untukterus Menggunakan (Behavioral Intention To Use)Virtual Class Universitas Lampung(Studi pada Mahasiswa Jurusan Hubungan Internasional UniversitasLampung Angkatan 20,” 2020.
- N. J. Edy Susanto, “Pengaruh Persepsi Penggunaan Technology Acceptance Model (Tam) Terhadap Penggunaan E-Filling”.
- H. C. Triandis, “Values, Attitudes, and Interpersonal Behavior”.
- Icek Ajzen, “Attitudes, personality, and behavior,” 1975.
- E. Fatmawati, “Technology Acceptance Model (TAM) untuk Menganalisis Penerimaan terhadap Sistem Informasi di PerpustakaanM INFORMASI PERPUSTAKAAN,” Iqra: Jurnal Perpustakaan dan Informasi, vol. 9, no. 1, 2015.
- Yi-Shun Wang, “Assessing e-commerce systems success: A respecification and validation of the DeLone and McLean model of IS success,” i-Shun Wang, 2008.
- A. Wibowo, “Kajian Tentang Perilaku Pengguna Sistem Informasi Dengan Pendekatan Technology Acceptance Model (TAM),” May 2008.
- A. N. Zaied and H. Zaied, “An Integrated Success Model for Evaluating Information System in Public Sectors,” Journal of Emerging Trends in Computing and Information Sciences, vol. 3, pp. 814–825, May 2012.
- N. A. Rumana, E. I. Apzari, D. R. Dewi, L. Indawati, and N. Yulia, “Penerimaan Pasien Terhadap Sistem Pendaftaran Online Menggunakan Technology Acceptance Model di RSUP Fatmawati,” Faktor Exacta, vol. 13, no. 1, p. 44, Jun. 2020, doi: 10.30998/faktorexacta.v13i1.5611.
- T. Irawati, E. Rimawati, and N. A. Pramesti, “Penggunaan Metode Technology Acceptance Model (TAM) Dalam Analisis Sistem Informasi Alista (Application Of Logistic And Supply Telkom Akses),” is The Best Accounting Information Systems and Information Technology Business Enterprise this is link for OJS us, vol. 4, no. 2, pp. 106–120, 2020, doi: 10.34010/aisthebest.v4i02.2257.
- F. H. Dinata, I. Nurmawati, and I. Muflihatin, “Evaluasi Sistem Pendaftaran Online dengan Metode Technology Acceptance Model di Rumah Sakit Umum Daerah KRMT Wongsonegoro Kota Semarang,” J-REMI: Jurnal Rekam Medik dan Informasi Kesehatan, vol. 1, no. 3, pp. 226–233, 2020.
- W. W. Winarno et al., “Evaluasi SIGIZI di Dinas Kesehatan Kabupaten Trenggalek dengan pemodelan Extended TAM,” Seminar Nasional Teknologi Informasi dan Multimedia 2014, vol. 2, no. 1, pp. 47–52, 2014, [Online]. Available: https://ojs.amikom.ac.id/index.php/semnasteknomedia/article/view/493
- Kemenkes RI, “Kemenkes Luncurkan Platform SATUSEHAT Untuk Integrasikan Data Kesehatan Nasional – Sehat Negeriku.”