
Statistical Evaluation of Webometric Analysis of Tourism Websites in ASEAN Countries
- Muhammad Fakruhayat Ab Rashid
- Sharifah Rohayah Sheikh Dawood
- 2389-2406
- Mar 26, 2024
- Education
Statistical Evaluation of Webometric Analysis of Tourism Websites in ASEAN Countries
Muhammad Fakruhayat Ab Rashid1 & Sharifah Rohayah Sheikh Dawood1*
1Geoinformatic Unit, Geography Section, School of Humanities, Universiti Sains Malaysia, 11800 USM, Pulau Pinang, Malaysia.
*Corresponding Author
DOI: https://dx.doi.org/10.47772/IJRISS.2024.802171
Received: 13 February 2024 Accepted: 20 February 2024; Published: 26 March 2024
ABSTRACT
The webometric study analysis utilizes SimilarWeb, a tool designed for market intelligence to assess and evaluate various aspects of tourism websites. The objective of this study is to conduct a comprehensive review of these websites, focusing on their global and local standings, sources of traffic, user demographics, performance indicators, external sites directing traffic, and the influence of social media during the months of September to November 2023. The study examines how users interact with these websites and their overall traffic to understand how the internet is used within the ASEAN region. The research contributes to the field of webometrics, which is the study of the quantitative aspects of the construction and use of information resources, structures, and technologies on the web. It also provides insights that could improve digital marketing for tourism websites in ASEAN. The analysis reveals that Malaysia’s “tourism.gov.my” is performing notably well on a global scale, boasting a high global ranking at #14,949 and a strong presence within the country, indicating a solid online reputation in the world of tourism. The data also underscores the importance of Google as a source of organic traffic, emphasizing the need for effective SEO strategies to ensure visibility in search results. Vietnam’s tourism website is highlighted for attracting the highest number of visits, suggesting that the country’s online engagement tactics are resonating with users. Both Vietnam and Malaysia are identified as having robust performance metrics, an indicator of successful user engagement strategies. Furthermore, the study points out that the websites of the Philippines, Singapore, and Malaysia serve as significant referrers, which means they are important in directing visitors to other sites. This reflects the interconnected nature of these platforms and their role in enhancing a website’s overall online presence.
Keywords: statistical evaluation, webometric analysis, tourism, ASEAN
INTRODUCTION
Tourism industry has been a fascinating phenomenon for the countries of ASEAN since tourism sector may contribute significantly to ASEAN countries’ GDP. The higher the GDP, the better a country’s financial condition, where the GDP itself may be produced from certain industries, one of which is tourism. Every country wishes to increase national production growth over a certain time period (Rahardja and Manurung, 2004). As a result, the number of national outputs may indicate certain significant aspects of the economic sector. Tourism is one of the industries that may contribute to national production. Because most countries in ASEAN have numerous beautiful areas, the tourism business is quite essential to countries.
In the past few years, ASEAN tourism has expanded a lot. The economies of the ASEAN member states could get better because of tourism sector. In 2011, the World Economic Forum (WEF) reported that the tourist industry contributed 4.6% to the GDP of ASEAN countries (Moenir, 2017). The United Nations World Tourism Organization (UN-WTO) stated that Southeast Asia is the part of the Asia-Pacific area that foreign tourists visit the most. The goal of every ASEAN country is to raise its GDP because that means the economy is doing well in that country. However, ASEAN countries’ GDP always changes. The tourism indicator can determine changes of GDP in ASEAN countries. The measure can be divided into two parts: tourists arriving and tourists spending money (Phiri, 2015). ASEAN countries, especially their governments, can see changes in the number of tourists coming to their countries and the money they bring in from tourism. This helps them make the right decisions about how to raise their own GDP.
In the 21st century, information and communication technologies (ICTs) have significantly impacted tourism. Several experts have studied the impact of ICT on tourism services and their competitiveness in recent years because of the importance of innovations in the tourism sector. Tourism is a rapidly growing industry in ASEAN countries from an economic perspective. As one of the fastest-growing communications mediums in history, the Internet has indeed become a significant development in communications. Mobile phones, radios, and televisions have all been overtaken by its diffusion. When integrated with other Internet functionalities, the World Wide Web has been hailed as a powerful marketing tool. Tourism industry in ASEAN countries has taken advantage of this and has used the Internet to reach out to potential tourists. Businesses have taken advantage of the internet to access new markets, promote their products and services, and create better customer service. As a result, tourism in ASEAN countries has flourished. Additionally, the high percentages of Internet users in the top tourism-spending countries contribute to the enhancement of this potential.
Webometric analysis of tourism websites in ASEAN countries is an important research area that covers various topics, such as the influence of the internet on tourism management, the connection between macroeconomic factors and tourism demand, and the impact of tourism sectors on economic development (Buhalis & Law, 2008). Webometric analysis provides a thorough assessment of previous research on the use of the Internet in the field of tourism, with a particular focus on the importance of understanding the current status of eTourism research (Buhalis & Law, 2008; Pinjaman & Pawan, 2021). Pinjaman and Pawan (2021) performed a research to identify the primary determinants of tourist demand in ASEAN-5 nations, emphasizing the significance of macroeconomic variables in influencing tourism demand. In a study conducted by Sundoro & Soeprapto (2018), the impact of the tourism sector on the GDP of the ASEAN countries was investigated. The study focused on the economic consequences of the tourism business, specifically looking at tourist arrivals and tourism revenues (Sundoro & Soeprapto, 2018).
In addition, Wannapan et al., (2018) examined the relationship between tourism demand and economic growth in ASEAN-3 countries. Their study revealed insights into the connection between tourism demands and the economy, and offered suggestions for effective tourism policies (Wannapan et al., 2018; Gupta & Utkarsh, 2014). Gupta and Utkarsh (2014) performed a content study on the official tourism websites of leading tourist destinations, emphasizing the importance of website effectiveness in attracting travelers. Moreover, Subandi & Putra (2017) highlighted a lack of research on the examination of local tourist office websites, specifically those pertaining to Indonesia’s most important locations, emphasizing the need for thorough website assessments (Subandi & Putra, 2017).
Furthermore, Li and Wang (2010) conducted an assessment of the efficacy of destination marketing organizations’ websites, highlighting the significance of evaluating online promotion evaluation tools for reviewing national tourist organization websites globally (Li & Wang, 2010). In addition, Yekini et al. (2022) emphasized the importance of web content, web technology, web use, and web link analysis as characteristics for rating institutions in webometrics (Yekini et al., 2022). The combination of these sources highlights the complex and diverse characteristics of webometric analysis of tourism websites in ASEAN countries. This analysis encompasses various aspects, including the influence of the internet on tourism management, the connection between macroeconomic factors and tourism demand, and the efficacy of tourism websites in attracting visitors.
ASEAN tourism website has not been analyzed very comprehensively by academic research until now (December 2023). Similar studies have been conducted previously in the context of the evaluation of website content and functionality (Scott & Baggio, 2009), but not to provide a detailed overview of search engine results. In order to develop an analysis and evaluation of ASEAN’s tourism websites based on Search Engine Optimization (SEO) rank, this paper uses the SimilarWeb online tool to analyze and evaluate ASEAN’s tourism websites on the basis of SEO rank in detail. Webometric analysis provides a more comprehensive and objective view of web phenomena than traditional bibliometric methods. By analyzing web content, technology, usage, and web links, webometric analysis can provide a more comprehensive view of how the web is affecting different research areas and industries. Additionally, it can be used to assess the impact of web technologies on research collaboration and industry, as well as to evaluate the effectiveness of digital reference tools disseminating tourism information. The approach enables researchers to explore the relationships between different web technologies, such as the impact of web technologies on research collaboration, the effectiveness of digital reference tools, and the spatial-temporal transfer of research topics. It also allows researchers to gain a better understanding of how web technologies are being used in industry, as well as to assess the impact of web technologies on research collaboration and industry. Overall, webometric analysis provides a comprehensive framework for understanding and evaluating web-based phenomena across various domains. Overall, webometric analysis has significantly contributed to understanding and evaluating web-based phenomena across diverse fields, making it a valuable tool for research and assessment in the digital age.
LITERATURE REVIEW
Academic research has shown that ASEAN tourist websites are getting a lot of attention. This highlights the significance of online platforms in shaping tourism trends. The webometric approach helps us understand how tourism agencies and governments use the internet, and whether their efforts are successful. It also shows how online platforms and technologies can help inform and attract potential tourists. Pinjaman and Pawan (2021) conducted a study on the relationship between economic indicators and tourism trends in nine ASEAN countries. This research shows that tourist demand is complex and has many different aspects. It emphasises the importance of understanding the overall economic situation in order to manage tourism effectively. The study found that using online platforms is a good way to reach potential tourists and give them accurate and current information about the destination. Tourism operations can be improved by using them to track and monitor tourism trends and economic indicators. By understanding how these factors are related, people involved in tourism can make smart choices about how to handle tourism in their own countries. Webometric analysis is a modern way of studying and evaluating tourist websites. It is based on bibliometrics and is becoming more popular. Muniyasamy and colleagues (2023) focused on a less explored topic in webometric research by studying tourist sites in India. Webometric research can provide valuable insights into the digital presence of tourist websites. Thelwall (2008) conducted a detailed study on webometrics, highlighting its rapid growth and significance in the field of computer science. In 2022, Ghosh and Kumar studied how link analysis and visibility of agricultural digital archives’ websites in Africa can be analysed using webometric analysis. They found that webometric analysis can be used in various fields.
Yassin et al., (2020) studied how digital platforms affect tourist destinations. They examined at how tourism density affects the environmental performance index in ASEAN countries. This study shows that tourism activities and environmental sustainability are connected, and it suggests using webometric analyses to understand how tourism websites affect the environment. Akbar et al., (2022) analysed the tourism websites of Bali and North Sumatra Province to see how effective they are at promoting their regions. They found interesting information about the strategies used by each region. This study highlights the importance of using webometric evaluations to measure how effective tourism websites are at attracting visitors and promoting different destinations. In addition, Giannakoulopoulos et al., (2019) studied how well institutional and open repositories with scientific literature can be used to find tourism information online using webometric analysis. In 2022, Bakkiyaraj and Kalidasan conducted a study on physical education institutions in India. They used webometric analysis to evaluate the quality of their websites. This study showed how webometric analysis can be used to assess the online presence of educational institutions. In their study, Sharul et al., (2021) developed a new framework that uses machine learning techniques to automatically classify web pages of academic websites. They focused on webometrics and web usability and showed how advanced technologies can be integrated into webometric analysis.
In addition, a study by Wannapan et al., (2018) examined at how tourism affects the economy in ASEAN-3 countries. They found useful information about how tourism and economic indicators are connected. This research highlights the importance of using webometric analyses to inform strong tourism policies that promote sustainable economic development. The literature review shows that there are many different things that affect tourism in ASEAN countries. These include things like the economy and the environment. These studies show how important it is to use webometric analyses to understand and handle the complexities of tourism in the digital age. Sarwar et al., (2021) said that webometric analyses are important for understanding websites and web pages. They are useful for assessing the digital presence of tourism websites. In their study, Kertamukti et al., (2021) used a qualitative approach to analyse information sources, website structure, and technology. They also used bibliometric and infometric approaches to show how webometric analysis can have multiple dimensions. Wahyuningrum et al., (2021) studied the Timor Leste University website during the COVID-19 pandemic. They used webometric analysis to show how this method can be used to evaluate websites during changing times. The research on webometric analysis of tourism websites shows that it is useful for evaluating the online presence, visibility, and impact of tourism-related digital platforms.
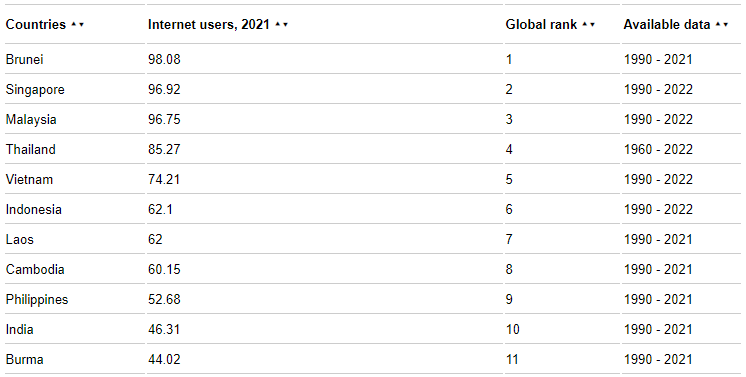
Figure 1. Internet user in South East Asia 1990-2021
Source: (The Global Economy.com, 2021)
METHODOLOGY
Tourism websites have been selected from the official websites of each ASEAN country’s Ministry of Tourism. Researchers analyze all selected websites using online tools such as SimilarWeb (http://SimilarWeb.com). Different research studies have used the SimilarWeb tool to assess the digital presence, visibility, and impact of websites. The SimilarWeb tool measures the number of unique visitors to a website, the number of page views, and the amount of time they spend on a website. By analyzing this data, researchers can gain insights into how well a website is performing in terms of digital presence and visibility, as well as its potential impact on tourism. In order to increase the visibility of tourism websites on search engines, Search Engine Optimization (SEO) techniques are essential. The goal is to improve organic search rankings and increase traffic to the website by optimizing content, meta tags, and keywords (Tavosi & Naghshineh, 2022). By providing insights into keyword rankings, backlink profiles, and overall website visibility, SEO tools help evaluate the effectiveness of these techniques. SimilarWeb can also be used to analyze web traffic, user engagement, and visitor behavior on tourism websites. Website traffic sources, audience demographics, and popular content can be analyzed using SimilarWeb to understand tourism websites’ web presence (Jansen et al., 2022).
Furthermore, the tool provides an in-depth analysis of the domain’s visibility in search engines, including the top keywords used to access the domain, the overall number of visits, the average number of visits per day, the number of referring domains, and more. This analysis helps to demonstrate the effectiveness of the domain’s online presence for disseminating scholarly information. Researchers can assess web visibility, societal interests, scholarly impact, and ranking of digital platforms across a variety of domains using the SimilarWeb tool in webometric analysis. A webometric analysis using SEO and tools such as SimilarWeb involves utilizing SEO techniques, benchmarking website performance, analyzing web traffic, and evaluating webometric ranking indicators. Using these methodologies, researchers can assess the web presence and visibility of tourism websites in the ASEAN region. In this analysis, researchers will analyze global and country rankings, traffic sources and channels, demographic insights, performance metrics, referring websites, and social media impact in the period from September 2023 to November 2023.
Table 1. Websites considered for the present evaluation
| Country | URL |
| Malaysia | https://www.tourism.gov.my |
| Singapore | https://www.visitsingapore.com |
| Brunei | https://www.bruneitourism.com |
| Thailand | https://www.tourismthailand.org |
| Philippines | https://beta.tourism.gov.ph |
| Vietnam | https://vietnam.travel |
| Cambodia | https://tourismcambodia.org |
| Indonesia | https://www.indonesia.travel |
| Laos | https://www.tourismlaos.org |
| Myanmar | https://www.tourism.gov.mm |
Source: Authors, 2023
RESULT AND DISCUSSION
This study examines the online tourism website from September to November 2023 in the domain of tourism websites. In our analysis, we carefully examine various tourism-related platforms in order to assess their online website and user engagement strategies. This study’s dataset consists of a wide range of global and regional tourism websites. Our focus is on understanding the dynamics of web traffic, user demographics, and the impact of various digital channels.Top of Form
Global, Country, and Industry Rankings
Figure 2 shows rankings for tourism-related websites from September 2023 to November 2023, providing a comprehensive view of their global, country-specific, and industry rankings. Malaysia’s official tourism website, tourism.gov.my, holds the #655,775 position in ASEAN countries, indicating its global reach and popularity. Unlike other websites, visitsingapore.com has a significantly lower global ranking at #67,020, indicating a weak online presence. Tourismthailand.com is ranked #127,309 worldwide, while bruneitourism.com is ranked #2,642,128 globally. There is no global rank for beta.tourism.gov.ph, suggesting that relevant data might not be available. In terms of country-specific rankings, tourism.gov.my places at #14,949 while visitsingapore.com is positioned at #6,033, which signifies the site’s position at the top of the rankings. In the category Tourism/Travel and Tourism – Other, tourism.gov.my ranks at #10,925, bruneitourism.com at #905, tourismthailand.com at #41,854, and beta.tourism.gov at #37,471. By analyzing the data, valuable insights are gained regarding the comparative online visibility and popularity of tourism websites on a global, country, and industry level.
The figure 3 shows that vietnam.travel secures a notable position at #204,823, which demonstrates its global reach. However, tourismcambodia.org has a higher global ranking, at #1,643,611. There is a strong ranking for the website indonesia.travel at #149,166, while tourismlaos.org and tourism.gov.mm have positions at #3,803,709 and #500,300 respectively. According to Vietnam’s country-specific ranking, vietnam.travel is ranked #19,542. Vietnam.travel is ranked #2,955 in the Tourism/Travel and Tourism industry rankings, demonstrating its prominence in the field. The websites tourismthailand.org and indonesia.travel rank at #27,709 and #2,070 respectively. In terms of tourism/travel and tourism, tourismlaos.org and tourism.gov.mm hold positions #54,579 and #8,071 respectively. By examining this data, we gain a deeper understanding of the digital prominence and influence of these tourism websites on a global scale, within specific countries, and within the tourism industry.
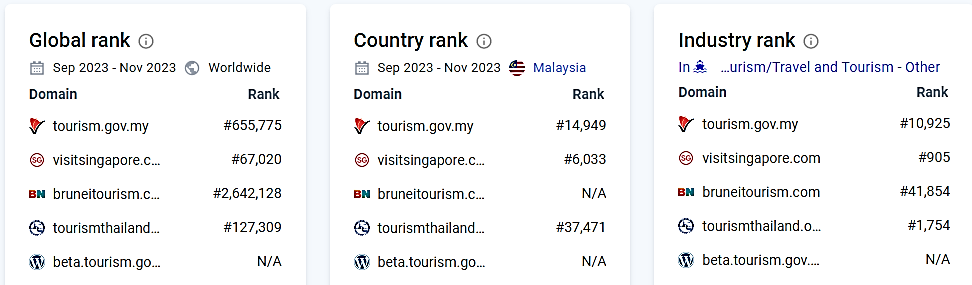
Figure 2. Overview global, country, and industry rankings in five ASEAN countries
Source: Authors, 2023

Figure 3. Overview global, country, and industry rankings in five ASEAN countries
Source: Authors, 2023
Traffic and Engagement
Figure 4 provides insight into the total number of visits and device distribution for various tourism-related websites between September 2023 and November 2023. A significant number of 114,545 visits to tourism.gov.my indicate a noteworthy global engagement. Singapore’s website visitsingapore.com is close behind, with an undisclosed number of visits of 3.328 million. A comparison of the websites bruneitourism.com and tourismthailand.org reveals that they have respectively received 35,116 and 1.529 million visits, which is indicative of their global digital footprints. The data reveal interesting patterns when examining the distribution of devices. The majority of visitors to tourism.gov.my (62.2%) come from mobile devices, while visitsingapore.com experiences 76.5% of its traffic from mobile devices. The website bruneitourism.com shows a balanced distribution with 55.1% coming from desktops and 44.9% coming from mobile devices. Website of tourismthailand.org and beta.tourism.gov.ph display varying patterns of usage, with the former receiving 38.3% of visitors from desktop and the latter receiving 61.7% from mobile devices. The results of this study emphasize the importance of understanding user behavior across devices in order to develop an effective digital strategy and engage the tourism sector.
In Figure 5, the website of indonesia.travel stands out with a significant figure of 1.749 million, indicating a strong global engagement. The websites tourismcambodia.org, vietnam.travel, tourismlaos.org, and tourism.gov.mm also report varying levels of traffic, contributing to their digital presence on a global scale. The data reveals interesting patterns when examining the distribution of devices. In the case of vietnam.travel, the majority of visits (66.3%) are generated by mobile devices, whereas tourismcambodia.org has a more balanced distribution with 55.0% of visits coming from mobile devices and 45.0% coming from desktop computers. The website of Indonesia.travel, on the other hand, receives 76.8% of its traffic from mobile devices.
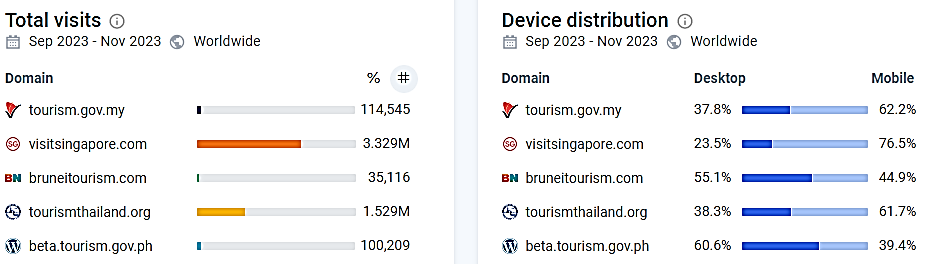
Figure 4. Traffic analytics of total visits and device distribution
Source: Authors, 2023
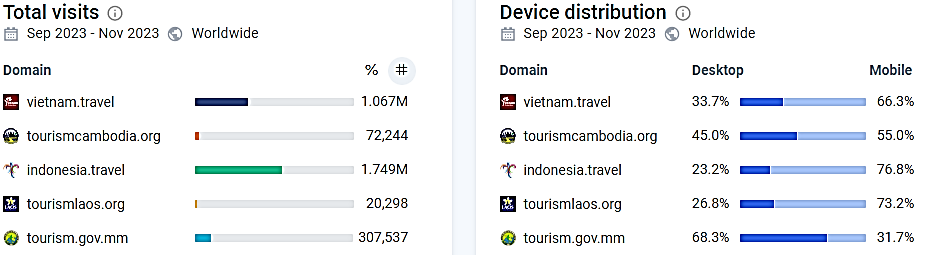
Figure 5. Traffic analytics of total visits and device distribution
Source: Authors, 2023
Figure 6 presents an analysis of key metrics from several tourism-related websites, providing insight into their performance and user engagement. It is estimated that 38,182 visitors visit the website of tourism.gov.my each month, with an average visit duration of 00:03:15 and an average number of pages viewed of 2.88. Bounce rate is 63.09%, indicating that the majority of visitors leave the site without exploring further. According to visitsingapore.com, the website receives over 1.109 million visits every month, with a visit duration of 00:01:17 and an average of 2.37 pages per visit. This site has a bounce rate of 67.41%. On the websites of bruneitourism.com and tourismthailand.com, monthly visit counts are 11,705 and 509,715, respectively, with varying visit durations, pages per visit, and bounce rates. The website beta.tourism.gov.ph records 33,403 monthly visits, with a visit duration of 00:01:49 and a bounce rate of 65%. As a result of these metrics, valuable insights can be generated regarding user behavior, engagement, and the overall effectiveness of these tourism websites in retaining and attracting visitors.
As shown in Figure 7, vietnam.travel is the website with the highest monthly visit count of 355,854, as well as a relatively longer visit duration of 00:01:21 and an average of 1.65 pages per visit. In the case of this website, the bounce rate is 70.04%, indicating a moderate percentage of visitors leaving without further exploration. Website of tourismcambodia.org records 24,081 monthly visits, with an average visit duration of 00:01:43 and a page-per-visit average of 2.71. Indonesia.travel records 583,161 monthly visits, with a shorter visit duration of 00:00:58 and a higher bounce rate of 74.04%. The website with the highest page views is indonesia.travel with 891,509 records.
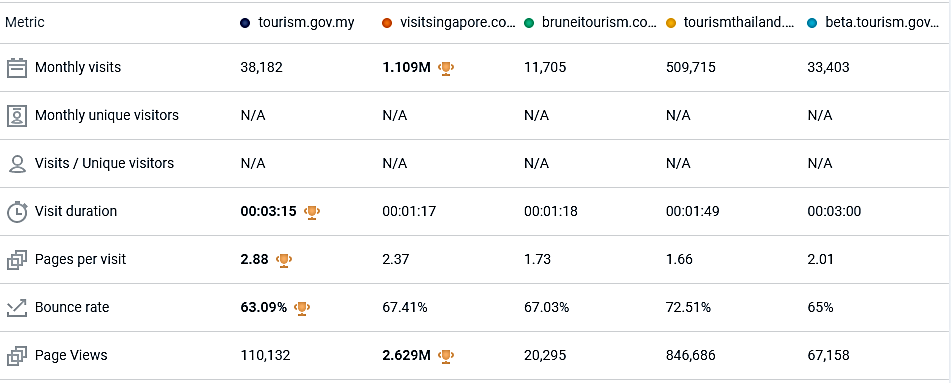
Figure 6. Traffic analytics of engagement users
Source: Authors, 2023
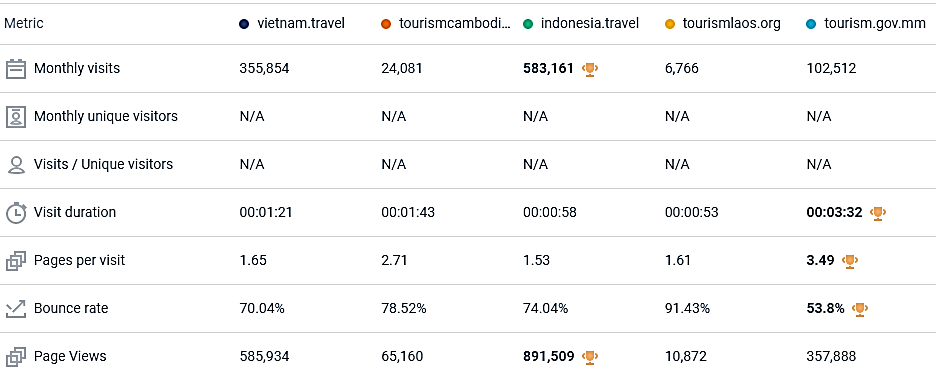
Figure 7. Traffic analytics of engagement users
Source: Authors, 2023
Visit over Time
Figure 8 depicts the monthly trends in traffic to several tourism websites during September, October, and November 2023. There were 114,545 visits to the website of tourism.gov.my at the during of the period. There are 3.329 million visits to the website of visitsingapore.com. Website of bruneitourism.com starts with 35,116 visits experiencing a decline to 8,257 in October. Website of tourismthailand.org witnesses a substantial surge in visits from 1.529 million visits. Website of beta.tourism.gov.ph maintains a more stable visitation trend, with 100,209 visits and 34,386 visits in October.
The figure 9 illustrates the website of vietnam.travel with 1.067 million visits between from September to November 2023. 72,244 visits have been recorded on the tourismcambodia.org website, representing a significant level of engagement. The website of indonesia.travel stands out with a significant 1.749 million visits, showcasing a strong digital presence. In the figures, it is evident that the levels of digital engagement among these tourism websites vary greatly. The fluctuations in website traffic can be influenced by factors such as marketing campaigns, events, or seasonal trends. Further analysis of user behavior and external factors will allow a more comprehensive understanding of the observed patterns.
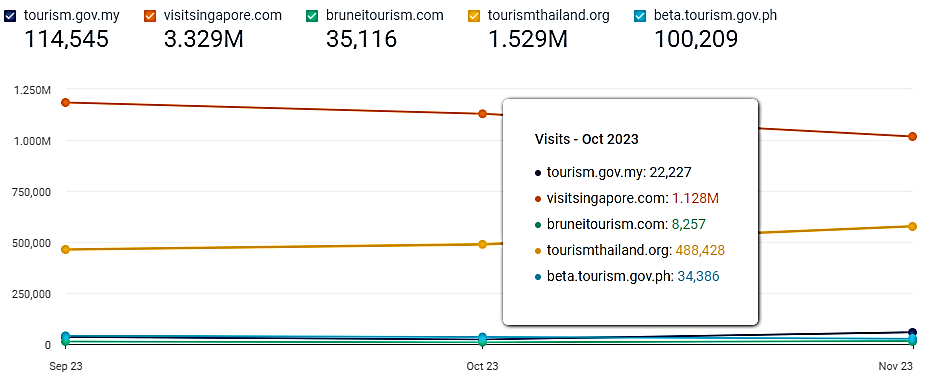
Figure 8. Website trends of visit over time from September to November 2023
Source: Authors, 2023
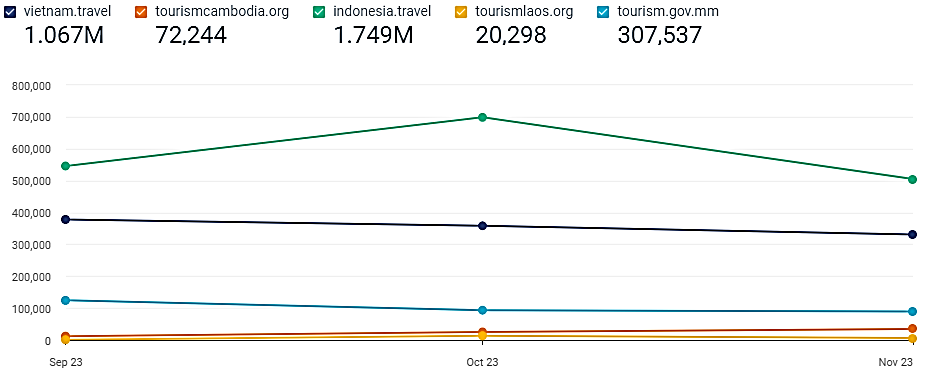
Figure 9. Website trends of visit over time from September to November 2023
Source: Authors, 2023
Geography: Top Countries
Data shown in Figure 10 provide valuable insight into the geographical distribution of online engagement from September 2023 to November 2023. The countries of Thailand, Singapore, India, Indonesia, and Vietnam emerged as key players in driving traffic to the specified websites during this period. Thailand holds a traffic share of 20.72%, which indicates its presence in the digital engagement landscape. The traffic share of Singapore is significant, accounting for 9.88% of the overall traffic of the analyzed websites. In terms of online traffic, India accounts for 7.24% of all traffic, illustrating the country’s presence in the digital influence. Indonesia dominates with a staggering 96.8% group traffic share, illustrating its prominence in driving traffic to the websites. Vietnam also plays a notable role, contributing to the group traffic share with 97.9%.
In Figure 11, Indonesia emerges as a significant player, accounting for a significant share of 22.21% of traffic. Myanmar is a major contributor to the overall traffic, with a 99.4% share of group traffic. Additionally, Australia and the United States play an important role in influencing the websites under consideration, with traffic shares of 7.39% and 6.55% respectively. Malaysia, with a traffic share of 6.39% adds to the diverse sources of online visitors. A significant portion of the overall traffic comes from these countries with the group traffic share split demonstrating the varying degrees of influence each country has on the digital landscape. This information is crucial for website owners and marketers to tailor their strategies based on the regions that contribute most to their online presence.
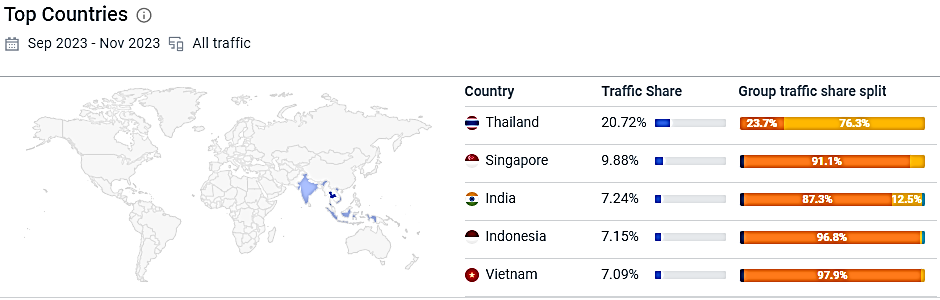
Figure 10. Geography traffic analytic in top countries
Source: Authors, 2023
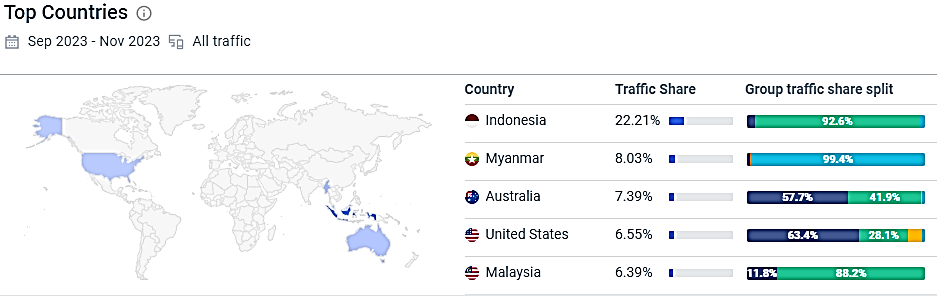
Figure 11. Geography traffic analytic in top countries
Source: Authors, 2023
Marketing Channels
The figure 12 provides an overview of the traffic sources driving traffic to various tourism-related websites in ASEAN countries from September 2023 to November 2023. The website of tourism.gov.my received 91,950 visits during this period, with a breakdown of traffic sources. There is 100% direct traffic to the website, indicating that visitors have navigated directly to the site without using intermediary channels. Website of visitsingapore.com, with a substantial 3.266 million visits, demonstrates a diverse traffic acquisition strategy. Referrals contribute 50%, suggesting that half of the traffic comes from other websites linking. Website of tourismthailand.org, with 1.472 million visits, has a balanced distribution across channels, emphasizing the website’s accessibility through various means.
This figure 13 illustrates the website of vietnam.travel with 1.038 million visits during this period of time. This demonstrates the diversity of traffic sources driving the site’s traffic. The website tourismcambodia.org received 71,069 visits, showing a balanced distribution across channels, with no direct or email traffic but a significant 50% from referrals. The website of indonesia.travel received 1.682 million visits, demonstrating the effectiveness of its diverse online marketing strategy. Website of tourismlaos.org with 19,237 visits emphasizes the importance of social and organic search channels in driving engagement. The data underscores the importance of a comprehensive approach to digital marketing, with different channels playing varying roles in driving traffic and engagement for these tourism websites on a global scale.
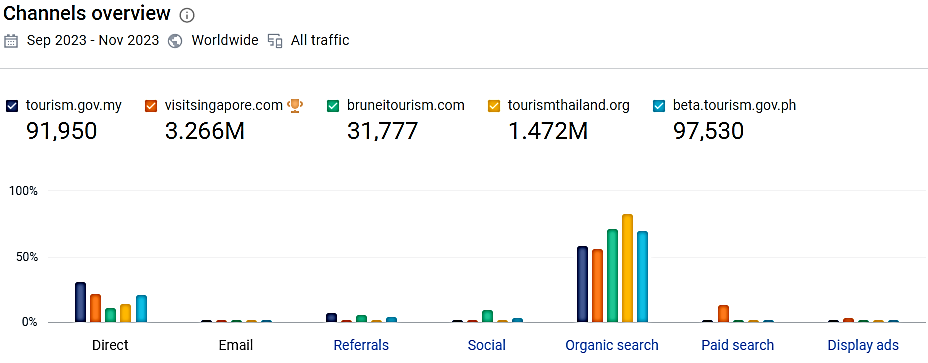
Figure 12. Marketing channels overview website analysis
Source: Authors, 2023

Figure 13. Marketing channels overview website analysis
Source: Authors, 2023
Organic Search Analysis
As shown in Figure 14 below, the top organic search terms for ASEAN countries from September 2023 to November 2023 provide a detailed analysis of the keywords driving organic traffic to tourism-related websites. Website of tourismthailand.org is in the lead with 85.37% organic search. Search term “singapore rewards” holds a traffic share of 0.85%, with a volume of 2,300 searches and a cost per click (CPC) of $1.07. Search term “visit singapore” contributes to a traffic share of 0.61%, with a higher volume of 6,180 searches and a slightly lower CPC of $1.01. The search term “Phuket”, commanding a traffic share of 0.46%, with a substantial volume of 435,170 searches and a CPC of $0.40.
Figure 15 shows the search term “ha giang loop” commands a traffic share of 1.45%, with a volume of 48,580 searches and a CPC of $0.53. The search term “raja ampat” contributing to a traffic share of 0.67%, with a volume of 92,140 searches and a lower CPC of $0.42. The search term “ninh binh”, with a traffic share of 0.66%, a volume of 78,950 searches, and a CPC of $0.62. Organic search traffic from the general term “Vietnam”, with a traffic share of 0.58%, a higher volume of 1,296,690 searches, and a CPC of $0.50. The data emphasizes the importance of optimizing content for relevant keywords to enhance organic search visibility, with the varying search terms reflecting the diversity of user interests and intent when searching for tourism-related information.
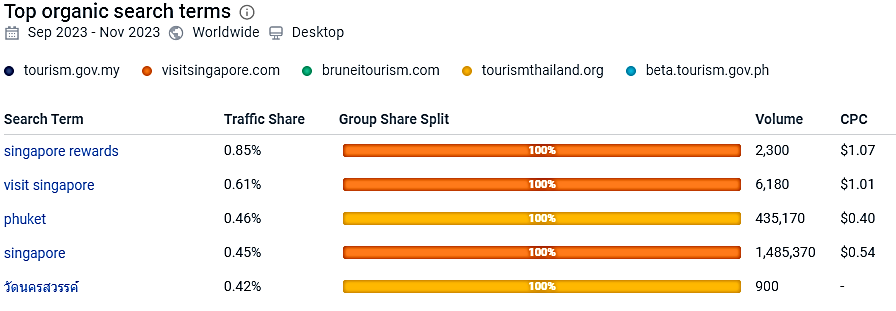
Figure 14. Organic search analysis websites
Source: Authors, 2023
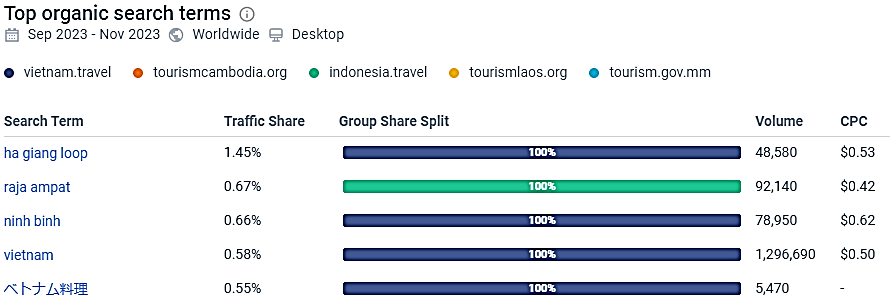
Figure 15. Organic search analysis websites
Source: Authors, 2023
Referrals Website Analysis
Figure 16 illustrates the top referring websites from September 2023 to November 2023, providing insight into the sources of traffic to various tourism-related websites. Google.com emerges as the top referring website, being a dominant search engine with a significant traffic share of 15.45%. This indicates that organic search traffic has a significant impact on directing users to tourism websites. As a referring site, Tourism.gov.ph has a traffic share of 5.00%, and is categorized under Travel and Tourism. Singaporegp.sg, a site that focuses on Motorsports, holds a 4.76% traffic share, illustrating the significance of specialized interests in driving traffic. The domain of malaysia.travel also falls under Travel and Tourism, contributing to a traffic share of 4.71%, showcasing the influence of destination-specific websites in directing users to related tourism platforms.
Figure 17 shows the domain of “vietnam.gov.vn”, categorized under Government, is another notable referring site, contributing to a traffic share of 8.15%. This indicates that government-related platforms play a role in directing users to these websites, potentially showcasing the influence of official channels. The domain of “www-indonesia-travel.translate.goog”, under Travel and Tourism, has a traffic share of 7.59%, emphasizing the impact of translated travel content in driving traffic to these platforms. The domain of “ASEAN2023.id”, categorized under Government contribute to a traffic share of 5.91%, showcasing the diverse referral sources, including government-related and unidentified platforms. The data highlights the diverse array of referral sources, ranging from search engines to destination-specific websites, each playing a crucial role in shaping the online visibility and traffic patterns for these tourism-related platforms.

Figure 16. Referrals websites analysis usage in Malaysia, Singapore, Brunei, Thailand and Philippines
Source: Authors, 2023

Figure 17. Referrals websites analysis usage in Vietnam, Cambodia, Indonesia, Laos,and Myanmar
Source: Authors, 2023
Social Traffic Analysis
According to Figure 18, social traffic data for various tourism-related websites from September 2023 to November 2023 provides insight into the sources of social media-driven traffic. For “tourism.gov.my”, social traffic comprises the highest visits, indicating a strong reliance on social media channels for driving engagement from Facebook. The website of “bruneitourism.com” receives the most social traffic from other websites. Figure 19 shows “tourism.gov.mm” is in the lead of social traffic comes from sources like Facebook, Youtube, Reddit, Facebook Messenger, and Pinterest. The data underscores the importance of social media in driving desktop traffic to these tourism websites, with variations in the specific platforms utilized. The diversified approach seen on some websites, incorporating multiple social channels, reflects a strategy aimed at reaching a broader audience and engaging users across various social media platforms.

Figure 18. Social traffic analytics usage
Source: Authors, 2023

Figure 19. Social traffic analytics usage
Source: Authors, 2023
Gender Distribution Analysis
Figure 20 shows the data on gender distribution across different tourism-related websites from ASEAN countries illustrates the varying proportions of male and female visitors. For website of “tourism.gov.my”, the majority of visitors are male constituting 57.22% of the audience, while female account for 42.78%. In the case of “visitsingapore.com”, the gender distribution is more balanced, with 52.76% female visitors and 47.24% male visitors. Website of “tourismthailand.org” shows a slightly higher percentage of female visitors at 53.87%, with males comprising 46.13%. The website of “beta.tourism.gov.ph” also exhibits a higher proportion of female visitors, making up 60.66% of the audience, while males account for 39.34%. Figure 21 shows for website of “vietnam.travel”, the majority of visitors are female constituting 56.94% of the audience, while male account for 43.06%. The website of “Indonesia.travel” shows a percentage of female visitors at 53.82%, with males comprising 46.18%. The data underscores the diversity in gender representation across these tourism websites, emphasizing the importance of recognizing and catering to the preferences and interests of both male and female visitors in the development of content and marketing strategies. Understanding the gender dynamics of the audience is crucial for effectively engaging and catering to the needs of a broad and diverse user base.
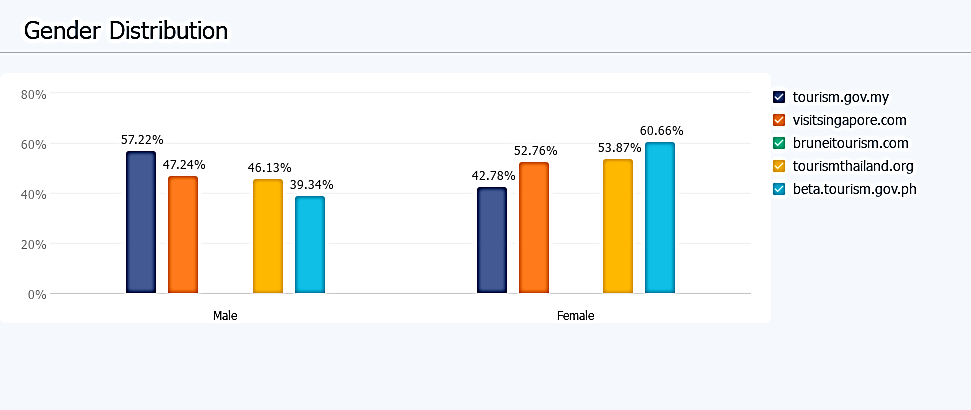
Figure 20. Overview of gender distribution analytics
Source: Authors, 2023
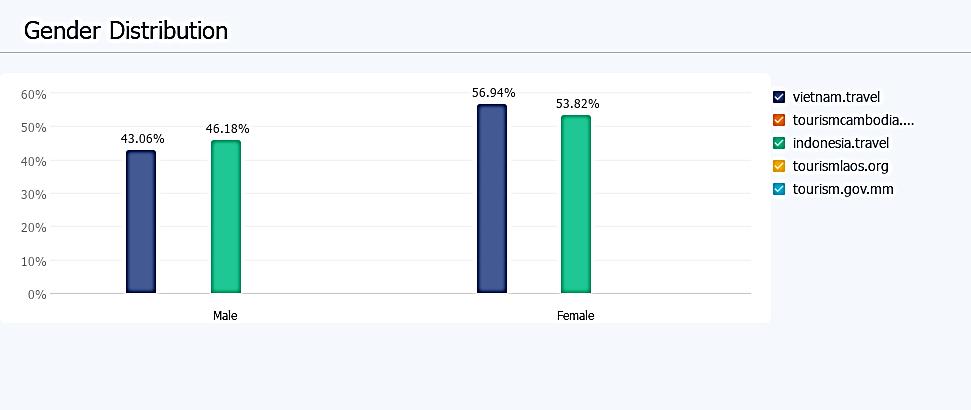
Figure 21. Overview of gender distribution analytics
Source: Authors, 2023
CONCLUSION AND DISCUSSION
The analysis of webometrics shows that online tourism website in the ASEAN region is constantly changing and evolving. Search engines like Google are really important for getting people to visit websites. This means that it’s really important for websites to use search engine optimisation (SEO) strategies to make sure they show up in search results. In addition, the data shows that we heavily depend on social media platforms to drive traffic. This means it’s important for us to use social media marketing effectively in order to connect with a larger audience. The industry and country ranks help us understand how well tourism websites are doing compared to each other. This information can be used to figure out how to make improvements and plan strategies for the future.
The differences in how many male and female use different websites show how important it is to make content and marketing strategies that work for all kinds of people. It is important to understand what both male and female like and how they behave in order to create content that appeals to a wide range of people. In the future, it will be important to regularly check and adjust digital strategies for tourism websites in ASEAN countries to keep them running well and make them even better. The results of this study will be used as a starting point for future research and to create specific strategies that will make tourism promotion in the region more effective online.
In conclusion, the analysis of tourism websites in ASEAN countries has given us useful information about the online website of the tourism industry. The information about global ranks, country ranks, industry ranks, and different performance metrics helps us understand how these countries use online website and user engagement strategies. Some important things we found are the different rankings of countries and their tourism websites. This shows how competitive and effective each country’s website is. When analysing tourism websites in ASEAN countries, it’s important to consider different factors like the economy, environment, technology, and local context. This is mentioned in the relevant literature. By combining these different aspects, we can gain a complete understanding of how tourism websites in the ASEAN region are performing and how effective they are. This will help us make better decisions and plan strategies in the tourism industry. The detailed breakdown of where website traffic comes from, including search engines and social media, shows how important these platforms are for getting people interested in online content. Additionally, the data on gender distribution reveals the varied audience demographics on these websites. Overall, these findings show that it’s really important to have a well-rounded online strategy for tourism websites. This means using things like SEO, social media, and user-friendly design to make the websites more visible and attractive to people.
REFERENCES
- Akbar, M. A., Wibowo, S. K. A., & Fuady, I. (2022). A Comparison of The Official Tourism Website Effectiveness of Bali And North Sumatra Province: A Content Analysis Approach. TRJ Tourism Research Journal, 6(1), 85-106.
- Almind, T. C., & Ingwersen, P. (1997). Informetric analyses on the world wide web: methodological approaches to ‘webometrics’. Journal of documentation, 53(4), 404-426.
- Baggio, R. (2009). An evaluation of ASEAN tourism websites/Noel Scott and Rodolfo Baggio. Journal of Tourism, Hospitality & Culinary Arts (JTHCA), 1(1), 1-10.
- Bakkiyaraj, N. and Kalidasan, R. (2022). Website analysis of physical education institutions in india. International Journal of Health Sciences, 4935-4962.
- Bowler, L., Hong, W. Y., & He, D. (2011). The visibility of health web portals for teens: a hyperlink analysis. Online information review, 35(3), 443-470.
- Brida, J. G., & Scuderi, R. (2013). Determinants of tourist expenditure: A review of microeconometric models. Tourism Management Perspectives, 6, 28-40.
- Buhalis, D., & Law, R. (2008). Progress in information technology and tourism management: 20 years on and 10 years after the Internet—The state of eTourism research. Tourism management, 29(4), 609-623.
- Davidson, P. M., Newton, P. J., Ferguson, C., Daly, J., Elliott, D., Homer, C., … & Jackson, D. (2014). Rating and ranking the role of bibliometrics and webometrics in nursing and midwifery. The Scientific World Journal, 2014.
- Gee, L. L. S., Dasan, J., & Hasan, C. H. C. (2022). Investigating the Usability of Universities’ Websites: Upgrading Visualization Preference and System Performance. International Journal of Interactive Mobile Technologies, 16(2).
- Ghosh, S., & Roy, B. K. (2022). Open Access Digital Repositories of Agricultural Sciences in Africa: a webometric study. South African Journal of Libraries and Information Science, 88(1), 1-20.
- Giannakoulopoulos, A., Konstantinou, N., Koutsompolis, D., Pergantis, M., & Varlamis, I. (2019). Academic excellence, website quality, SEO performance: is there a correlation?. Future Internet, 11(11), 242.
- Gupta, D. D., & Utkarsh. (2014). Assessing the website effectiveness of top ten tourist attracting nations. Information Technology & Tourism, 14, 151-175.
- Internet users in South East Asia | TheGlobalEconomy.com. (2021). TheGlobalEconomy.com. https://www.theglobaleconomy.com/rankings/internet_users/South-East-Asia/
- Jansen, B. J., Jung, S. G., & Salminen, J. (2022). Measuring user interactions with websites: A comparison of two industry standard analytics approaches using data of 86 websites. Plos one, 17(5), e0268212.
- Kertamukti, R., Sodik, M., & Sujibto, B. J. Jurnal Pewarta Indonesia. Jurnal Pewarta Indonesia, 3(2-2021), 105-123.
- Kvitka, S., Rachynskii, A., Borodin, Y., Starushenko, G., Lesina, T., & Kichuk, A. (2021). Statistical assesment of webometric rating indicators of ukrainian higher education institutions. Management Theory and Studies for Rural Business and Infrastructure Development, 43(2), 177-194.
- Lang, P. B., Gouveia, F. C., & Leta, J. (2013). Cooperation in health: Mapping collaborative networks on the web. PLoS One, 8(8), e71415.
- Li, X., & Wang, Y. (2010). Evaluating the effectiveness of destination marketing organisations’ websites: evidence from China. International journal of tourism research, 12(5), 536-549.
- Moenir, H. D. (2017). Implementasi ASEAN Tourism Strategic Plan 2011-2015 dalam Kebijakan Pariwisata Indonesia di masa Pemerintahan Jokowi. Andalas Journal of International Studies, Vol. 6 No 1, 57-78.
- Mohammad Shafi, S., & Hanief Bhat, M. (2014). Performance and visibility of Indian research institutions on the web. VINE: The journal of information and knowledge management systems, 44(4), 537-547.
- Muniyasamy, M., Nanthakumar, M., & Kumar, K. (2023). Indian tourism websites with special reference to the selected states: a webometrics. Innovare Journal of Education, 12-17.
- Ninkov, A., & Sedig, K. (2019). VINCENT: A visual analytics system for investigating the online vaccine debate. Online journal of public health informatics, 11(2).
- Phiri, A. (2015). Tourism and Economic Growth in South Africa: Evidence from Linear and Nonlinear Cointegration Frameworks. Managing Global Transitions 14 (1): 31-53.
- Pinjaman, S., Jemin, S., Ridzuan, A. R., & Lada, S. (2023). The Relationship between Macroeconomic Factors and Tourism Demand for OIC Countries. Journal of Business & Economics Review (JBER), 8(2).
- Rahardja, P., and Manurung, M. (2004). Teori Ekonomi Makro, 2nd edition. Jakarta: Fakultas Ekonomi Universitas Indonesia.
- Sarwar, R., Zia, A., Nawaz, R., Fayoumi, A., Aljohani, N. R., & Hassan, S. U. (2021). Webometrics: evolution of social media presence of universities. Scientometrics, 126, 951-967.
- Scott, N., & Baggio, R. (2009). An Evaluation of ASEAN Tourism Websites. Journal of Tourism, Hospitality & Culinary Arts, Malaysia.
- Shari, S., Haddow, G., & Genoni, P. (2012). Bibliometric and webometric methods for assessing research collaboration. Library Review, 61(8/9), 592-607.
- Sharul, H. M., Azman, I. N., & Elya, M. M. S. (2021, December). A Study of University Website Content Classification Using Machine Learning. In Journal of Physics: Conference Series (Vol. 2129, No. 1, p. 012043). IOP Publishing.
- Silfianti, W., Hermita, M., Suhatril, R. J., & Hermana, B. (2019, August). AN ANALYSIS OF DIGITAL DIVIDE IN INDONESIAN ONLINE MASS MEDIA BASED ON WEB METRIC ANALYSIS. In Proceedings of the World Conference on Media and Mass Communication (Vol. 5, No. 1, pp. 170-178).
- Subandi, M. R., & Putra, F. K. K. (2017, November 9). Website Evaluation for the Local Tourism Offices of Indonesia’s Top 10 Priority Destinations. https://doi.org/10.31227/osf.io/fkbm5
- Sundoro, H. and Soeprapto, V. (2018). The effect of tourism sectors on ASEAN countries’ economic growth: analysis panel regression. https://doi.org/10.5220/0008490201800184
- Tavosi, M., & Naghshineh, N. (2022). Google SEO score and accessibility rank on the American University Libraries’ websites: one comparative analysis. Information Discovery and Delivery, (ahead-of-print).
- Thelwall, M. (2008). Bibliometrics to webometrics. Journal of information science, 34(4), 605-621.
- Wahyuningrum, T., Kartiko, C., Wardhana, A. C., & Soares, T. G. (2021). Revised web impact factor analysis of Timor Leste University website during COVID-19 pandemic. Bulletin of Electrical Engineering and Informatics, 10(3), 1678-1686.
- Wannapan, S., Chaiboonsri, C., & Sriboonchitta, S. (2018). Identification of the connection between tourism demand and economic growth in ASEAN-3. International Journal of Trade and Global Markets, 11(1), 1.
- Yassin, J., Aralas, S., & Basa, D. E. (2021). Tourism Density Effect on Environmental Performance Index: Evidence in ASEAN Countries. Applied Environmental Research, 43(1), 90-101.
- Yekini, N., Adigun, O., & Akinwole, A. (2022). Empirical analysis of webometric ranking in nigeria polytechnics education sector. Technology Audit and Production Reserves, 6(2(68)), 34-38. https://doi.org/10.15587/2706-5448.2022.270322