
An Evaluation of Perceived Quality Effect on the Choice of Poultry Feeds by Farmers in Nakuru West Sub-County, Nakuru County, Kenya
- Dr. Hilary Busolo
- Dr. Caren Jerop
- Dr. Charles Omoga
- 1244-1259
- Jun 8, 2024
- Agriculture
An Evaluation of Perceived Quality Effect on the Choice of Poultry Feeds by Farmers in Nakuru West Sub-County, Nakuru County, Kenya
Dr. Hilary Busolo, Dr. Caren Jerop, Dr. Charles Omoga
Alupe University
DOI: https://dx.doi.org/10.47772/IJRISS.2024.805088
Received: 06 May 2024; Accepted: 11 May 2024; Published: 08 June 2024
ABSTRACT
Much attention has been devoted to research with interest in consumer behaviour because the complexities surrounding consumer decision making and myriad of influences play a major role in consumer choice of products. It would be useful for marketers, academicians, and those in the industry to better understand why a consumer makes a particular purchase. The Theory of Reasoned Action and the Fishbein model were used with regard to attribute and multi attribute effects on behaviour towards consumer purchase to highlight this concept. A snowball sampling technique was employed to investigate the effect of perceived quality on the choice of poultry feeds and identify the attributes that underlie perceived quality judgement of poultry feeds. The study postulates that there is no difference between farmers attitude towards the different brands of layers mash and that the perceived quality attributes that influence choice among the layers mash brands are different. Data was collected using a questionnaire and analysed using descriptive statistics and Kruskal Wallis test statistic. Results of the study reveal that there is a difference between farmers’ attitudes towards different layers mash brands, and that there is influence of perceived quality on the choice of layers mash. The implications of these are that marketers should differentiate their products offered on the market inorder to influence attitudes of consumers favourably towards their products. They should also look for the attributes consumers use to judge quality and ensure they are highlighted in their products and promotion campaigns
Key Words: Poutry famers, poutry feeds, perceived quality, consumer behaviour
BACKGROUND OF THE STUDY
Although crop farming still remains the most important economic activity in Kenya, the government has aimed at developing animal husbandry sustainably (Njuguna et al. 2017; Ivan, Ray & Michael, 2021). This has made the Ministry of agriculture come up with polices that favour development and improvement in this sector – including poultry farming. This on the other hand has influenced production and investment decisions to that end as there was an increase in value of marketed production of chicken and eggs from Kshs 6.0 billion in 2015, Kshs 8.8 billion in 2016, Kshs 10.7 billion in 2017 to 12.1 billion in 2018 (Kenya National Bureau of Statistics [KNBS], 2019). It is the value of prospective yield (both physical and financial) from the poultry farming that has dictated the marketing strategy and systems to be adopted.
The government of Kenya sessional paper No.1 of 1986 entitled Economic Management of Renewed Growth, had projected that agriculture would play a leading role in the country’s future economic development by feeding the rapidly growing population; providing farm family income target to grow by at least 5% per annum to the year 2000; absorbing new farm workers at the rate of 3% per annum; and supplying raw materials to industry so as to stimulate growth of off-farm activities by between 3.5% and 5% a year. This was because, the manufacturing sector registered an average growth rate of 9.1%, and agriculture 4.6% between 1964 and 1973 (National Development Plan 1997-2001). Most of the industries at the time were agro – based and if the trend were to continue they would experience shortage of raw materials. The Revised Livestock (poultry Industry) Regulations, 2023 having the objective to increase productivity of safe and quality poultry and poultry products – among other objectives, state clearly poultry feed formulation and proper storage of poutry feeds (GoK, 2023). These aims at guaranteeing quality of the poultry feeds, consequently influencing production.
Companies operating during this period (1970 – 1980) grew tremendously and felt no much need for strategic brand building activities and therefore marketed unbranded products, a mistake that no present enterprise can make (Mburu, 2001). Consumer on the other hand, did not have a wide range of products to choose from, hence price and product availability was the only competitive tools in marketing of a product. According to Kolter (1989), the product concept sufficed.
Early in the 1900’s, the feed business consisted essentially of a merchandising channel for milling by-products and a few formula supplements (kailikia, 1992; Alliance for a Green Revolution in Africa (AGRA), 2014; Nasike, 2020). At this time, much poultry was fed straight feed grains with no protein supplement. In this type of feeding program and in this state of development of poultry nutrition, the opportunity and latitude for development of formula feed industry was rather restricted (Moore, 1976). As more people moved to urban centers where the incomes are higher than in the rural areas, the demand for poultry products increased, resulting in an increase in the demand for poultry feeds (Ainomaija, 2004). The feeds industry greatly expanded the output of formula feed supplements developing complete feeds for some types of poultry. The performance of the animals feeds industry was not satisfactory with occasional shortage and erratic price fluctuations. This was due to factors such as fluctuations in costs of production, counterfeiting of credible brands like those of Unga feeds limited, government interventions and the structural organization of the industry (Bartilor et al, 1988).
Product quality has received much attention because of its critical relevance for delivering superior customer value, which is the cornerstone of competitive advantage and, as such, must be the focus of marketing strategy. Consumers perceived quality must be enshrined in the brand equity, which is a set of assets inherent in the brand. It includes brand awareness, brand loyalty, perceived quality, brand association and other proprietary assets like competitive advantage-that are attached to a brand name or symbol (Aaker, 1991). Perceived quality refers to how customers perceive particular brands’ overall quality. Thus, it is essential for business to develop processes and systems that produce superior quality, at a competitive cost. Perceived quality, contributes significantly to the overall brand equity. Companies therefore must build product brands overtime emphasizing quality of their products/ services (Keller, 1998). This is important since customers are overwhelmed by choice and thus the distinction of a firm’s output had better stand out (Mbau, 2000).
Companies have realized that the strength of their brand names, corporate images, aggressive advertising and price trademarks are not enough to differentiate products from those of competitors (Baker, 1994). Consumers’ perceived quality largely dictates a company’s direction on its product mix to ensure growth in market share. Issues on perceived quality in animal feeds were that of low quality feeds. Adulteration of chicken feeds by millers was reported and a warning issued by the Minister of Agriculture to the effect that feed millers found mixing fish meal with sawdust would have their licenses withdrawn (The Standard Daily Newspaper, 19th November, 1990). The low quality feeds made the production period of poultry longer than recommended thus raising the cost of production (Bartilor et al, 1988).
STATEMENT OF THE PROBLEM
The performance of the animal feeds industry has been dismal and farmers have been switching from one company to another in search of better poultry feed. The actors in the industry have not recognized what farmers’ perception of quality entails (Iyadema, 1988; Magothe et al., 2012; Alqaisi et al., 2019; Oberc & Arroyo, 2020). This goes hand in hand with the ideas of one scholar, that until the firm realizes that perception is everything, it will always fall in the trap of pursuing quality in lines that do not matter to consumers (Mburu, 2001). Perceived quality will directly influence purchase decision and brand loyalty, especially when a buyer is not motivated or able to conduct a detailed analysis (Leslie de Chernatony, 1998; Ivan S. Adolwa et. Al., 2021). Some farmers went to the extent of supplementing their poultry feeds with vitamins, premixes and proteins (Kailikia, 1992; Oberc & Arroyo, 2020). Others sought for advice on the feeds to buy. What is this that farmers are looking for in their choice of poultry feeds? What attributes of perceived quality do farmers consider in their choice of poultry feeds? Firms need to recognize the attributes that consumers perceive as quality and how they affect the choice of poultry feeds. Therefore the problem of the study is that, poultry farmers have certain perceptions on the quality of poultry feeds, the effect this has on the choice of the feeds is not known.
Research Objectives
1. To determine perceived quality influences on farmers attitudes towards the choice of different poultry feeds brands.
2. To identify the attributes that underlies a perceived quality judgement of poultry feed.
Research Hypoteses
1. There is no difference between farmers attitude towards the different brands of poultry feeds
2. Perceived quality attributes that influence choice among the layers mash brands are different.
Justification of the Study
It is anticipated that the finding of the study will be of value and interest to the following groups. The marketing and advertising agencies that need to know attributes farmers use to judge quality so as to tailor their messages to achieve the desired response – which is repeat Purchase of the product. To farmers and farmers’ organizations the study will help them in purchase of quality products and help deal with products from firms that fail to embrace social responsibility by for example discriminating against them. The government will see the need of organizations identifying with their products for easy implementation and enforcing of government trading regulations – ensure products meet government standards. Future scholars can use this research as a basis of further research in the area of consumer perception its impact on consumer choice. The business Community, the study will help to increase awareness on consumer quality perception and the effects this has on profitability and competitive advantage.
MATERIAL AND METHODS
The survey used a sample of 56 respondents, which was picked randomly from the municipality using snowball sampling techniques. Primary data was collected by use of questionnaires that had structured questions. The questionnaire was divided into three part all based on a likert scales. Part I a seven-point scale (-3 to +3) and, part II (disagree to agree) and III (not important at all to extremely important) were based on a five point likert scale. Information on attributes that farmers view as important when buying layers mash and farmers perception on their importance was collected.
The survey involved poultry farmers who raise layers chicken only and do buy layers mash to feed them. Farmers who had tried the three brands of layers mash were targeted. The study confined itself to Nakuru West Sub-County, Nakuru County.
The survey used a sample of 56 respondents, which was picked randomly from the municipality. Snowball sampling techniques were employed to get respondents to complete the questionnaire. Proximity to the roads was also a consideration that was used to select respondents. This had the effect of reducing the cost of collecting data.
Data Collection Instrument and Procedure
Data was collected using questionnaires structured on the basing of the theory of reasoned action. Research assistants administered the questionnaires, guiding those unable to complete questionnaires on their own. Other considerations in issuing questionnaire included literacy and willingness of respondents.
DATA ANALYSIS AND DISCUSSION OF RESULTS
The respondent rate of the project was 80% of the expected seventy – (70), i.e. only fifty six (56) questionnaires were completed. Table 1 below shows how the responses were distributed among the three different layers mash brands.
Table 1: Response Rate According to Layers Mash Brands
| Layers Mash Brands | Responses Received | Percentage |
| Wonder Feeds | 25 | 44.64 |
| Unga Feeds | 13 | 23.22 |
| Modern Feeds | 18 | 32.14 |
| Total | 56 | 100 |
Source: Survey Data
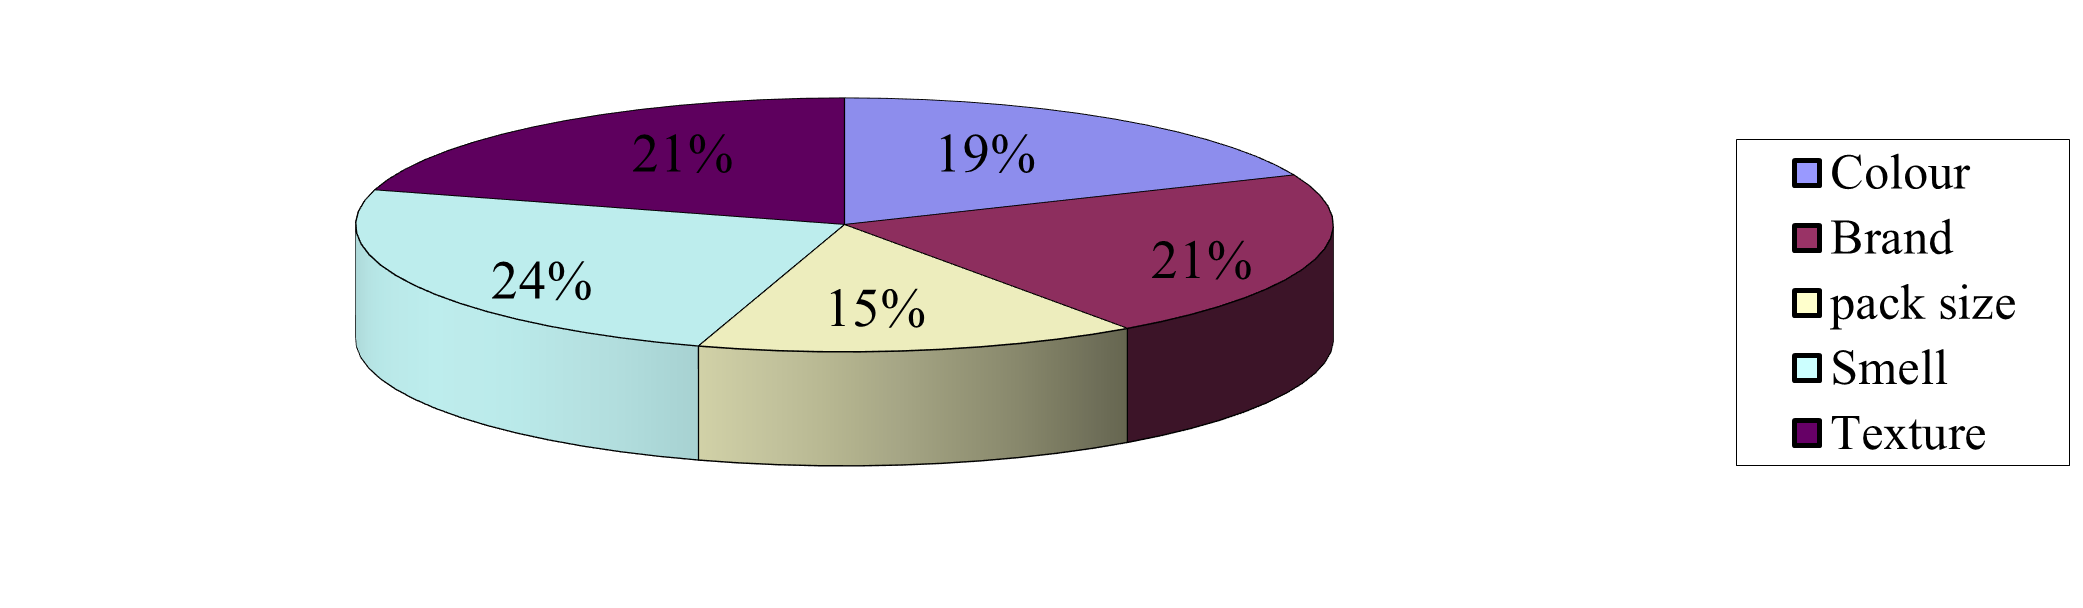
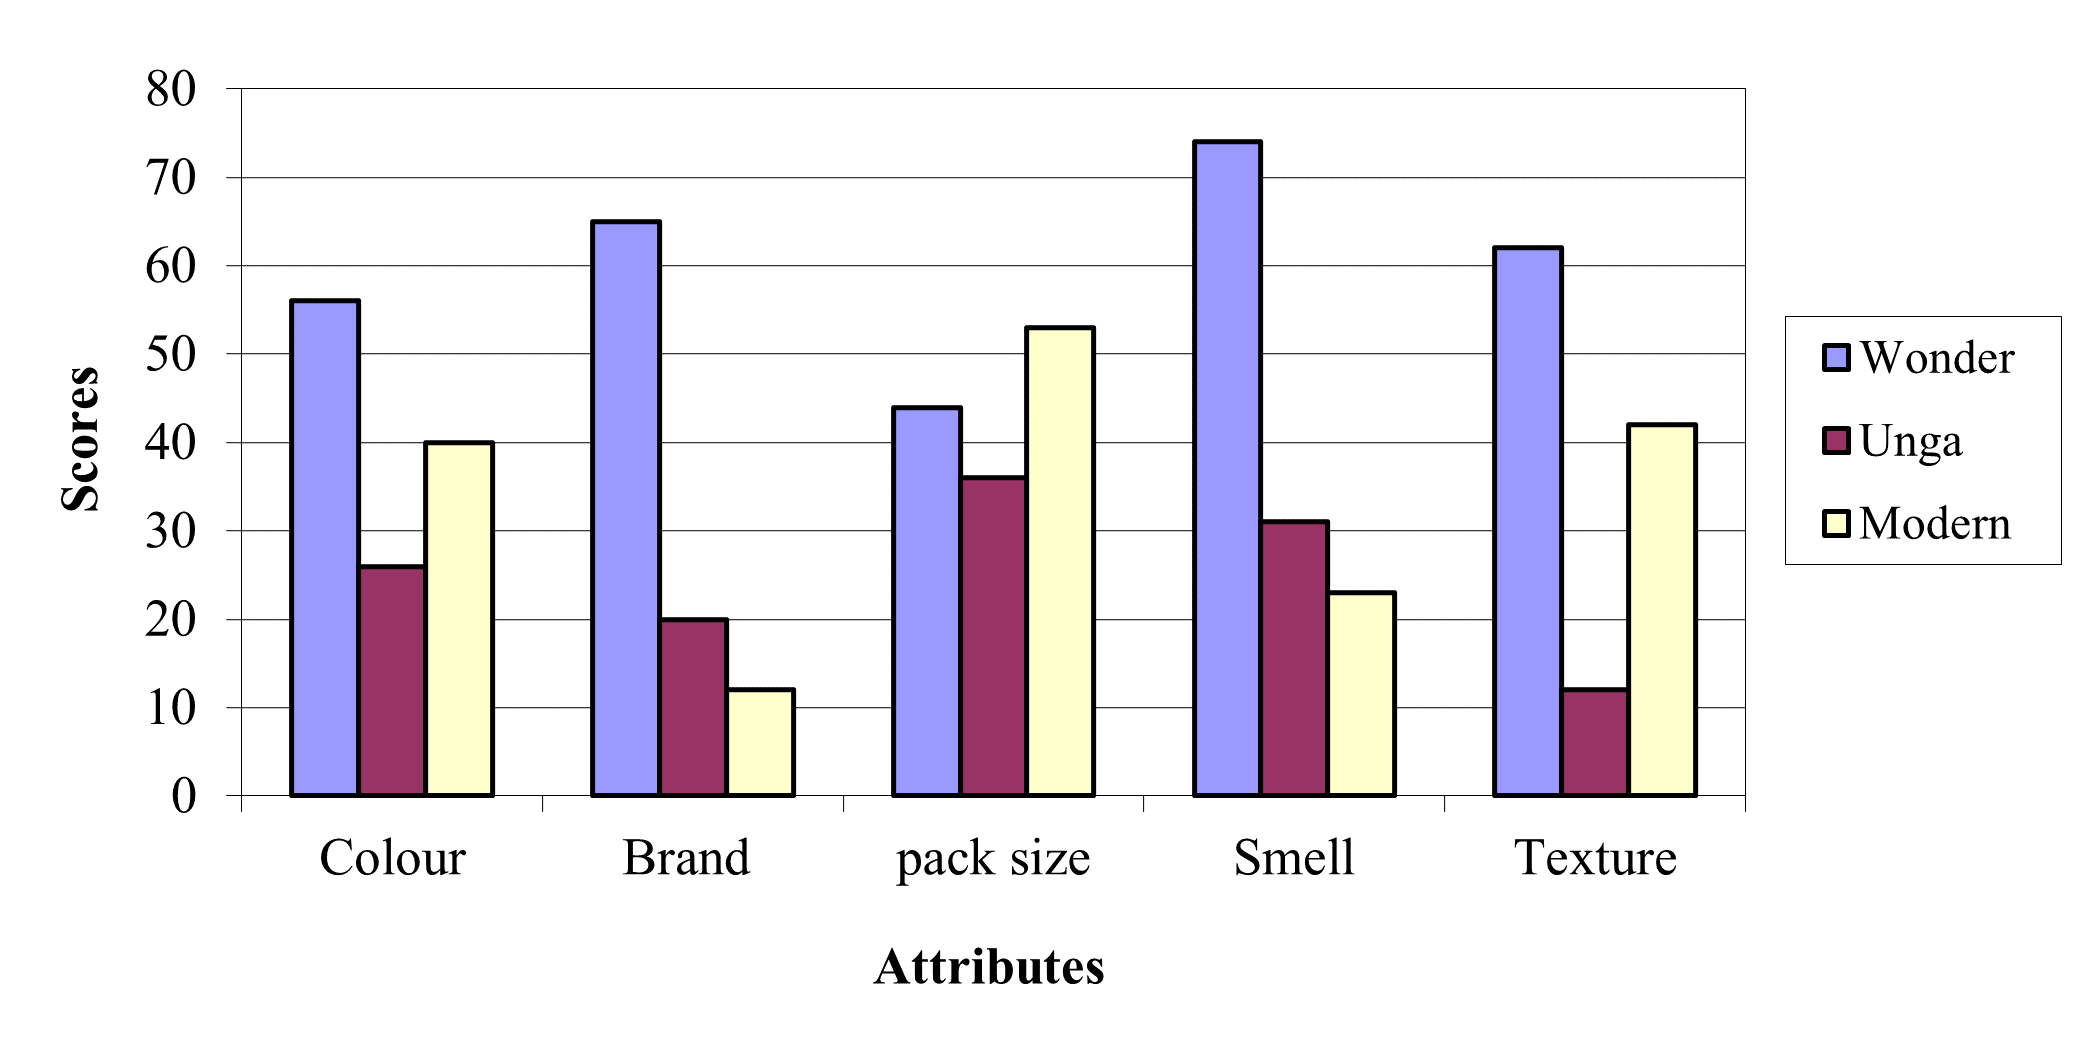
Farmers who use the different layers mash brands differed in level of importance attached to various attributes. For wonder feeds users’ smell was the most important attribute with a score of 74 points awarded. Brand name had 65, texture 62, colour 56, and package size 44 points. In terms of percentage these translate to 24% for smell, 21% for brand name, 21% for texture, 19% for Colour, and 15% for package size.
Figure 6 shows the percentage distribution of the importance among layers feeds attributes and scores for each attribute awarded by the wonder feeds farmers respectively. Smell of layers feeds was the most desirable attribute, followed by the brand name. The other attributes texture, colour and package size followed in that order, as considered by farmers who use wonder feeds.
Figure 6: Percentage of Attribute Importance among Wonder Feeds Farmers
Source: Survey Data
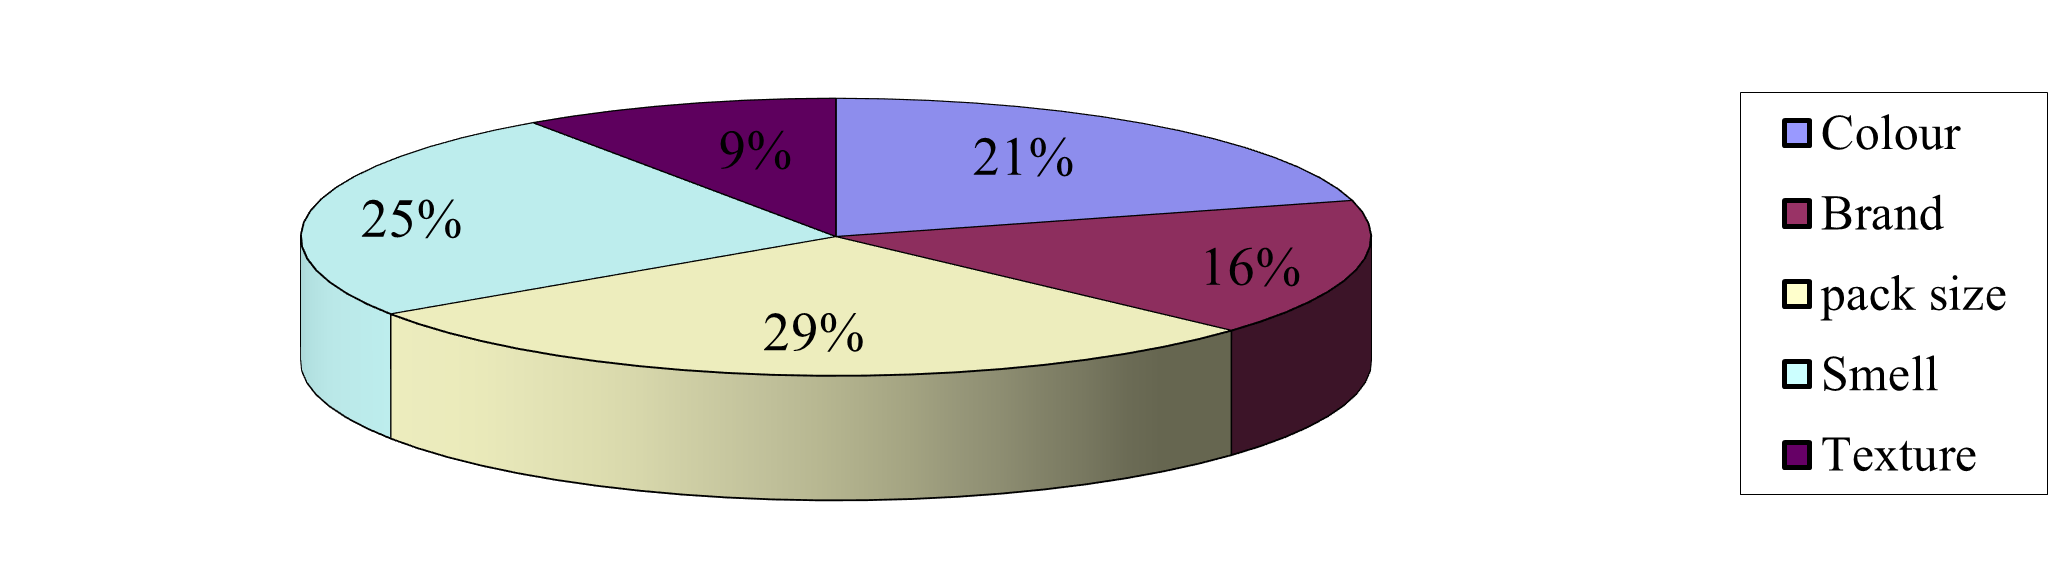
Unga feeds farmers colour 26 points, brand name 20, Package size 36, smell 31 and texture 12 points. In percentage form colour had 21%. Brand name, package size, smell and texture were represented by 16%, 28%, 25% and 10% respectively. A figure 7 show the percentage distribution of the importance of attributes awarded by Unga feeds farmers. This indicates that package size and smell of feeds are attributes that are considered highly when purchasing layers mash by farmers who use Unga layers mash.
Figure 7 : Percentage of Attribute Importance among Unga Feeds Farmers
Source: Survey Data
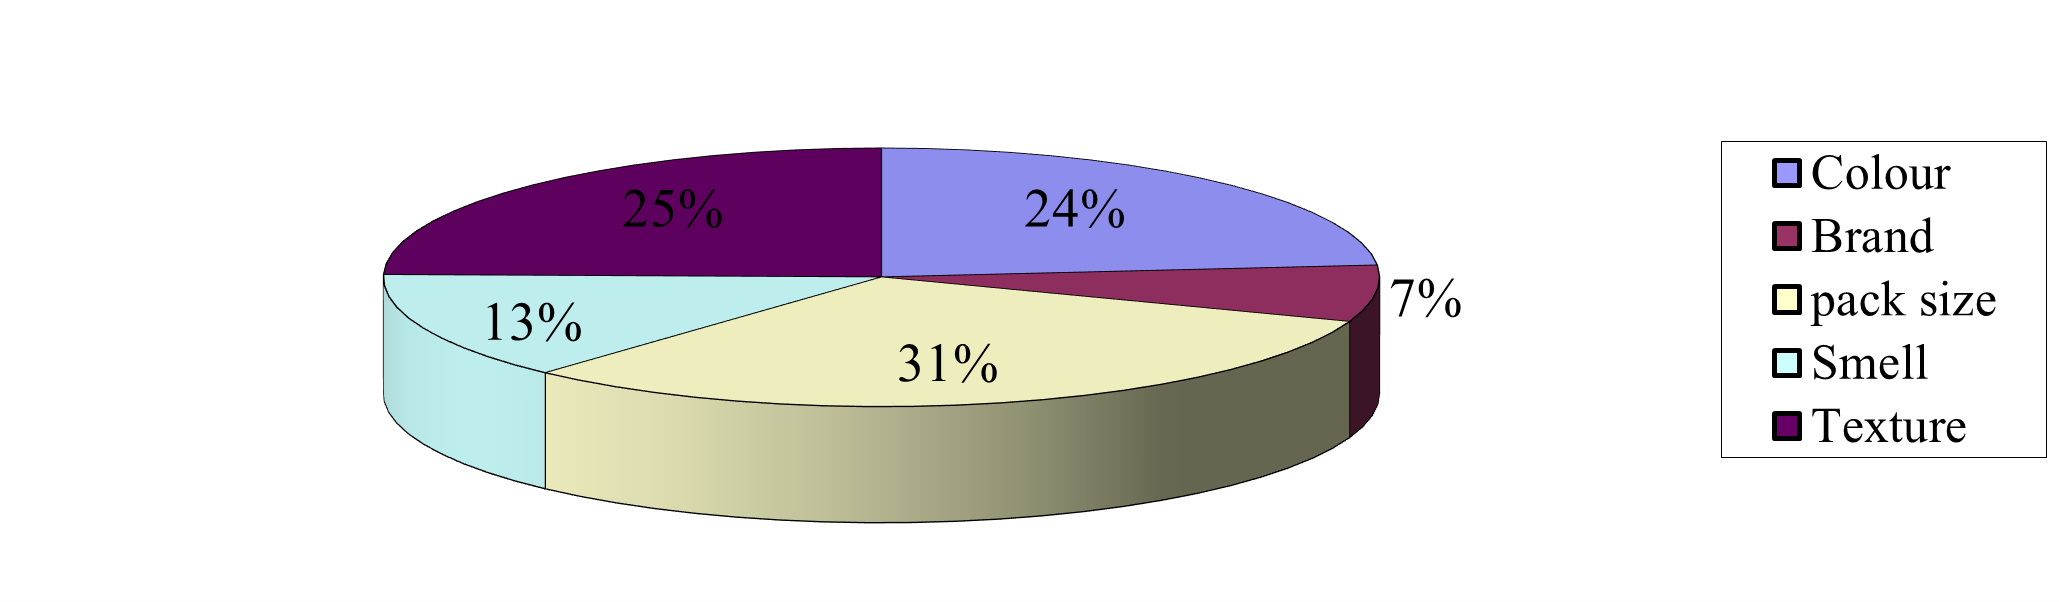
Farmers who use Modern feeds gave colour 40 points, brand name 12, package size 53, smell 23 and texture 42. This in percentage form translate to 24% for colour, 7% for brand name, 30% for package size, and 25% for texture. Figure 8 shows the percentage representation of the scores showing the level of importance of attributes awarded by farmers who use Modern layers mash. The results show that package size was the most important attribute consider by Modern feeds farmers when purchasing layer mash, followed by texture of the feeds.
Figure 8 : Percentage of Attribute Importance among Modern Feeds Farmers
Source: Survey Data
Overall Attribute Performance among the Layers Mash Brands
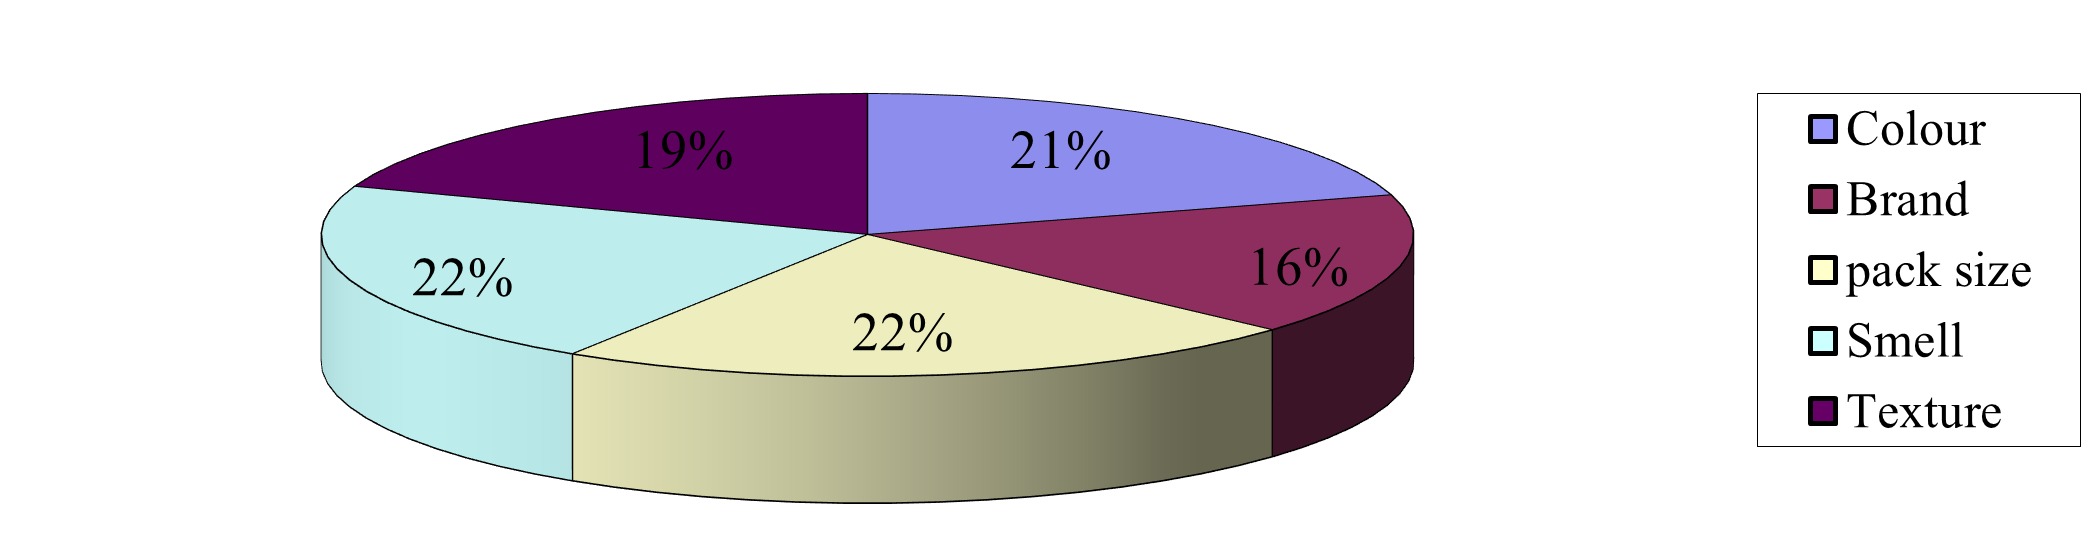
Figure 9 shows the overall attribute performance among the layers mash brands. Package size of layers mash scored highly compared to the other attributes considered to be important by consumers when purchasing layers mash, with a score of 133 points. The others, smell, colour, texture and brand name, had 128, 122, 116 and 97 points respectively.
Figure 9 : Overall attribute percentage Score
Source: Survey Data
In terms of percentages the scores translated into 23% for package size, 22% for smell, 20% for colour, 19% for texture and 16% for brand name. The scores reveal that farmers mostly consider Package size when purchasing layers mash. This is followed by aroma, colour, and eventually texture of the feeds. Brand name is the least important attribute considered when purchasing layers mash. Based on these findings marketers of layers mash must pack their layers mash based on the needs of farmers as it is the most sought for attribute by farmers when selecting layers mash.
Figure 10 : Comparison of Attributes among the Layers Mash Brands
Source: Survey Data
When attributes were compared among the three layers mash brands as shown in figure 10, package size was regarded as the most important attribute considered when purchasing layers mash by farmers of all the three layer mash brands. smell, colour, texture and brand name followed in that order. This has the implication that any layers mash on the market is likely to be picked by farmers if it is packed appropriate sizes.
Table 2 : Attribute Score and Ranks among the three layers mash
| Attribute | Wonder score | Rank | Unga score | Rank | Modern score | Rank |
| Colour | 56 | 4 | 26 | 3 | 40 | 2 |
| Brand | 65 | 2 | 20 | 4 | 12 | 5 |
| Pack size | 44 | 5 | 36 | 1 | 53 | 1 |
| Smell | 74 | 1 | 31 | 2 | 23 | 4 |
| Texture | 62 | 3 | 12 | 5 | 42 | 2 |
Source: Survey Data
From the survey, the level of importance of the attributes for Wonder feeds were ranked and smell of feeds was considered the most important, followed by brand name, texture, colour and package size of the feeds. Unga feeds varied in ranking of attributes importance. Package size was considered the most important attribute, followed by smell of feeds, colour, brand name and texture of feeds. For modern feeds package size still remained the most important attribute, followed by texture of feeds. The other attributes, colour, smell and brand name ranked third, fourth and fifth respectively. Table 2 shows the scores and ranks for each layers mash brand. From these results, package size is the most important attribute considered by farmers of the three layers mash brands relative to the other attributes, while brand name of the layers mash is the least important attribute.
Purchase Decision Process by Farmers.
Consumers’ purchase decision process was also analysed. This was done to find out how consumers’ arrived at their purchase decision. This is because decision making process requires that all alternatives are considered in order to choose the best course of action. In cases of layers mash such a decision may require knowledge provided in the form of comparison and advertisement for instance. Table 3 below represents the outcome in percentages.
Table 3 : Farmers reactions in percentage representation
| Compare | Advert | Time | Consider | Buy any | |
| Disagree | 9 | 16 | 20 | 2 | 86 |
| Slightly disagree | 11 | 21 | 14 | 0 | 9 |
| Undecided | 14 | 23 | 21 | 4 | 0 |
| Slightly agree | 9 | 11 | 14 | 21 | 0 |
| Agree | 57 | 29 | 31 | 73 | 5 |
Source: Survey Data
Generally, the farmers who use the three layers mash brands where asked if they had compared different layers mash brands. 57% of the total agreed that they had compared different layers mash brands. 9% slightly agreed, 9% disagreed that they had compared different layers mash brands, 11% slightly disagreed, while 14% were undecided. Table 3 represents percentages of farmers’ comparison of different layers mash brands. We can deduce from the figures that a big number of farmers do explore and are variety seekers, a characteristic that encourage product trial. It is possible for new brands of layers mash to be tried. There are few farmers who do not compare the different layers mash brands.
The survey also established that 29% of farmers pay attention to adverts on the three layers mash brands, 11% agreed slightly that they pay attention to adverts, 16% do not pay attention to adverts on the layers mash brands, 21% slightly disagreed that they pay attention to adverts on the three layers mash brands, while 23% were undecided. From table 3, a large proportion of farmers are not sure whether they pay attention to adverts on layers mash. This indicates that the media used to advertise may not be accessed by farmers or adverts are not captivating enough to arouse interest among most farmers.
31% of the farmers agreed that they usually spend some time and effort deciding which brand of layers mash to buy, 14% slightly agreed. 20% disagreed that they spend some time and effort deciding which brand of layers mash to buy, while 14% slightly disagreed. 21% of respondents were undecided. The high percentage of farmers do spend time and effort on brand choice, therefore marketers should ensure their brands encompass the attributes sought for by farmers.
Respondents were asked if they considered many factors before purchasing layers mash. The survey indicated that 73% of the respondents agreed that they considered many factors before purchasing layers mash, 21% slightly agreed. 2% disagreed, while 4% were undecided. Many farmers take time before purchasing layers mash and therefore the layers mash brands must have several appeals to attract them.
Respondents were asked if they would buy layers mash brands on the market. Percentage outcome of responses, where, 5% agreed, 86% disagreed and 9% slightly disagreed. This indicates that farmers are loyal to layers mash brands they consume.
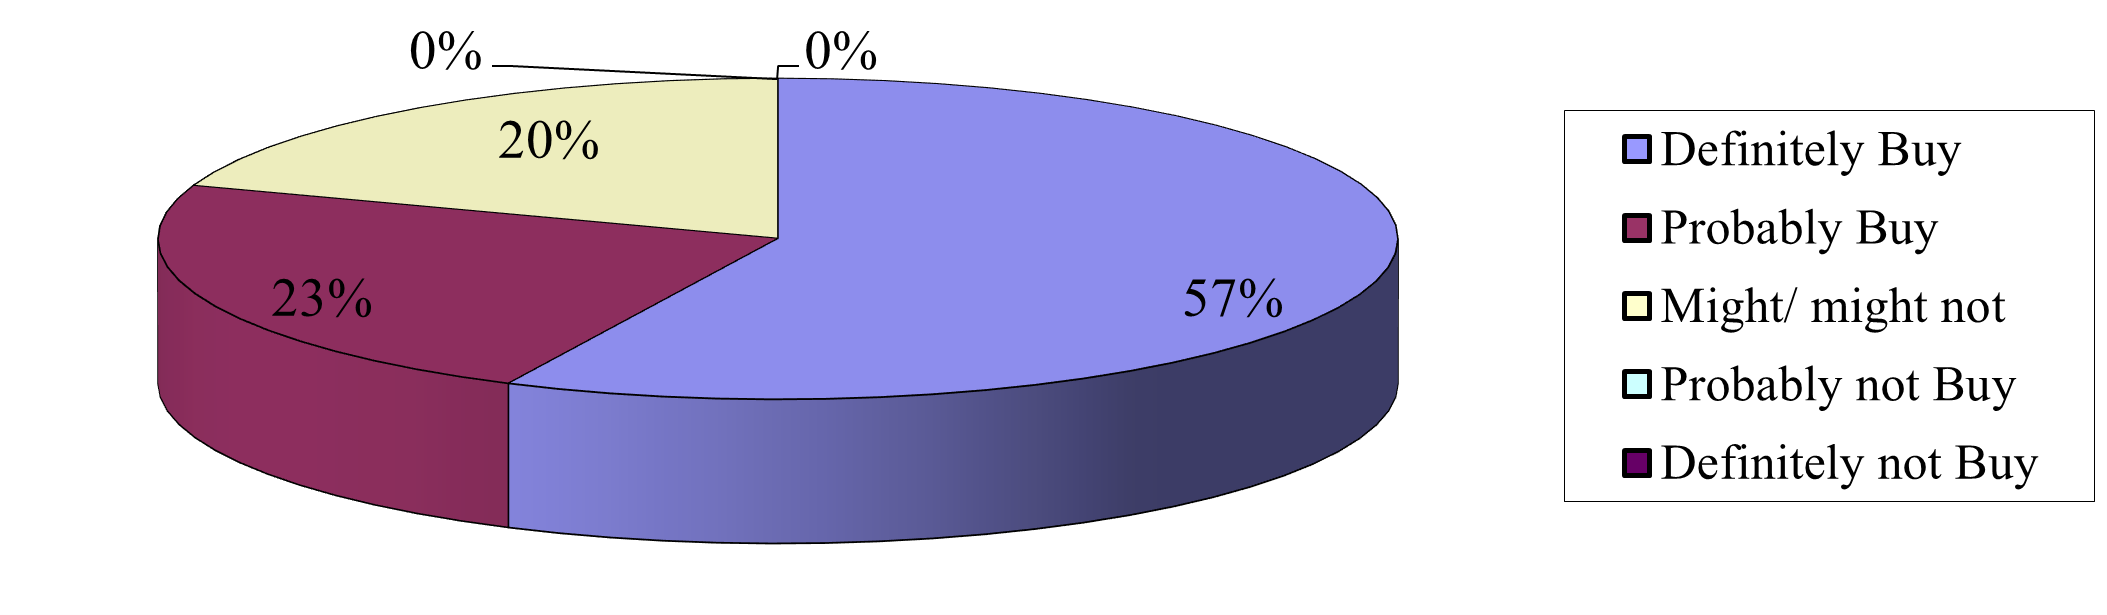
Respondents were asked if they would be interested in paying more to buy their favourite brand when other brands are available. Figure 11 gives the percentage outcomes.
Figure 11: Willingness to pay more for favourite brands
Source: Survey Data
57% said they would definitely buy, while 23% said they would probably buy. None said they would definitely not buy or probably not buy and 20% of the respondents said the might or might not buy. This shows brand Loyalty as a high percentage of farmers indicated that they would pay more for their favourite brands even if other brands are available. Farmers may also be quality conscious as highly priced products are generally associated with good quality therefore we expect quality conscious consumers to consume a product even if its price is relatively higher than others of the same kind on the market.
The Attributes Importance to Farmers.
The survey aimed at looking for attributes that farmers feel are important as appertains purchase of layers mash. Figure 12 represents the outcome on a bar graph below. The results indicated that, availability and functionality (increase in yield) of the layers mash occupied higher percentage (9% for both) in overall attribute importance. Price of the layers mash, farmers experience with the feeds and quality of the feeds followed closely with 8%. Lettering on the package, warranty issued by sellers’ on the feeds, seller’s knowledge and the need to maintain a constant yield had 7%, while Opinion leaders advise, delivery of feeds by sellers/ manufacturers, salesmen advice how to use the feeds, instruction on the package and threading of the package had 6%.
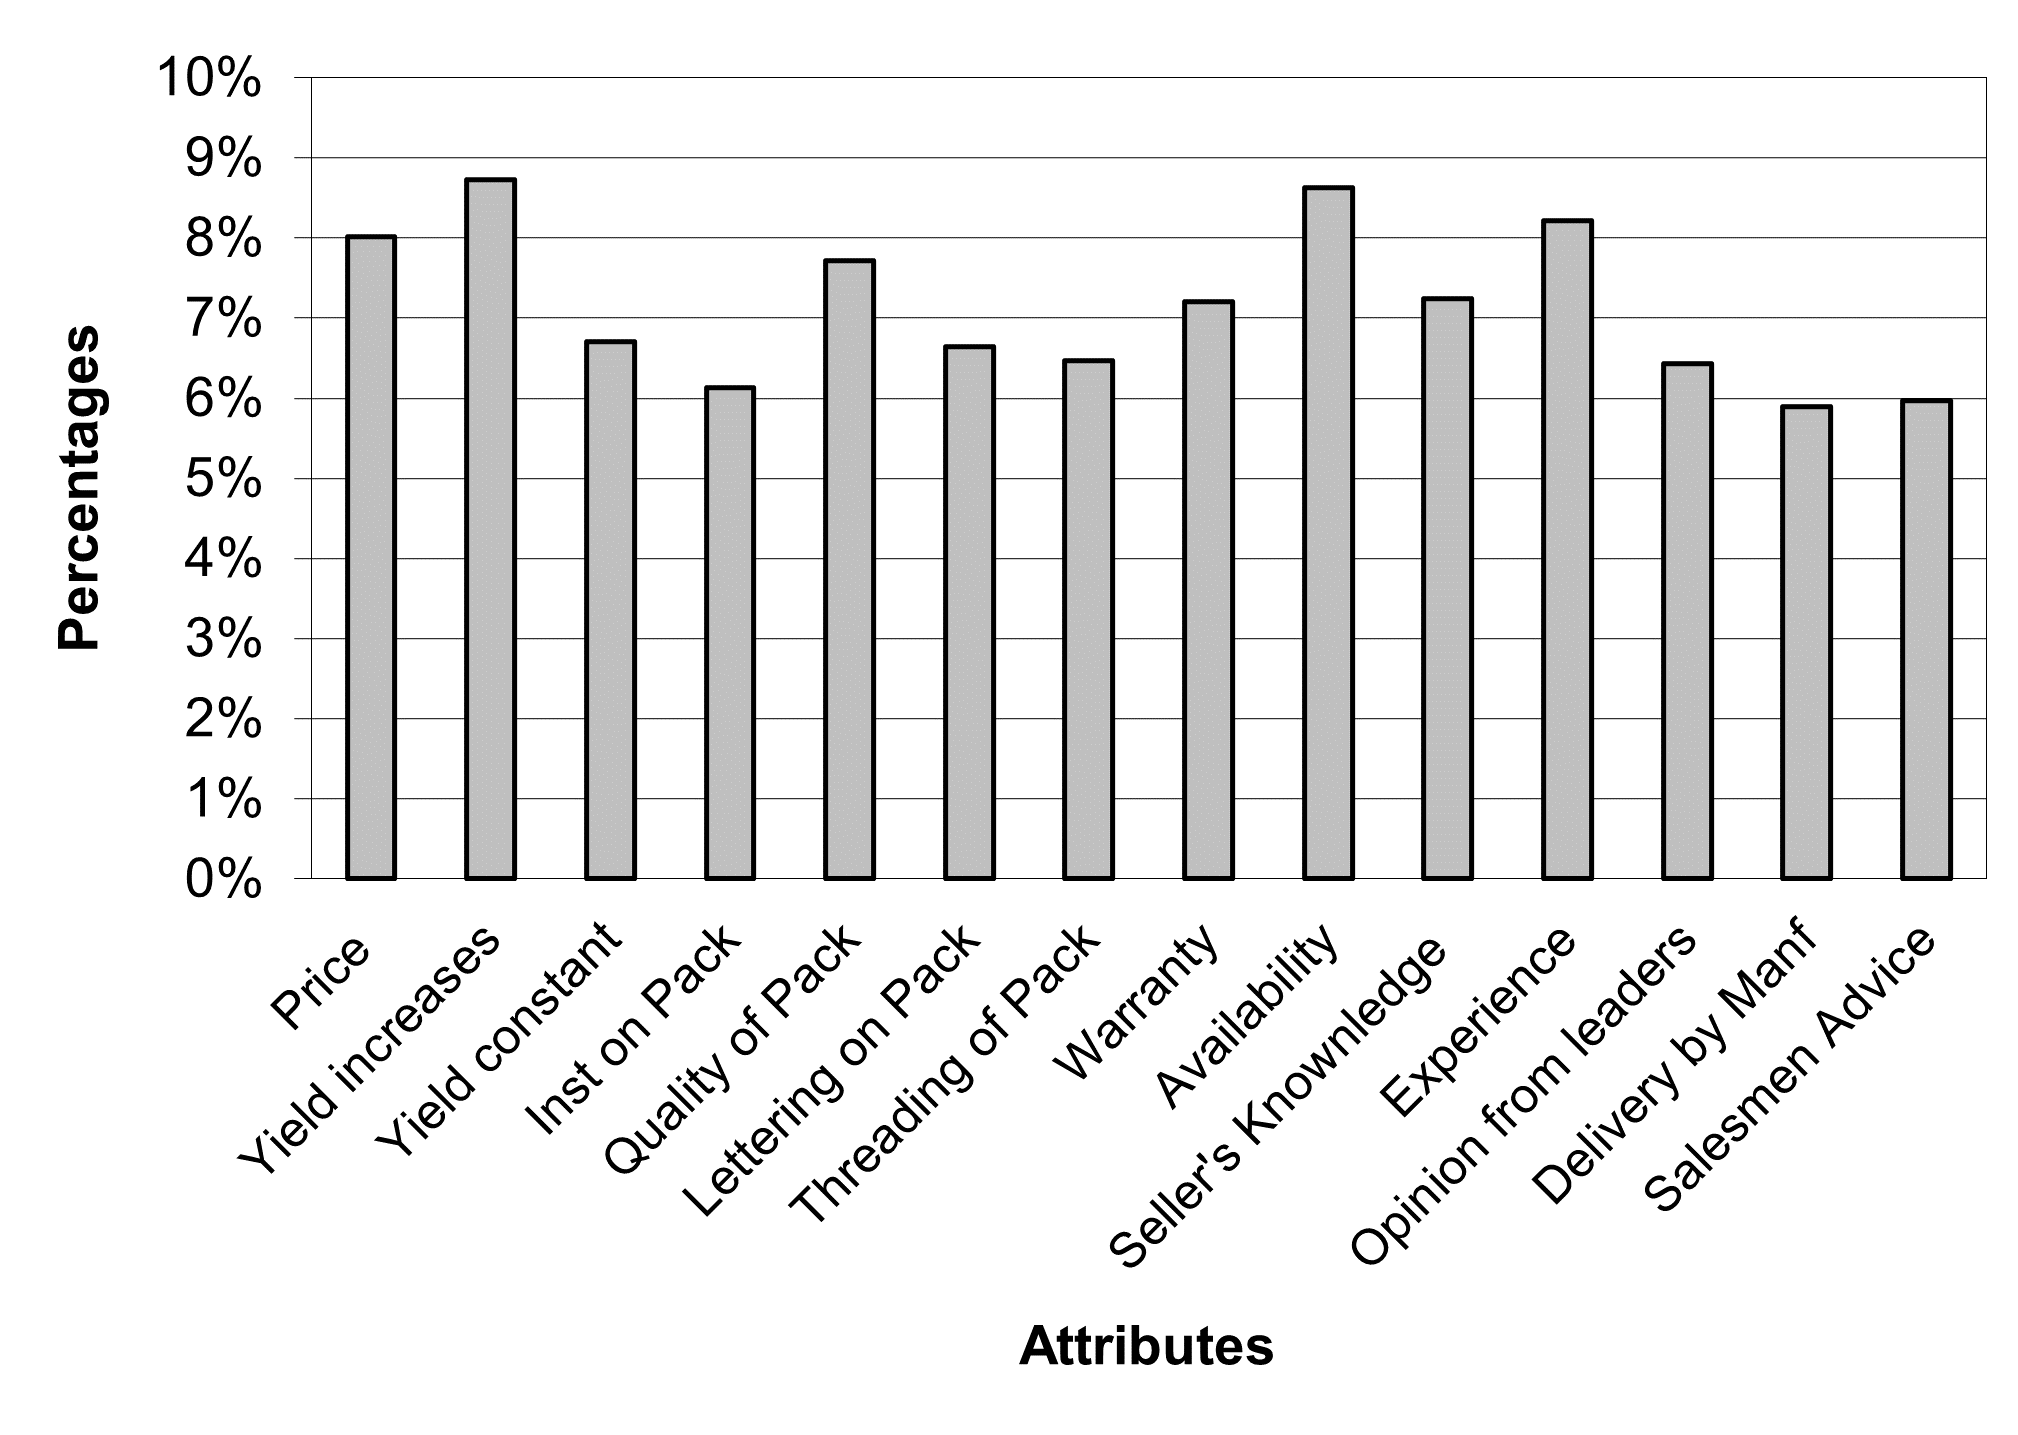
Figure 12: Attributes Associated with Choice of Layers Feeds Brands
Source: Survey Data
These results have the implications that marketers need to ensure that their feeds area always available. They should also tailor their advertising messages to imply that use of their feeds would lead to an increase in yield. These two are the most sought for attributes in the choice of the feeds.
Attributes that make a farmer choose layers mash were evaluated among the three layers mash brands. Farmers were asked to indicate how specific attributes were perceived in terms of their importance. Table 4 shows the percentage distribution of responses on the attributes sought for by farmers when choosing the layers mash. 41% of the respondents said that price was extremely important to them, 43% said it was important and 16% said it was not important at all. This implies that farmers are concerned about price of layers mash. Farmers are likely to be quality conscious since highly priced products are viewed to be of high quality.
Functionality of the feeds was viewed under two categories. It was sought to know the concern about feeds in relation to increase in yield. 62% of respondents said that it was extremely important and 38% said it was important. The figures imply that farmers will always look for feeds that will increase their yield. Therefore marketers need to emphasize this in their marketing campaigns to make them attractive to the farmers. The study also aimed at knowing farmers perception on yield consistent, 25% said it is extremely important, 18% said it is important, 32% said it was somehow important, 16% not important and 4% said it was not important at all.
Table 4 : Percentage Distribution of response on Layers Mash Attributes.
| Not Important at All | Not Important | Somehow Important | Important | Extremely Important | |
| Price | 0 | 0 | 16 | 43 | 41 |
| Increases Yield | 0 | 0 | 0 | 38 | 62 |
| Consistent Yield | 4 | 16 | 32 | 18 | 30 |
| Package instruction | 9 | 25 | 20 | 25 | 21 |
| Package Quality | 0 | 4 | 27 | 27 | 43 |
| Package Lettering | 4 | 18 | 20 | 41 | 18 |
| Package Threading | 9 | 20 | 16 | 30 | 25 |
| Warranty | 7 | 13 | 16 | 20 | 45 |
| Feed Availability | 0 | 2 | 4 | 30 | 64 |
| Sellers’ Knowledge | 2 | 9 | 23 | 36 | 30 |
| Feed Experience | 0 | 5 | 4 | 41 | 50 |
| Leaders Opinion | 11 | 16 | 24 | 21 | 27 |
| Delivery by Seller | 4 | 30 | 29 | 25 | 13 |
| Salesmen Advice | 13 | 11 | 46 | 9 | 21 |
Source: Research data
Type of package was considered under different concern. Instruction on the package was also an attribute that was evaluated to find out its importance. 21% of farmers said it was extremely important, 25% said it was important, 9% said it was not important at all, 25% said it was not important, while 20% said it was somehow important. This implies that farmers treat the instruction on packages importantly. Therefore marketers should consider having clearly indicated instructions on the packages.
Respondents were asked their feelings on quality of package. 43% of respondents said it was extremely important, 27% said it was important, 4% said it was not important, while 27% said it was somehow important. Quality packages should be used with promotion messages emphasizing this as it is bound to influence sales positively.
Lettering on the package and its association to choice of specific brands of layers mash was also evaluated. 18% of respondents said it was extremely important to them. 41% said it was important, 4% said it was not important at all, 18% said it was not important, while 20% said it was somehow important. Properly written packages should be used. Marketers should use colours and writing styles that will enhance visibility.
Threading of packages was also evaluated and 25% of respondents said it was extremely important to them. 30% said it was important, 9% said it was not important at all, 20% said it was not important, while 16% said it was somehow important. Threading should be keenly considered by having it well done to ensure safety and ease of use.
Warranty given by the seller was extremely important to 45% of respondents, important to 20% of them, to 7% it was not important at all, 13% not important. 16% said it was somehow important. Farmers need assurance that the feeds they purchase meet their expectation, marketers should therefore reassure the farmers by for example allowing them return feeds they perceive not meeting their expectations.
Availability of the layers mash was extremely important to 64% of respondents, important to 30%, not important to only 2% and somehow important to 4% of the respondents. Marketers should therefore ensure their supply and distribution channels are more flexible and effective to cartel shortages.
Seller’s knowledge on feeds was extremely important to 30% of respondents, important to 36%, not important at all to 2%, not important to 9% and somehow important to 23% of the respondents. Marketers should educate the sellers to acquaint them with the knowledge on the functionality of the feeds.
The respondents experience with the feeds was extremely important to 50% of respondents, important to 41%, not important to 5% and somehow important to 4% of the respondents. Marketers should try and ensure the farmers experience with their feeds is favourable, this will likely lead to repeat purchase.
Advice from opinion leaders was extremely important to 29% of respondents, important to 21%, not important at all to 11%, not important to 16% and somehow important to 23% of the respondents. Marketers should emphasize on demonstration by using more established farmers who are likely to influence others.
Delivery of feeds by the seller/ manufacturer was extremely important to only 13% of respondents, important to 25%, not important at all to 4%, not important to 30% and somehow important to 29% of the respondents. This facility should be carefully used as a large percentage of farmers do not consider it as an important attribute.
Salesmen advice on use of the layers mash was extremely important to 21% of respondents, important to 9%, not important at all to 13%, not important to 11% and somehow important to 46% of the respondents. Marketers should not emphasize on trying to elaborate on how feeds are to be used.
In this study, a moderately strong, positive correlation was found between brand name and general attitude (r2 = 0.47, p < 0.01). The correlation between smell of feeds and the general attitude was slightly strong (r2 = 0.43, p < 0.01). This indicated that a positive relationship between belief that layers mash had a certain attribute and attitude prevailed. The findings support the Theory of Reasoned Action because; the developers of the TRA proposed that behavioural beliefs would be positively related to general attitude. This has the implication that since the brand and smell of layers mash are the attributes that can be judged by using senses of sight and smell easily, and since they are positively correlated with attitudes farmers hold, it is easy for them to make purchase decisions based on only this attributes. The other attributes did not show strong correlations with the general attitudes farmers held. For instance, colour had a correlation of 0.27, package size r2 = 0.32 at 0.05 level of significance and texture r2 = 0.26 at 0.05 level of significance.
The first hypothesis was tested using the Kruskal-Wallis test statistic with attitude as the treatment factor. The data was tested at 2 degrees of freedom and 0.05 level of significance. The computed value (26.007) was higher than tabulated value (5.991) hence the hypothesis was rejected. This means that there is a difference between farmers’ attitudes towards different layers mash brands. From a practical standpoint, marketers should differentiate their layers mash offered on the market to influence the farmers’ attitudes favourably towards their layers mash. This result conforms to the theory on which perceived quality suffices. This is in line with the works of Levy (1981) who reported that sets of ideas, feelings and attitudes that consumers have about brands are crucial to them in picking ones that are more appropriate.
The second hypothesis was still tested using Kruskal-Wallis test statistic with perceived quality as treatment factor. The data was tested at 2 degrees of freedom and 0.05 level of significance. The computed value (2.09) was lower than tabulated value (5.991) hence the hypothesis was not rejected. This means that perceived quality attributes that influence choice among the layers mash brands are different. From a practical standpoint, marketers should look for the attributes farmers use to judge quality and ensure they are highlighted in their layers mash and in their promotion campaigns. This does conform to theory as it is expected that products have specific attributes that distinguish them from others, and it is this that form basis for the product quality. Therefore consumers perceive products to have quality that make them either to pick them or leave them on the selves.
IMPLICATIONS TO THE STUDY
Perceived quality can be exploited when the marketers know what attributed are used to judge quality and how they impact on the attitudes of consumers. A strong brand with respect to perceived quality will be able to extend further, and will find a higher success probability than a weaker brand (Aaker, 1991). Branding is a strategy employed by organization to either retain or extend their market shares by convincing potential and actual consumers that their products were different from competing ones. The market for poultry feeds is characterized by intense competition and the presence of differentiated poultry feeds and rate of differentiation is not likely to decrease in the near future. As a result, farmers are likely to become even more discerning when making purchase decisions poultry feeds. Thus, the key to survival of any feeds marketer in the long run is how well his feeds are differentiated and how strong has his brand image been built.
CONCLUSIONS
Staying in touch with ‘what customers perceive as quality is difficult – but not impossible. Marketing departments that are keeping track of changing customer perceptions of quality are likely to outpace the competition in the market place. It is consumers’ perception of quality that determine what, how much, and when they buy products and services. In many contexts, perceived quality of a brand provides a pivotal reason to buy, influencing which brands are included and excluded from consideration, and the brand that is to be selected (Aaker, 1991). It is therefore critical for marketers to understand the likes and dislikes of consumers in order to cultivate a loyal customer base. This knowledge goes a long way in determining a business’ bottom line. This is in line with (Ajzen, 1980) argument that, strategy consulting firms – have built successful careers by deciphering and uncovering the hidden perceptions and motivations of consumers. So today’s marketers must identify consumer quality perceptions of quality and attitudes, and define distinct customer segments that can be tracked over time.
Generalizing about quality across products has can be difficult for managers. Specific or concrete intrinsic attributes differ widely across products as do attributes consumers use to infer quality. The study revealed that farmers differed in their choice of important attributes that determined the choice of their layers mash. This applied even to those farmers who used the same layers feeds. This goes hand in hand with argument by Zeithmal, that, “even within a product category, specific attributes may provide different signals of quality. For example, thickness is related to high quality in tomato-based juices but not in fruit-flavoured children’s drinks”. Also, the intrinsic-extrinsic dichotomies of quality cues are useful for discussing quality but are not without conceptual difficulties. A small number of cues, most notably those involving the products package, are difficult to classify as either intrinsic or extrinsic. Package could be considered an intrinsic or extrinsic cue depending on whether the package is part of the physical composition of the product (for example a squeezable ketchup container) in which case it would be an intrinsic cue or protection and promotion for the product (for example a card-board container for a computer) in which case it would be and extrinsic cue (Zeithaml, 1988).
RECOMMENDATIONS
Knowledge in memory does affect consumer decision making. Petry and cacioppo (1986) stated that, consumers think of brands when they think of product category and this in turn affects decision making about product choice. Marketers should take this into consideration as they can use this knowledge to develop strong brand associations, which conversely improve their products’ brand image.
Since the demand for goods and services can change significantly because of change in taste and preference, this can be used to change buying behaviour. Clark (1987) asserts that advertisers spend billions of dollars to change taste and cause the demand for their products increase. This can be done with an intention to woe farmers you use other brands of layers mash. Also the price of layers mash can be stabilized to maintain the market shares. This is because consumers respond not only to the current price of goods, but also to what they believe those prices are likely to be in the future. Stability in prices eliminates the feelings among consumers that there is a likely of changes in prices in the near future which makes predictions of sales difficult. Hanson (1982) states that in the case of branded goods a fall in price is likely to increase sales only slightly, for people often prefer one brand to others. Therefore, price stability of branded goods will make an organization enjoy a comparative advantage over its competitors if this concept is well exploited.
Managers of poultry feeds should carefully seek information on what farmers view as important in the feeds they offer. This will help predict their reaction to the feeds on offer and hence estimate how it will impact on their market share. Once they understand how farmers will react to different features of their feeds, they can use this knowledge to promote the most desired features of their existing feeds. This “repositioning” of existing poultry feeds can provide a strategic advantage.
Alternately, managers may attempt, through promotion, to alter the importance farmers place on a specific attribute. For example, texture or colour of layers mash was generally perceived as a less important attribute in this survey. If management views their brand of layers mash to have this attribute so embedded in their brand, then they may be able to use market communications to change the importance of the feature in the mind of target consumers. For example, market communications might feature the benefits and necessity of certain texture, for instance coarse will help in digestion of the feeds.
REFERENCES
- Aaker, D. A. (1991). Managing Brand Equity. New York: New York Free Press.
- Aaker, D. A. (1996). Building Strong Brands. New York: New York Free Press.
- Ainomaija, H. (2004). “Product Differentiation.:Does it Provide Competitive Advantage for a Printing Paper Company?” Retrieved on October 15th, 2004 from http://lib.hut.fi/Diss/2003/isbn9512267144/index.html.
- Ajzen, I. & Fishbein, M. (1980). Understanding Attitudes and Predicting Social Behaviour. New Jersey. Englewood Cliffs Prentice-Hall Inc.
- Ajzen, I., & Fishbein, M. (1977). Attitude-behavior relations: A theoretical analysis and review of empirical research. Psychological Bulletin, 84, 888-918.
- Ajzen, I. (1985). From Intentions to Actions: A Theory of Planned Behaviour. In Kuhl, J. and Beckman, J., eds., “Action – control: From Cognition to Behaviour”, Springer, Heidelberg, pp. 11 – 39.
- Ajzen, I. & Madden. (1986). “Prediction of Goal-Directed Behaviour: Attitudes, Intentions, and Perceived Behavioural control”, Journal of Experimental Social Psychology, Vol 22.
- Alliance for a Green Revolution in Africa (AGRA) (2014), Africa Agriculture Status Report 2014: Climate Change and Smallholder Agriculture in Sub Saharan Africa, http://hdl.handle.net/10568/42343.
- Alqaisi, O., Moraes, L. E., Ndambi, O. A., & Williams, R. B. (2019). Optimal dairy feed input selection under alternative feeds availability and relative prices. Information Processing in Agriculture, 6(4), 438–453. https://doi.org/10.1016/j.inpa.2019.03.004
- Bagozzi, R. P. (1990). “Trying to Consume”. The Journal of Consumer Research Vol 17(2), pp 127-140.
- Baker, J.M., (1993), Marketing Strategy and Management, 2nd edition, The Macmillan press Ltd. Hong Kong.
- Berger I. E & Mitchell A.A. (1989). “The Effect of Advertising on Attitude Accessibility, Attitude Confidence, and Attitude – Behaviour Relationship”. Journal of Consumer Research. Vol 16, pp 269 – 279.
- Berkmen W. H., Lindquist J. D., & Sirgy M. J. (1997). Consumer Behaviour, NTC Publishing Group, USA.
- Bodur, H. O. & Brinberg, D. (2000). “Belief, Affect, and Attitude: Alternative Models of the Determinants of Attitude”. Journal of Consumer Psychology Vol 9(1), 17-29.
- Brown & Larry K. (2000). “Sexual Behaviour Change among Human Immunodeficiency Virus-Infected Adolescents with Haemophilia”. Journal of Paediatrics. Vol 106(2) pp 22.
- Clark, J. R. & Veseth M. (1987). Economics. Orlando. Harcourt Brace Jovanovich Publishers.
- Fazio, R., Powell, M. C., & Williams, C. J. (1989). “The Role of Attitude Accessibility in the Attitude-to-Behavior Process”. Journal of Consumer Research. Vol 16(3) pp280-288.
- Fishbein & Ajzen, I., M. (1975) Belief, Attitude, Intention and Behavior: An Introduction to Theory and Research, Reading Mass, Addison-Wesley.
- Fishbein, M. and Ajzen, I. (1980). Theory of Reasoned Action. Retrieved on May 10th , 2004 from http://www.fall theory/tseng/ Reasoned/theory.htm.
- Green, P. E. & Srinivasan, V. (1978). “Conjoint Analysis in Consumer Research: Issues and Outlook”. Journal of Consumer Research. Vol 5 pp 103-123.
- Hanson J. L. (1982). Economics. Plymouth. Macdonald and Evans Ltd.
- Ivan S. Adolwa, Ray Garcia & Michael Wallis-Brown | (2021). Enhancing feed optimization in Kenya’s poultry subsector: Commodity pricing dynamics and forecasting, Cogent Food & Agriculture, 7:1, 1917743, DOI: 10.1080/23311932.2021.1917743
- Jacobson, R. & Aaker, D (1987). “The Strategic Role of Product Quality”. Journal of Marketing Vol 51 pp 31 – 34.
- Johnson, M. D. (1984). “Consumer Choice Strategies for Comparing Noncomparable Alternatives”. The Journal of Consumer Research, 11(3), 741-753.
- Kalikia, P. M., (1992). The Structure and Conduct of the Animal Feeds in Kenya. The case of Situation in Kiambu District and Nairobi. Unpublished M Sc. Thesis, University of Nairobi.
- Kardes F.R., Kalyanaram G., Chandareshekaran M. & Dornoff R. J. (2001), “Brand Retrieval, Consideration Set Composition, Consumer Choice and the Pioneering Advantage”, Journal of Consumer Research, Vol 20 pp 62 – 75.
- Keller, K. L. (1998). Strategic Brand Management, Building, Measuring and Managing Brand Equity. India. N. J. Prentice Hall.
- Kenya National Bureau of Statistics (KNBS). (2019). Economic survey 2019. Retrieved January 16, 2022 from https://dc.sourceafrica.net/documents/119074- Kenya-National-Bureau-of-Statistics-Economic.html
- Kirman, A. & Wright, P. (1989), “Money talks: Perceived Advertising Expense and Expected Product Quality’s”. Journal of Consumer Research.Vol. 16 p p344 –63.
- Kotler, P. (1999), Marketing Management: Analysis, Planning, Implementation and Control. 9th Ed. New Delhi, Prentice Hall Inc.
- Kotler, P. (2000), Marketing Management, “The Millenium Edition”, Delhi, Prentice Hall.
- Lawrence A., Crosby & Sheree L. J (2001). “Branding and Your CRM Strategy”, Journal of Consumer Behaviour .pp 6 – 7.
- Leslie de Chernatony & Malcolm M. (1998). Creating Powerful Brands in Consumer, Service and Industrial Markets. Oxford. Biddles Ltd.
- Levy, S. J. (1981). “Interpreting Consumer Mythology: A Structural Approach to Consumer Behaviour”. Journal of Marketing,Vol 45 pp 49 – 61.
- Lynch, J. G. Jr., Marmorstein, H. & Weigold, M. F. (1988). “Choices from Sets Including Remembered Brands: Use of Recalled Attributes and Prior Overall Evaluations”. The Journal of Consumer Research, 15(2) pp169-184.
- Magothe, T. M., Okeno, T. O., Muhuyi, W. B., and Kahi, A. K. (2012). Indigenous chicken production in Kenya: I. Current status. Worlds Poult. Sci. J. 68, 119–132. doi: 10.1017/S0043933912000128
- Mbau P. E. (2000). An Emperical Investigation of the Creation and Application of Brand Equity in Kenya. The Case of Phamrmaceutical Sector. Unpublished MBA Project. University of Nairobi.
- Mburu R. I. (2001). The Impact of Perceived Quality on Brand Choice: The Case of Drinks (sodas), Unpublished thesis, University of Nairobi
- Moore J. R. (1976). Market Structure of the Agricultural Industries. Iowa. Iowa State University Press.
- Nasike C. (2020). Cutting the Hand that Feeds: The Plight of Smallholder Farmers in Kenya. Greenpeace Press Release 3rd August,2020. Retrieved from: https://www.greenpeace.org/africa/en/press/11773/cutting-the-hand-that-feeds-the-plight-of-smallholder-farmers-in-kenya/
- Njuguna, C. K., Kabuage, L. W., & Bett, E. K. (2017). Economic analysis of indigenous chicken production: The case of smallholder farmers in Makueni and Kakamega Counties, Kenya. International Journal of Agricultural Extension and Rural Development, 5(5), 564–570. www. internationalscholarsjournals.org
- Oberc B.P. & Arroyo Schnell, A. (2020). Approaches to sustainable agriculture. Exploring the pathways towards the future of farming. Brussels, Belgium: IUCN EURO. https://doi.org/10.2305/IUCN.CH.2020.07.en
- Osselaer, S.M. & Alba J.W., (2000), “Consumer Learning and Brand Equity”. Journal of consumer Reaserch. Vol 27 pp 1 – 16.
- Paliwoda, S. (1993). International Marketing. 2nd Ed. Oxford 0X 28D Britain. Butterworth Heinemann Ltd.
- Petty, R. E., Cacioppo J. T, & Schumann, D. (1981). “Central and Peripheral Routes to Advertising Effectiveness: The Moderating Role of Involvement”. Journal of Consumer Research, Vol 10 pp 135-146.
- Researcher’s Resource Center – White Papers Library (1995). Understanding Brand Equity. Retrieved on October 15th 2004 http://www.dssresearch.com/toolkit/conf/join.htm.
- Rishin R., Pradeep K. Chintagunta & Sudeep H. (1996). “A Framework for Investigating Habits, ‘‘The Hand of the Past’’, and Heterogeneity in Dynamic Brand Choice”, A journal of Marketing Science, Vol. 15, No. 3, pp. 280-299
- Rogers, J. L. (1989). “Consumer response to advertising mail”. Journal of Advertising Research, 29 (6), pp 18-24.
- Sartain A. Q., Alvin J. N. & Strange J. R. (1973). Psychology: Understanding Human Behaviour. New York. McGraw – Hill.
- Schiffman, L. G. & Kanur, L. L. (1997). Consumer Behaviour 19th Ed. Prentice Hall Inc. India.
- Smith, R. E, & Swinyard, W. R. (1983). “Attitude-Behavior Consistency: The Impact of Product Trial versus Advertising”. Journal of Marketing Research, Vol 20,pp 257-267.
- Surtee, R. S. (1992). “Strategic Marketing and Research Techniques: Three things I never lend —my horse, my wife, and my name”..Retrieved on October 10th, 2004 from http://www.s-m-a-rt.com/Exp_brandequity.htm.
- Wallace K. G., Koeppel K., Senko A., Stawiaz K., Thomas C. & Kosar K. (1997). “Effect of Attitudes and Subjective Norms on Intention to Provide Oral Care to Patients Receiving Antineoplastic Chemotherapy”. Journal of Cancer Nursing. 20(1) pp34-41.
- Wong Toon Quee. (1999). Marketing Research. 3rd Ed. Butter worth – Heinemann, Reed Educational and Professional Publishing Limited.
- Zeithaml, V. A., (1988), “Consumer Perception of Price, Quality and Value: A measure End Model and Synthesis of Evidence”. Journal of Marketing. Vol 52 No. 3, pp 2 – 22.