
Mapping the Website of National Geographic’s Digital Landscape: A Webometric Analysis Approach
- Muhammad Aslam Abdul Aziz
- Muhammad Fakruhayat Ab Rashid
- 1421-1432
- Jun 13, 2024
- Education
Mapping the Website of National Geographic’s Digital Landscape: A Webometric Analysis Approach
Muhammad Aslam Abdul Aziz1, Muhammad Fakruhayat Ab Rashid2
1Independent Researcher, Book Surgeon, 13800 Butterworth, Pulau Pinang, Malaysia.
2Independent Researcher, Master of Arts in Geography, Alumni Universiti Sains Malaysia, 11800 USM, Pulau Pinang, Malaysia.
DOI: https://dx.doi.org/10.47772/IJRISS.2024.805101
Received: 21 April 2024; Revised: 08 May 2024; Accepted: 13 May 2024; Published: 13 June 2024
ABSTRACT
This webometric analysis employs SimilarWeb, a competitive intelligence tool, to evaluate national geography websites. The study sought to investigate global and country rankings, traffic sources, channels, demographics, performance metrics, referring websites, and social media impact during the period from October to December 2023. SimilarWeb is utilized as a tool for assessing user engagements, website traffic, and rankings, providing a comprehensive understanding of internet usage patterns on a global scale. The problem to be addressed through this study is to understand the remaining gap in understanding of their online performance and user engagement patterns. By utilizing SimilarWeb, an openly accessible application, the analysis assesses the online presence and effectiveness of national geography websites, making a valuable contribution to the field of webometrics and assisting in the enhancement of digital marketing strategies for National Geographic websites. The findings reveal an impressive global ranking for the traffic rank of https://www.nationalgeographic.com/, with 34.45 million of visit. The primary referring website is apple.news, contributing 14.03%, and the leading referring industry is news and media, constituting 28.40% of the total. The Skim links advertising network emerged as the dominant player claiming a significant share of 39.75% of the market share. Regarding gender and age distribution, the analysis shows a higher percentage of female visitors 58.06% to the website compared to male visitors 41.94%. Meanwhile, the findings of this webometric analysis, provide policymakers with actionable insights to optimize digital marketing efforts, enhance audience engagement, and strengthen the competitive position of National Geographic websites in the digital realm.
Keywords: Webometric Analysis, Website Analysis, SimilarWeb, National Geographic, Effectiveness
INTRODUCTION
The National Geographic website, found at https://www.nationalgeographic.com/, is a reputable platform that plays an important platform in sharing valuable knowledge and information about geography, nature, and culture. The website aims to enhance the public’s knowledge of the world by providing an extensive knowledge of content. This includes articles, photographs, and videos that cover various topics like wildlife, environmental conservation, history, and exploration. The website of National Geographic is an excellent educational resource that provides valuable insights into various cultures, scientific discoveries, and environmental issues. It plays a significant role in raising global awareness and sharing knowledge (Tsai et al., 2010).
It is important to conduct a webometric analysis of the National Geographic website for several reasons. It is primarily used for the evaluation of the website’s impact and reach, providing insight into the site’s visibility, influence, and engagement with online audiences, as well as providing insight into the site’s reach and visibility. Using the results of this webometric analysis, it may be possible to estimate the effectiveness of the content on the website in reaching and engaging its target audience, and also the extent to which it contributes to the dissemination of geographic and scientific knowledge on the website (Ramanayake et al., 2017). A webometric analysis of a website can also provide valuable information on the performance of the website in comparison with similar platforms, helping to provide insight into its competitive position, and identify areas of potential improvement for the website (Osóch & Zbaraszewski, 2021).
The webometric analysis of the National Geographic website can also be used to gain a better understanding of the website’s digital presence and influence within the tourism and geographical information sectors. It is possible for researchers to gain a comprehensive understanding of the website’s impact on the virtual landscape, its influence on perceptions and knowledge about geographical spaces and tourism destinations by examining the website’s link structures, content dissemination, and online networking (Liu et al., 2008). There are also valuable insights that can be gained from this analysis in terms of the website’s contribution to the promotion of sustainable tourism, environmental conservation, and cultural heritage preservation, thereby emphasizing its societal and educational significance (Hinson et al., 2019).
A webometric analysis can have important implications. The study assessed the significance of a website in the online domain, its impact on public discourse, and its role in disseminating knowledge by evaluating the website’s digital footprint. In addition, the analysis provides valuable information about the website’s relationship with other digital entities. This can help us understand its influence on online information networks and its effect on digital geography. The goal of conducting a webometric analysis of NationalGeographic.com was to thoroughly evaluate its digital presence, impact, and connectivity within the online environment. The study utilised webometric methodologies to analyse the website’s reach, influence, and interconnectivity. This analysis provides valuable insights into the website’s role as a prominent digital platform for geographic and scientific information dissemination.
In conclusion, the National Geographic website plays an important role in disseminating geographical, environmental, and cultural knowledge to a global audience through its dissemination of geographical, environmental, and cultural knowledge. Conducting a webometric analysis of this website is essential for evaluating and provide insights into the website’s popularity, visibility, and global reach. It can determine the website’s impact on the fields of geography, tourism, and environmental conservation by helping to identify the most popular and impactful content. Additionally, the analysis reveals the website’s influence by assessing its backlinks, citations, and social media metrics, which can aid in understanding and amplifying its reach and impact.
LITERATURE REVIEW
Webometric analysis, a quantitative approach to studying the web, has become increasingly important in evaluating the online presence and influence of websites. The potential for understanding the influence and connectivity of NationalGeographic.com within the digital environment is significant when webometrics is applied. This literature review seeks to examine the current research on webometric analysis and its applicability to NationalGeographic.com.
Thelwall (2008) offers an in-depth review of webometrics that highlighting its significant growth and importance in the digital era. The study emphasises the quantitative nature of webometrics and its ability to provide insights into the visibility and impact of websites. Therefore, it is important to evaluate the digital footprint of NationalGeographic.com. Almind & Ingwersen (1997) has discuss the use of informetric methods in studying web-based phenomena, also known as webometrics. They highlight the importance of these methods and informetric significance in understanding the World Wide Web. This highlights the importance of employing webometric methodologies in order to assess the digital presence and interconnectivity website of NationalGeographic.com.
Additionally, the study by Koulas et al. (2021) provides information on misinformation and stakeholders in Europe, and incorporates webometrics analysis to identify key stakeholders, which shows that webometric analysis can be used to understand digital entities as well as the impacts they have on society. There is a clear indication of the importance of webometrics in uncovering the influence and connectivity of NationalGeographic.com within the digital landscape. This shows the potential of webometric analysis. Bershadskaya et al. (2016) present an overview of website ranking in the context of higher education accessibility, emphasizing the relevance of webometrics data to the evaluation of higher education institution development. Webometric analysis can be used to assess the accessibility and impact of digital entities, including educational platforms like NationalGeographic.com.
Furthermore, webometrics has gained significant attention due to the fact that it offers a practical and impartial approach (Bilbao et al., 2019). A valuable tool for web analysis, it extends the co-occurrence methodology to identify and analyze co-links between web pages (Song, 2015). Further, webometrics has become a useful methodology in a variety of fields, including university ranking and scientometric evaluation (Koulas et al., 2021; Chen et al., 2023). The literature review highlights the importance and relevance of conducting a webometric analysis of NationalGeographic.com. In addition to providing valuable insights into the role of webometrics as a prominent platform for geographical and scientific information dissemination, the application of webometrics provides a quantitative approach to understanding the website’s digital footprint, impact, and interconnectivity within the online environment.
METHODOLOGY
From October to December 2023, a webometric analysis of National Geographic (https://www.nationalgeographic.com/) requires a methodology that integrates digital marketing tools and traffic analysis. For webometric analysis, there are a few marketing tools that can help in conducting webometric analysis such as Google Trends, Wordstat. Yandex, Similarweb, LiveDune, and Popsters. Using these tools, it is possible to assess the traffic and activity on the website, as well as its ranking, aligning with the objective of analyzing the performance of the website. A systematic methodology was followed in conducting a webometric analysis using tools such as SimilarWeb. In recent years, webometrics has gained significant attention due to the fact that it offers a practical and impartial approach (Bilbao et al., 2019). A valuable tool for web analysis, it extends the co-occurrence methodology to identify and analyze co-links between web pages (Song, 2015). Further, webometrics has become a useful methodology in a variety of fields, including university ranking and scientometric evaluation (Koulas et al., 2021; Chen et al., 2023).
Webometric analysis plays an important role in gaining insights into the workings of the web, quantifying the significance and influence of websites, and uncovering trends in online interactions. Researchers in academic settings utilise webometrics to analyse the structure of the scholarly web, citation patterns, and the impact of academic publications. Webometrics can be utilised to analyse patterns in the distribution of online information and the interconnections between websites. SimilarWeb tools can aid in understanding the website’s performance, potential vulnerabilities, and areas for improvement.
In conclusion, Similarweb tools were used to analyse and evaluate on the performance, traffic, and structural of the website (http://www.nationalgeographic.com/) from October to December 2023. The study sorted visitors’ data to discern patterns in website traffic and engagement. Additionally, the visibility indicator was examined to gauge the prominence of National Geographic websites within the digital landscape. Furthermore, the research delved into uncovering correlations between the impact ranking of webometrics and key metrics such as page views, average visit duration times, and the percentage of bounce rate, aiming to elucidate the factors influencing website performance and user interaction.
FINDINGS
Traffic and Engagement Overview Analysis
Figure 1 shows traffic and engagement analysis. Based on analysis, a total of 34.45 million visitors from around the world visited the National Geographic website (https://www.nationalgeographic.com) between October and December 2023, with a device distribution of 43.57% on desktop and 56.43% on mobile web devices. The number of visitors to the site decreased by 7.97% when compared to the same period last month. On a global scale, the website holds the position of #7,492, while in the United States, the website holds the position of #2,351. A ranking of #303 is secured by it within the Science and Education industry. Engagement overview analysis for the National Geographic website (https://www.nationalgeographic.com) worldwide shows that the website received 11.48 million monthly visits from 8.070 million unique visitors per month during the period October to December 2023. Users visited the site on an average for a duration of one minute and 43 seconds, with an average of 2.10 pages being viewed per visit. According to the bounce rate, 67.69% of visitors left the site after viewing only one page.
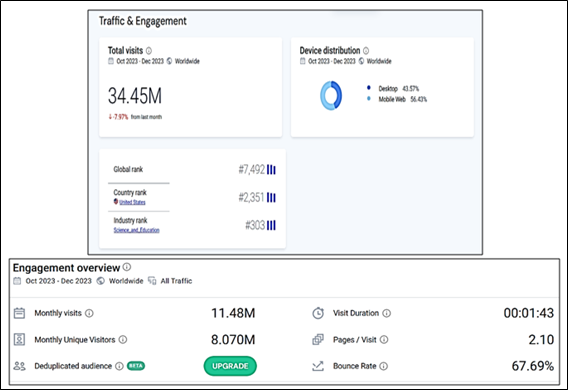
Figure 1: Traffic and Engagement Overview Analysis
Visit over Time Analysis
Figure 2 displays a visit over time analysis of global web traffic from October to December 2023. Several websites exhibited varying levels of engagement. During the same period, National Geographic’s official website (nationalgeographic.com) garnered 34.45 million visits, whereas NASA’s official website (nasa.gov) saw a higher traffic volume with 76.00 million visits. There were 21.02 million visits to World Population Review (worldpopulationreview.com), while there were 1.196 million visitors to Animal Diversity (animaldiversity.org). A total of 14.06 million visits were recorded by Zippia (zippia.com) during this period of time. These figures provide a snapshot of online engagement for these diverse websites over the specified timeframe.
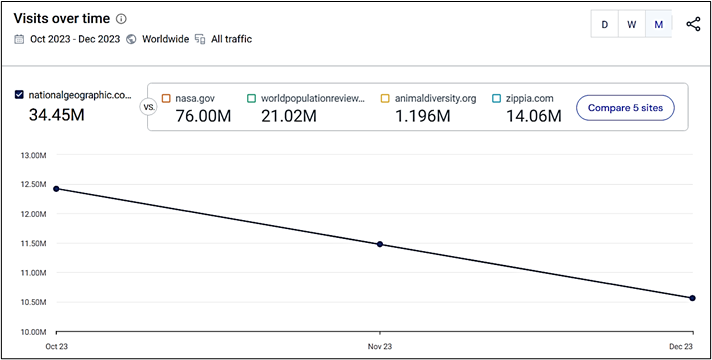
Figure 2: Visit over Time Analysis
Geography Analysis
The figure 3 shows an analysis of the geography for the period between October 2023 and December 2023. It can be seen that the top countries contributing to overall traffic on the website are as follows: the United States took the lead with 55.54 %, but experienced a decline of 4.61%; the United Kingdom accounted for 5.25%, showing a significant decline of 15.82%; Canada contributed 4.56%, exhibiting a decrease of 4.23%; India had 3.77% of the traffic, which was a substantial reduction of 27.66%; and Australia accounted for 3.27%, reflecting a 15.11% decrease. According to these figures, there have been changes in user engagement across these key countries over the specified period of time.
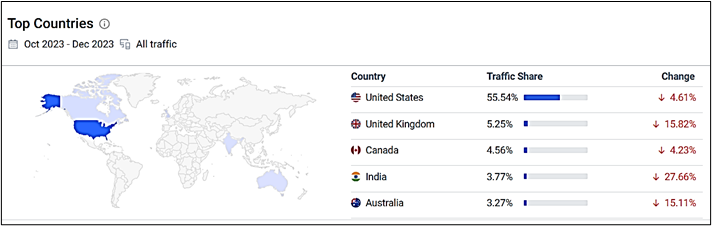
Figure 3: Geography Analysis
Marketing Channels Analysis
The figure 4 below illustrates an analysis of marketing channels from October to December 2023 for the National Geographic website (https://www.nationalgeographic.com), which shows that 34.3 million people visited the website worldwide during this period, with 15 million visits coming from desktops and 19.3 million from mobile phones. There is a significant amount of direct traffic to the site, with 5.1 million visits on desktops and 5.3 million visits on mobiles. Approximately 434.6 thousand of the email-driven visits came from desktop users, while less than 5 thousand came from mobile users. The majority of email-driven visits came from desktop users. In terms of referral traffic, it has been split between desktop (354 thousand) and mobile (388,1 thousand). There is a significant impact of social channels on the site, with 594.8 thousand visits coming from desktops and 802.5 thousand coming from mobiles. The organic search engine resulted in 8.4 million visits on desktops, while the mobile search engine resulted in 12.7 million visits. There are 99.7 thousand visits on desktop due to paid search, while there are 72.8 thousand visits on mobile due to paid search. There are 25.2 thousand visits to the display ads on desktops and 6.4 thousand visits to the display ads on mobile devices. A comprehensive analysis of the traffic patterns on the National Geographic website during the specified period of time illustrates that a variety of sources and devices are influencing traffic patterns on that site.
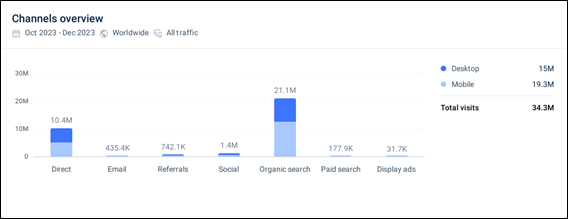
Figure 4: Marketing Channels Analysis
Organic Search Analysis
Figure 5 shows an organic search analysis for the National Geographic website (https://www.nationalgeographic.com) for the period of October – December 2023 for desktop devices worldwide, organic search represents 56.2% of the overall website traffic of the National Geographic website. Based on a review of the top organic search terms during this period, the majority are branded, with “national geographic” accounting for 3.57% (a decrease of 10.76%), and “national geographic kids” at 0.77% (a decrease of 7.01%). It is noteworthy that, among the non-branded terms that constitute 85% of the organic search results, terms like “Diwali” constitute 0.35% (a decrease of 72.26%), “cat” at 0.28% (a decrease of 12.33%), and “nat geo kids” at 0.23% (a decrease of 2.82%). Based on this data, we can gain insight into the balance between branded and non-branded searches, as well as the search behavior and preferences of users.
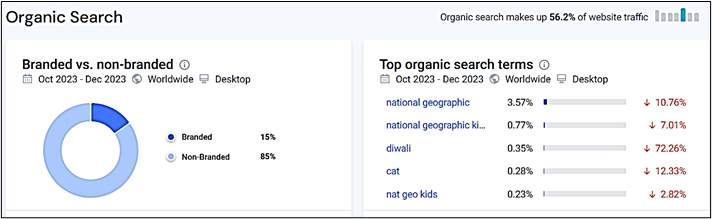
Figure 5: Organic Search Analysis
Referrals Analysis
Based on the referrals analysis shown in Figure 6, from October to December 2023, referrals accounted for 2.36% of the overall traffic on the National Geographic website (https://www.nationalgeographic.com). Based on the top referring websites on desktop devices worldwide during this period, Apple News accounted for 14.03%, a decrease of 89.32%, while visitstore.blo accounted for 12.08%, an increase of 39.69%. In contrast, recommendedreads.com saw a decline of 98.87%, while clever.com saw a rise of 136.88%, and en.wikipedia.org saw a decrease of 44.13%. According to the desktop traffic in the different industries, the desktop traffic worldwide is dominated by News and Media at 28.40%, followed by Education at 13.99%, Beauty and Cosmetics at 12.11 %, Dictionaries and Encyclopedias at 4.69%, and Books and Literature at 4.39%. The insights provided by this report provide a comprehensive view of the sources and industries influencing referral traffic to the National Geographic website during the specified period of time.
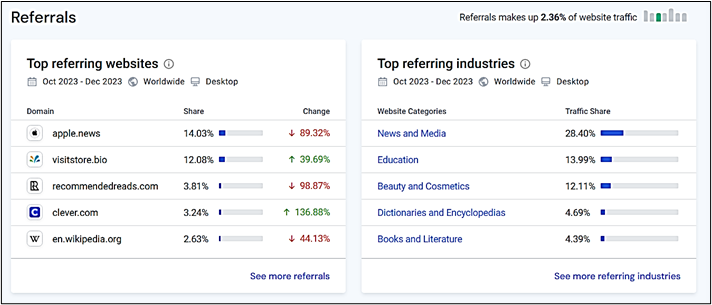
Figure 6: Organic Search Analysis
Outgoing Traffic and Advertisements Analysis
It is evident from Figure 7, the National Geographic website (https://www.nationalgeographic.com) selected by a desktop device worldwide for outgoing traffic and advertisement analysis was revealed to have notable top link destinations during the period from October to December 2023. In terms of outgoing traffic, shopdisney.com accounted for 10.20% and experienced a 4.22% increase. It was followed by w1.buysub.com at 7.04%, indicating an increase of 17.33%. In contrast, jobs.disneycareers.com constituted 6.26% but experienced a decrease of 18.30%. Disneyplus.com captured 4.42%, up 1.85%, while natgeofe.com accounted for 4.34%, down 20.63%. These insights provide insight into the varied link destinations and user preferences leading to external domains from the National Geographic website during the period of study. There were several notable destinations linked to the National Geographic website (https://www.nationalgeographic.com) on desktop devices worldwide. A significant decrease of 22.23 percent was recorded in the outgoing ads for temu.com, which accounted for 32.29% of the outgoing ads. In addition, purchase.allstate.com comprised 8.67% without a significant change, while fasteasy.io accounted for 4.27%, experiencing a significant decline of 84.15%. The other destinations were simple-life-app.com at 3.29% and adssettings.google.com at 2.90%, both without a change in frequency. The following insights provide a glimpse into significant ad destinations and fluctuations in user interactions with outbound ads from the National Geographic website during the specified period.
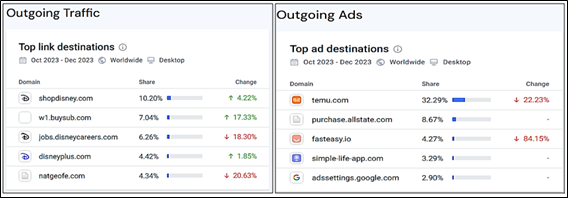
Figure 7: Outgoing Traffic and Advertisements
Display Advertising and Top Publishers’ Analysis
Figure 8 illustrates the display advertising and top publishers’ analysis for the National Geographic website (https://www.nationalgeographic.com) from October 2023 to December 2023. The Skim links Advertising Network emerged as the dominant player, claiming a significant share of 39.75% of the market share, closely followed by the Google Display Network with a share of 38.12%. There was a significant percentage of Impact at 16.77%, whereas an Unidentified Network accounted for 5.11% of the total. Additionally, blogger.com (dist) contributed with a smaller share of 0.15%, as well as the category labelled “Others”, which accounted for 0.1% of the total. It is important to note the notable influence of Skim links and the Google Display Network during the specified timeframe as well as the varied contributions of Impact, Unidentified Network, and other platforms, providing insight into the display ad network landscape for the National Geographic website during that time period. The top publishers driving desktop traffic worldwide to the National Geographic website (https://www.nationalgeographic.com) also encompass a wide range of platforms in addition to this. It has been reported that MSN.com has secured the leading position with a share of 14.31%, closely followed by spanishdict.com at 12.96%. NewYorker.com contributed significantly with a share of 10.10%, while yahoo.com and en.wikipedia.org rounded out the top publishers with shares of 8.73% and 8.54%. Based on this data, it is clear that platforms like MSN, Spanish Dict, New Yorker, Yahoo, and Wikipedia influenced users to visit the National Geographic website during the specified time period.
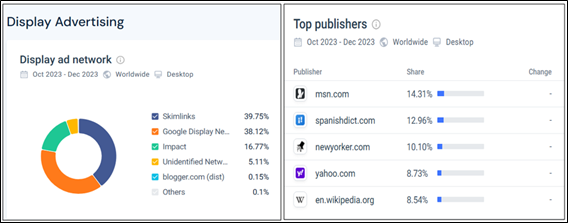
Figure 8: Display Advertising and Top Publishers’ Analysis
Display advertising and top publishers analysis
As shown in Figure 9, the gender and age distribution analysis for the specified period indicates that on the National Geographic website, 41.94% of the audience identifies as male, while a larger portion of the audience, 58.06%, identifies as female. The percentages mentioned above provide a clearer picture of the gender composition of the website’s visitors, demonstrating a higher representation of female users during the period of time specified. The age distribution data for the National Geographic website during the specified period reveals a diverse and varied user base for the website. The largest segment of visitors falls within the 25-34-year-old age range, comprising 23.15 % of the total visitors, followed by the 18-24 age group with 19.24% of the total visitors. In addition, the 35-44 age group accounted for 19.32%, 45-54 age group accounted for 15.64%, and 55-64 age group accounted for 13.62%. A total of 9.03% of the audience is over the age of 65. The breakdown reveals a wide appeal, with individuals across a variety of age groups engaging with the content on the National Geographic website during the specified period.
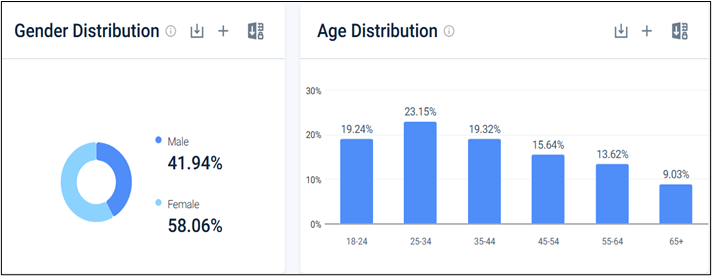
Figure 9: Gender and Age Distribution Analysis
DISCUSSION
A webometric analysis of a website involves a number of key components, such as the analysis of website content, the analysis of the web link structure, the analysis of web usage, and the analysis of web technology (Gee et al., 2022). As defined by Thelwall (2008), webometrics is a quantitative study of web phenomena based on the application of informetric methods and addressing problems related to bibliometrics as part of an analysis of web phenomena. The purpose of this paper is to provide a deeper understanding of the application of information-metric methods to the World Wide Web, often referred to as webometrics (Almind & Ingwersen, 1997), which is discussed about the National Geography website with detail analysis in this paper.
The National Geographic website provides access to high-quality information and research findings about geography, environmental science, and conservation. Researcher, educators, policymakers, and the general public seeking reliable information on geographic and environmental topics will find this a valuable resource thanks to its multidisciplinary coverage and reputable content. The website also features a spatial analysis of carbon emissions and carbon storage using national geography census data (Liu et al., 2018) and satellite-based mapping of high-resolution ground-level PM2.5 in China using VIIRS IP AOD (Chen et al., 2021). Geographic information and remote sensing technologies have been applied to a variety of environmental research and monitoring applications in these resources. It contains information on predicting natural base‐flow stream water chemistry in the western United States (Olson & Hawkins, 2012), as well as the relationship between ocean-atmospheric climate variables and regional streamflow in the Conterminous United States (Bhandari et al., 2018).
The passage presents a detailed analysis of the National Geographic website’s online performance from October to December 2023 based on the findings analysis provided previously. Despite receiving a substantial 34.45 million global visits, a 7.97% decrease is noted from the previous month. Based on the device distribution of 43.57% on desktop and 56.43% on mobile, a flexible approach is required to cater to diverse user preferences. A global ranking of #7,492 and an industry position of #303 highlight the website’s significance in the Science and Education sector, which helps to contextualize its position among its competitors.
Comparing the website with other websites such as NASA, World Population Review, Animal Diversity, and Zippia provides valuable insights into the broader online landscape. A better understanding of National Geographic’s position and opportunities for growth is made possible through this context. By examining the top contributing countries, shifts in engagement have been observed in key regions such as the United States, the United Kingdom, Canada, India, and Australia. Changes in regional traffic share provide insight into potential opportunities and challenges associated with specific geographical regions.
In addition to this, the passage also discusses the intricacies of user engagement, traffic sources, and referral dynamics. A channel overview and a detailed analysis of organic and paid search results shed light on user search behaviour and the effectiveness of different marketing strategies by providing detailed insight into the channels. In order to provide a comprehensive view of user interactions and preferences, the breakdown of referral traffic, outgoing traffic, and ad destinations is provided. In addition, the demographic data, which includes information such as gender and age distribution, provides a comprehensive picture of the varied audience engaging with the National Geographic website on a day-to-day basis. Ultimately, the article serves as a useful resource for assessing the performance of the website, optimizing user experience, and refining marketing strategies in order to improve global outreach by improving global awareness.
CONCLUSION
In conclusion, the online performance of the National Geographic website from October to December 2023 offers a multifaceted insight into its global reach, user engagement, and intricate web traffic dynamics. Although the website’s overall traffic has decreased slightly compared to the previous month in October and November, its robust global ranking, industry position, and diverse audience demographics indicate its importance to the Science and Education sector. Mobile devices account for 56.43% of device distribution data, which indicates that optimizing content and user experience for mobile users is becoming increasingly important.
Comparisons with other websites and insights into the top contributing countries provide insight into the competitive landscape and the shifting dynamics of regional engagement. Analyzing referral traffic, outgoing links, and ad destinations provides a roadmap for refining marketing strategies and enhancing collaboration with key platforms. Providing a breakdown of organic and paid searches provides actionable insights into user behavior and preferences, emphasizing the importance of a balanced approach to content optimization.
Furthermore, the comprehensive demographic data, including gender and age distribution, reveals a diverse audience engaging with National Geographic’s content. The website caters to a wide range of interests with its broad appeal, spanning different age groups and genders. Data presented in this passage provides a valuable foundation for strategic decision-making, allowing National Geographic to adapt, grow, and continue delivering impactful content to its global audience.
REFERENCES
- Ahmad, K., Ming, Z., & Rafi, M. (2018). Assessing the digital library research output: bibliometric analysis from 2002 to 2016. The Electronic Library, 36(4), 696-704. https://doi.org/10.1108/el-02-2017-0036
- Almind, T. C. and Ingwersen, P. (1997). Informetric analyses on the world wide web: methodological approaches to ‘webometrics’. Journal of Documentation, 53(4), 404-426. https://doi.org/10.1108/eum0000000007205
- Arakaki, M. and Willett, P. (2008). Webometric analysis of departments of librarianship and information science: a follow-up study. Journal of Information Science, 35(2), 143-152. https://doi.org/10.1177/0165551508094051
- Bershadskaya, M., Voznesenskaya, Y., & Olga, K. (2016). Webometrics ranking in the context of accessibility of higher education. Universal Journal of Educational Research, 4(7), 1506-1514. https://doi.org/10.13189/ujer.2016.040702
- Bhandari, S., Kalra, A., Tamaddun, K. A., & Ahmad, S. (2018). Relationship between ocean-atmospheric climate variables and regional streamflow of the conterminous united states. Hydrology, 5(2), 30. https://doi.org/10.3390/hydrology5020030
- Bilbao, E., Alvarez-Meaza, I., Belver, R., & Garechana, G. (2019). Additive manufacturing technologies for biomedical engineering applications: research trends and scientific impact. El Profesional De La Informacion, 28(2). https://doi.org/10.3145/epi.2019.mar.20
- Bondarenko, T. (2023). Assessing the efficacy of cloud services for developing educational presentations. Information Technologies and Learning Tools, 98(6), 82-93. https://doi.org/10.33407/itlt.v98i6.5407
- Chen, Y., Wang, D., Chen, Z., Yang, Z., & Wu, E. (2023). Global video object segmentation with spatial constraint module. Computational Visual Media, 9(2), 385-400. https://doi.org/10.1007/s41095-022-0282-8
- Duan, M., Liu, W., Liu, R., Wang, L., Mao, L., Qiu, Q., … & Ling, G. (2023). Intercity railway risk space anomaly detection based on train predeparture key frame extraction and iadn network. Ieee Sensors Journal, 23(3), 1693-1706. https://doi.org/10.1109/jsen.2022.3227547
- Gee, L. L. S., Dasan, J., & Hassan, C. H. C. (2022). Investigating the usability of universities’ websites: upgrading visualization preference and system performance. International Journal of Interactive Mobile Technologies (iJIM), 16(02), 129-143. https://doi.org/10.3991/ijim.v16i02.23707
- Ghosh, S. and Kumar, R. (2022). Open access digital repositories of agricultural sciences in africa: a webometric study. South African Journal of Libraries and Information Science, 88(1). https://doi.org/10.7553/88-1-1962
- Guan, P., Ma, Z., Zhang, P., Xu, S., Liu, W., Guo, Y., … & Wang, J. (2023). Study on the application of vibration isolation by using a trench in frame structures. Structural Durability & Health Monitoring, 17(1), 23-36. https://doi.org/10.32604/sdhm.2023.011383
- Hinson, R., Kosiba, J., Boateng, H., Odoom, R., & Gyampo, R. (2019). Dialogic features of brand south africa’s website and tourists’ intentions to visit. European Business Review, 31(5), 569-584. https://doi.org/10.1108/ebr-12-2016-0168
- Johnston, H. (2023). What’s in a frame, what’s in a name?. Discourse Studies, 25(2), 259-272. https://doi.org/10.1177/14614456231154732
- Khan, G., Cho, S., & Park, H. (2011). A comparison of the daegu and edinburgh musical industries: a triple helix approach. Scientometrics, 90(1), 85-99. https://doi.org/10.1007/s11192-011-0504-9
- Kibakin, M. (2020). Webometric as diagnostic tools of digital sociology: contents, purpose, usage experience. Digital Sociology, 3(1), 12-18. https://doi.org/10.26425/2658-347x-2020-1-12-18
- Koulas, E., Anthopoulos, M., Grammenou, S., Kaimakamis, C., Kousaris, K., Panavou, F., … & Peristeras, V. (2021). Misinformation and its stakeholders in europe: a web-based analysis. Lecture Notes in Networks and Systems, 575-594. https://doi.org/10.1007/978-3-030-80129-8_41
- Liu, J., Zhang, J., & Wall, G. (2008). The geographical space of china’s tourism websites. Tourism Geographies, 10(1), 66-80. https://doi.org/10.1080/14616680701825180
- Liu, Y., Hu, X., Wu, H., Zhang, A., Feng, J., & Gong, J. (2018). Spatiotemporal analysis of carbon emissions and carbon storage using national geography census data in wuhan, china. ISPRS International Journal of Geo-Information, 8(1), 7. https://doi.org/10.3390/ijgi8010007
- Olson, J. R. and Hawkins, C. P. (2012). Predicting natural base‐flow stream water chemistry in the western united states. Water Resources Research, 48(2). https://doi.org/10.1029/2011wr011088
- Osóch, B. and Zbaraszewski, W. (2021). The application of cluster analysis in the research on central european national park websites. European Research Studies Journal, XXIV(Issue 2), 765-778. https://doi.org/10.35808/ersj/2162
- Ramanayake, K., Chen, X., & Shi, B. (2017). Calculating web impact factor for university library websites in sri lanka. Journal of the University Librarians Association of Sri Lanka, 20(1), 39-57. https://doi.org/10.4038/jula.v20i1.7895
- Shari, S., Haddow, G., & Genoni, P. (2012). Bibliometric and webometric methods for assessing research collaboration. Library Review, 61(8/9), 592-607. https://doi.org/10.1108/00242531211292097
- Song, M. (2015). Identifying the topology of the k‐pop video community on youtube: a combined co‐comment analysis approach. Journal of the Association for Information Science and Technology, 66(12), 2580-2595. https://doi.org/10.1002/asi.23346
- Thelwall, M. (2008). Bibliometrics to webometrics. Journal of Information Science, 34(4), 605-621. https://doi.org/10.1177/0165551507087238
- Tsai, W., Chou, W., & Lai, C. (2010). An effective evaluation model and improvement analysis for national park websites: a case study of taiwan. Tourism Management, 31(6), 936-952. https://doi.org/10.1016/j.tourman.2010.01.016
- Yang, B. and Qin, J. (2008). Data collection system for link analysis. https://doi.org/10.1109/icdim.2008.4746781
- Yinghao, J. (2023). Finite element analysis and optimization of medium truck frame based on ansys. Journal of Engineering Research and Reports, 24(10), 13-22. https://doi.org/10.9734/jerr/2023/v24i10844
- Zhao, W. and Zeng, Y. (2023). Comparative study of static strength and fatigue strength tests and simulation analysis of an exit subway bogie frame. https://doi.org/10.1117/12.2681869