
A GIS Evaluation of the Hypsometric Analysis of Woji River Basin, Port Harcourt, Nigeria
- Ayotunde Oderinlewo
- Hyginus B. Oku
- Ettetor Uwa-Samuel
- 1399-1409
- Aug 2, 2025
- Geography
A GIS Evaluation of the Hypsometric Analysis of Woji River Basin, Port Harcourt, Nigeria
Ayotunde Oderinlewo*, Hyginus B. Oku, Ettetor Uwa-Samuel
Geography and Environmental Studies, Ignatius Ajuru University of Education, Port Harcourt, Nigeria
*Corresponding Author
DOI: https://dx.doi.org/10.47772/IJRISS.2025.907000116
Received: 14 June 2025; Accepted: 30 June 2025; Published: 02 August 2025
ABSTRACT
The management of river basins requires full understanding of the several factors and processes responsible for the evolution and development of such basins. Hypsometric analysis which is the measurement of relationship existing between land area and elevation of basins has been applied to understanding processes controlling hydrological behavior of river basins. Geographical information system provides the modern platform to obtain hypsometric data which helps to understanding different parameters that make up landforms; determine the geological and erosional stages of river basins and temporal changes that have occurred in structure of landscape. The hypsometric analysis of Woji River Basin has been carried out using the DEM of the region and ArcGIS 10.4.1 with the aim to determine the geological stages of development and assess the erosional status of the Woji River basin. The study area was classified into three sub-basins for the purpose of the study. The hypsometric curve of the entire basin and its sub-basins exhibit remarkably concave curve which indicate that the bulk of the watershed area and soil masses resides at relatively low elevation and the basin is in equilibrium or mature stage. The hypsometric integral of Woji river basin is 0.45 while its sub-basins ranged from 0.41 to 0.46, an indication that the entire basin has only 45% of its land area yet to be eroded. Although the overall hypsometric analysis of the entire basin reveals that the basin is not highly susceptible to erosion, the rapid increase in built-up area and decrease in vegetation suggest that human-induced changes are significantly impacting the basin’s environment, leading to increased soil erosion, sedimentation, and runoff. Sustainable urban planning and environmental monitoring and management practices to mitigate the adverse effects of human activities on the basin’s natural environment is highly recommended.
Keywords: Hypsometric Analysis, River Basin, Woji, Geographical Information System, Digital Elevation Model
INTRODUCTION
The management of river basins requires effective and efficient land and water resources conservation methods. A drainage basin could be said to be an area of land drained by many interconnected streams that later empty their content into the same point which could be a creek, lake, sea or ocean. According to Ahmed and Rao (2016), a drainage basin refers to the land area where all precipitation drains into a specific water body, such as a stream, river, or sea, and is regarded as a basic geomorphic unit. Among the processes responsible for the evolution and development of landscape are weathering, denudation, and erosion, tectonic and depositional processes that are acting on it. Hence, understanding the development of landform through fluvial processes, hydrological behavior of a basin, successive stages of geological time and tectonic activities of the region can be aided by analyzing the drainage basin.
Hypsometric analysis which is aimed at studying the land area in relation to its elevation has proven to be an ideal technique at evaluating the geological and erosional stages of drainage basins. Langbein (1947) was the first to carry out hypsometric analysis with the soul motive of expressing the overall slope and the forms of drainage basin. The ideal was later expanded by Strahler (1952) to include percentage hypsometric curve and hypsometric integral. According to Ritter et al., (2002), “both hypsometric curve and integral are considered important indicators of watershed condition”. The hypsometric curve is the plot of percentage area of a drainage basin against its percentage elevation. The shape of the curve in-turn helps to understand and explain temporal diversion from the original slope of the basin. Variations in the curve’s shape are more pronounced during the early stages of geomorphic development, diminishing as the watershed matures over time (Mehar et al., 2018).
Strahler (1952) identified three classes of hypsometric curves: young (convex upward); mature (S-S shaped which is concave upward at higher elevation and convex downward at lower elevation) and old or distorted (concave upward). These shapes signify the evolutionary stages of landforms which is an indication of watershed erosional status.
Hypsometric integral (HI) describes the proportion percentage of basin area left to be eroded. Its values determine the geological stages of landform development and erosional status of the basin. According to Mehar et al. (2018), the stages of a drainage basin can be categorized based on the Hypsometric Integral (HI) values as follows: a value greater than 0.6 indicates extreme susceptibility to erosion, a value between 0.3 and 0.6 suggests an equilibrium or mature stage, and a value below 0.3 indicates an old stage. The relevance of GIS in hypsometric analysis cannot be overemphasized as several authors have used it in the analysis of drainage basins. Therefore, this study aimed to determine the geological stages of development and assess the erosional status of the Woji River basin and its sub-basins.
The following hypotheses were tested in order to obtain the strength of relationship among hypsometric parameters of Woji River Sub-Basins:
- Ho: There is no significant difference in hypsometric integral values of Woji River sub-basins
- Ho: There is no significant variation in relative heights of Woji River sub-basins
- Ho: There is no significant variation in relative areas of Woji River sub-basins
Study Area
The study area in this investigation is Woji River which is one of the major navigable water ways in the Niger Delta of Nigeria flows in south-east direction for about 10.1km from its source at Eliozu where two streams from Rumuodara and Rumuodumaya converge to form a well-defined river channel and joins Amadi Creek behind Port Harcourt Zoo. The Woji river is geographically located between latitudes 4°51’39″N and 4°47’47″N of the equator and between longitudes 7°01’32″E and 7°04’11″E of the Greenwich Meridian. The study area is located in the tropical rainforest climate of the Niger Delta, Nigeria where they experience double maxima of rainfall. The annual rainfall in the region decreases from approximately 4,700 mm near the coast to around 1,700 mm in the northernmost part of the state (www.nigerdeltabudget.org) while the mean annual temperature is 260C. According to Iloeje (1972), relative humidity of the region is high at about 80% and above throughout the year and decreases slightly in the dry season.
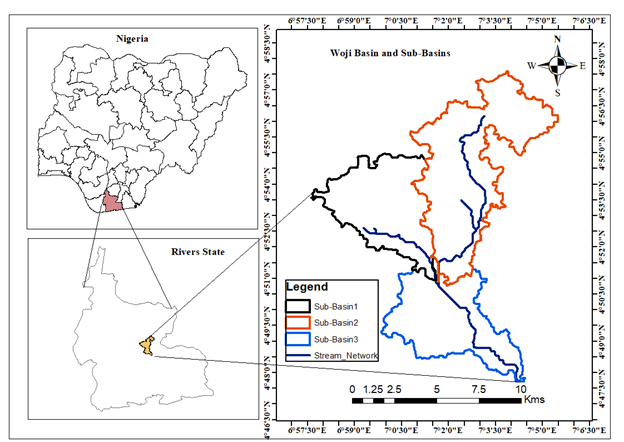
Figure 1: Location Map of Woji River Basin
MATERIALS AND METHODS
The Woji River Basin and its sub-basins catchments were delineated from mosaiced digital elevation model (DEM) of the region which was obtained from earthdata.com through several hydro spatial tools of ArcGIS 10.4.1.
The hypsometric curve of Woji River basin and its sub-basins were derived using the obtained digital elevation model (DEM) and ArcGIS 10.4.1 software. The contour line representations were created using the original DEM of 90m resolution in ArcGIS 10.4.1 at a vertical resolution of 100m for the basin relief, as described by Vivoni et al. (2008). After converting a reclassified raster with contours to a polygon feature in ArcGIS, the surface area between contours was calculated in an attribute table. The surface area within each contour class was merged in ArcGIS editor and raster calculator using the merge option. The relative elevation (the ordinate) is derived from the ratio of the height of a given contour (h) from the base plane to the maximum basin elevation (H), and the relative area (abscissa) is derived from the ratio of the area above a particular contour (a) to the total area of the basin above the outlet (A). The relative area (a/A) value ranges from one to zero. One at the drainage basin’s lowest point (h/H = 0) and zero at its highest point (h/H = 1). The hypsometric curve was created by plotting the percentage relative surface area of the basin against its corresponding relative height in Microsoft Office, 2019 Spreadsheet (Excel).
The HI also known as elevation-relief ratio was estimated using the formular proposed by Pike and Wilson (1971):
![]()
The set hypotheses were analyzed using the statistical methods of Analysis of Variance (ANOVA) and Chi Square, both one tail and two tails.
The ANOVA (F ratio) was calculated using:
![]()
Where MSb (Mean Square Between) =![]() ;
;
MSw (Mean Square Within) =![]()
Chi Square (X2)was calculated using:
![]()
Where ![]() = Observed Value
= Observed Value
![]() = Expected Value
= Expected Value
RESULTS AND DISCUSSION
The hypsometric curves and HI values of the Woji River basin and its sub-basins are discussed below:
Hypsometric Curve
In the present study, the hypsometric curves have been prepared for the Woji basin and its three sub-basins as depicted in figure 2 to figure 5. The values of relative area (a/A) and relative height (h/H) used in the plottingof the HC of the Woji watershed and its sub-watersheds are presented in Table 1.
Table 1: Hypsometric Curve Co-ordinates of Woji River Basin and its Sub-Basins
| Woji Basin | Sub-Basin1 | Sub-Basin 2 | Sub-Basin 3 | ||||
| a/A | h/H | a/A | h/H | a/A | h/H | a/A | h/H |
| 0.0002 | 1 | 0.0004 | 1 | 0.001 | 1 | 0 | 1 |
| 0.0007 | 0.896 | 0.0017 | 0.76 | 0.002 | 0.815 | 0.0004 | 0.845 |
| 0.0014 | 0.792 | 0.0060 | 0.6 | 0.005 | 0.662 | 0.0013 | 0.655 |
| 0.0031 | 0.701 | 0.0151 | 0.5 | 0.015 | 0.523 | 0.0060 | 0.500 |
| 0.0099 | 0.597 | 0.0401 | 0.42 | 0.041 | 0.415 | 0.0216 | 0.397 |
| 0.0460 | 0.506 | 0.1032 | 0.34 | 0.098 | 0.338 | 0.0712 | 0.328 |
| 0.2122 | 0.403 | 0.2145 | 0.26 | 0.194 | 0.277 | 0.1665 | 0.276 |
| 0.5545 | 0.299 | 0.4368 | 0.2 | 0.379 | 0.231 | 0.3678 | 0.241 |
| 0.9267 | 0.208 | 0.7808 | 0.14 | 0.744 | 0.185 | 0.8952 | 0.207 |
| 1 | 0.104 | 1 | 0.08 | 1 | 0.123 | 1 | 0.138 |
The shape of the hypsometric curve (HC) reveals key geomorphic processes in a watershed. The HC of the Woji basin and its sub-basins displays a notably concave shape, suggesting that most of the watershed area and soil mass is situated at relatively low elevations. It was also observed that the head and toe of the curve of Woji basin as well as its sub-basins have concave upward which according to Strahler (1952) indicates the watershed is in equilibrium or mature stage. This is similar to the work of Kumaraswamy et al. (2020).

Figure 2: Hypsometric Curve of Woji Basin
There was no observable difference or distinct characteristics in the shapes of the hypsometric curve in the sub-basins and this could be attributed to no variation in tectonic effect, lithology and rejuvenation processes (Farhan et al., 2016; Ahmed and Rao, 2016).

Figure 3: Hypsometric Curve of Woji Sub-basin 1

Figure 4: Hypsometric Curve of Woji Sub-basin 2

Figure 5: Hypsometric Curve of Woji Sub-basin 3
Hypsometric Integral
The area, minimum, maximum, range, mean elevation and hypsometric integral of Woji basin and its sub-basins has been estimated and presented in Table 2
Table 2:Area, Minimum, Maximum, and Mean and Estimated Hypsometric Integral Values of Woji Basin and its Sub-Basins
| Basin | Surface Area (Km2) | Min | Max | Range | Mean | Hypsometric Integral | Geological Stage |
| Woji Basin | 7.01E-10 | 32.67 | 39.08 | 6.42 | 35.55 | 0.45 | Equilibrium
/Mature |
| Sub-Basin 1 | 0.000193 | 27.67 | 31.83 | 4.17 | 29.39 | 0.41 | Equilibrium
/Mature |
| Sub- Basin 2 | 0.000316 | 33.08 | 38.50 | 5.42 | 35.55 | 0.46 | Equilibrium
/Mature |
| Sub- Basin 3 | 0.000193 | 21.25 | 26.08 | 4.83 | 23.42 | 0.45 | Equilibrium
/Mature |
The results of the hypsometric integral (HI) values of Woji basin and its sub-basins (Table 2) give the geological state and erosional status of the study area. The HI value of the Woji basin is computed to be 0.45, which indicates that the basin is at equilibrium or mature stage and has attained steady state condition. It also reveals that only 45 percent of the land masses remain in the basin to be eroded and the basin is not suspected to high erosion and flood as Vivoni et al. (2008) revealed that high Hi values (HI≥0.60) indicate high total runoff with subsurface processes as the major geomorphic processes. This implies, high susceptibility to erosion, incised channel erosion and mass movement. The calculated HI values of the three sub-basins of the Woji basin ranged from 0.41 to 0.46 (Table 2) which indicate that the sub-basins are in equilibrium stage and not highly suspected to erosion and flooding. There is also no significant difference between hypsometric curve and hypsometric integral values of the sub-basins of Woji basin, an indication that they are not exposed to lithology and structural differences.
Test Of Hypotheses
Hypothesis One
Table 2 was analyzed using one-sample Chi square to test the null hypothesis that there is no significant difference in hypsometric integral values of Woji River sub-basins. The result of the analysis (Table 3) revealed that the critical value (5.99) is greater than calculated value (0.0010) which implies that there is no significant difference in hypsometric integral values of sub-basins of Woji River Basin. This confirms the current geological state of the sub-basins (Table 2) reported to be in equilibrium or mature stage as proposed by Strahler (1952).
Table 3: One Sample Chi Square of Hypsometric Integral of Sub-Basins of Woji River Basin
| Probability Level | Degree of Freedom | Calculated Value | Critical Value | Conclusion |
| 95% | 2 | 0.0010 | 5.99 | Accept null hypothesis |
Hypothesis Two
Using Table 4, ANOVA was used to test the second null hypothesis, which states that there is no significant variation in relative heights of Woji River sub-basins (SB1, SB2, and SB3).
Table 4: Relative Heights and Areas of Sub-Basins of Woji Basin
| Relative Heights | Relative Areas | ||||
| SB1 | SB2 | SB3 | SB1 | SB2 | SB3 |
| 0.00043 | 0.00079 | 0 | 0.08 | 0.12308 | 0.13793 |
| 0.00173 | 0.00211 | 0.00043 | 0.14 | 0.18462 | 0.2069 |
| 0.00604 | 0.00528 | 0.00129 | 0.2 | 0.23077 | 0.24138 |
| 0.01511 | 0.01532 | 0.00604 | 0.26 | 0.27692 | 0.27586 |
| 0.04014 | 0.04093 | 0.02156 | 0.34 | 0.33846 | 0.32759 |
| 0.10315 | 0.09797 | 0.07115 | 0.42 | 0.41538 | 0.39655 |
| 0.2145 | 0.19382 | 0.16645 | 0.5 | 0.52308 | 0.5 |
| 0.43677 | 0.37893 | 0.36783 | 0.6 | 0.66154 | 0.65517 |
| 0.78075 | 0.74386 | 0.89521 | 0.76 | 0.81538 | 0.84483 |
| 1 | 1 | 1 | 1 | 1 | 1 |
Source: Geographical Information System Analysis; April, 2022.
The result shown in Table (5) revealed that the Table value (3.35) is greater than the calculated value (0.0027), implying that the null hypothesis is accepted. As a result, there is no significant variation in the relative heights of Woji River sub-basins. This supports Oyegun and Adeyemo’s (1999) submission that the Woji River drainage basin is a component of the geologic formation of the Niger Delta’s low-lying coastal plains. It also justifies the hypsometric curve of the basin and its sub-basins, where no discernible difference in shape and height was observed in the study area.
Table 5: ANOVA of Relative Heights of Woji River Sub-Basins
| Source of Variation | SS | df | MS | F | P-value | F crit | Decision |
| Between Groups | 0.000721 | 2 | 0.00036 | 0.002669 | 0.997335 | 3.35 | Accepted |
| Within Groups | 3.64496 | 27 | 0.134999 | ||||
| Total | 3.645681 | 29 |
Hypothesis Three
Analysis of Variance (ANOVA) was used to analyze the relief areas data (Table 4) obtained from hypsometric curve evaluation for Woji River Basin sub-basins at a 5% level of significance in order to evaluate hypothesis three, which states that there is no significant variation in relative areas of Woji River sub-basins. The null hypothesis was accepted as a result of the analysis (Table 6). This is due to the fact that the calculated chi square value (0.030676) is lesser than the critical chi square value (3.35) at the 5% level of significance with degrees of freedom 2 and 27.
Table 6: ANOVA of Relative Areas of Woji River Sub-Basins
| Source of Variation | SS | df | MS | F | P-value | F crit | Decision |
| Between Groups | 0.005156 | 2 | 0.002578 | 0.030676 | 0.9698 | 3.35 | Accepted |
| Within Groups | 2.26919 | 27 | 0.084044 | ||||
| Total | 2.274347 | 29 |
To provide valuable insights into the dynamics of human-induced changes and natural erosion patterns in the basin, slope analysis as well as land use land cover analysis of the Woji basin were carried out.
Slope Analysis
Slope is one of the most important parameters for understanding the physiography of a region and is defined as an angular inclination of a plane expressed in degrees or percent (Latief et al., 2015). According to Jones (1998), slope is the rate of change of elevation in both X and Y directions used to identify the direction and magnitude of steepest gradient.
Table 7: Classified Slope of Woji Basin
| Slope Value | Land Area | % Land Area | Slope Class |
| 0 -639,000 | 101.92 | 93.431 | Very Low |
| 640,000 – 1,200,000 | 6.865 | 6.294 | Low |
| 1,210,000 – 2,000,000 | 0.243 | 0.223 | Moderate |
| 2,010,000 – 3,590,000 | 0.043 | 0.039 | High |
| 3,600,000 – 10,200,000 | 0.014 | 0.013 | Very High |
Source: Researcher’s Study, 2022
The slope of the Woji basin was classified into five classes as shown in Figure 6, while Table 7 shows the land area covered and the percentage of each class. Table 7 reveals that 99.7% of the basin area falls between low and very low which further clarifies the low relief nature of the basin. The assertion of Rai et al., (2018) that higher slope results in rapid runoff and increased erosion rate (potential soil loss) with less ground water recharge potential indicates that erosion and flooding activities in the Woji basin is minimal.

Figure 6: Slope of Woji Basin
Land Use and Land Cover Analysis of Woji Basin
Landsat 8 images of the area under study for the year 2015 and 2022 were incorporated into the ArcMap 10.4.1 environment to evaluate the land use and land cover of the Woji basin. The unsupervised image classification method was adopted to classify the images into four (4) categories: water body, vegetation cover, grassland, and built-up areas (Figure 7). Table 8 depicts the change in the categories (in area and percentage) in 2015 and 2022.
Table 8: Land Use Land Cover Changes of Woji Watershed from Landsat 8 Images
| Land Use | 2015 | 2022 | LULC Change Analysis (2015 – 2022) | ||||
| Area (km2) | % | Area (km2) | % | Change km2 | Change % | ||
| Grasses | 4.56 | 4.41 | 5.50 | 5.32 | 0.94 | 0.91 | |
| Water Body | 0.62 | 0.60 | 0.91 | 0.88 | 0.29 | 0.28 | |
| Built-Up Area | 64.25 | 62.20 | 79.73 | 77.19 | 15.48 | 14.99 | |
| Vegetation | 33.87 | 32.79 | 17.15 | 16.60 | -16.72 | -16.19 | |
| Total | 103.3 | 100 | 103.3 | 100 | |||
Source: Researcher’s Study, 2022
The table above reveals significant changes in the basin between 2015 and 2022. The built-up area increased from 62.20% to 77.19%, bringing about 14.99% change in the seven-year period. This has made significant impact on the natural land by increasing the impervious surface. Impervious surface tends to affect the infiltration capacity of the land and increases the flow transmission in the streams. Thus, direct human impact in the area will modify the character and behaviour of the streams. It may either expand or suppress the capacity of the river to adjust (Gabale and Pawar, 2015).
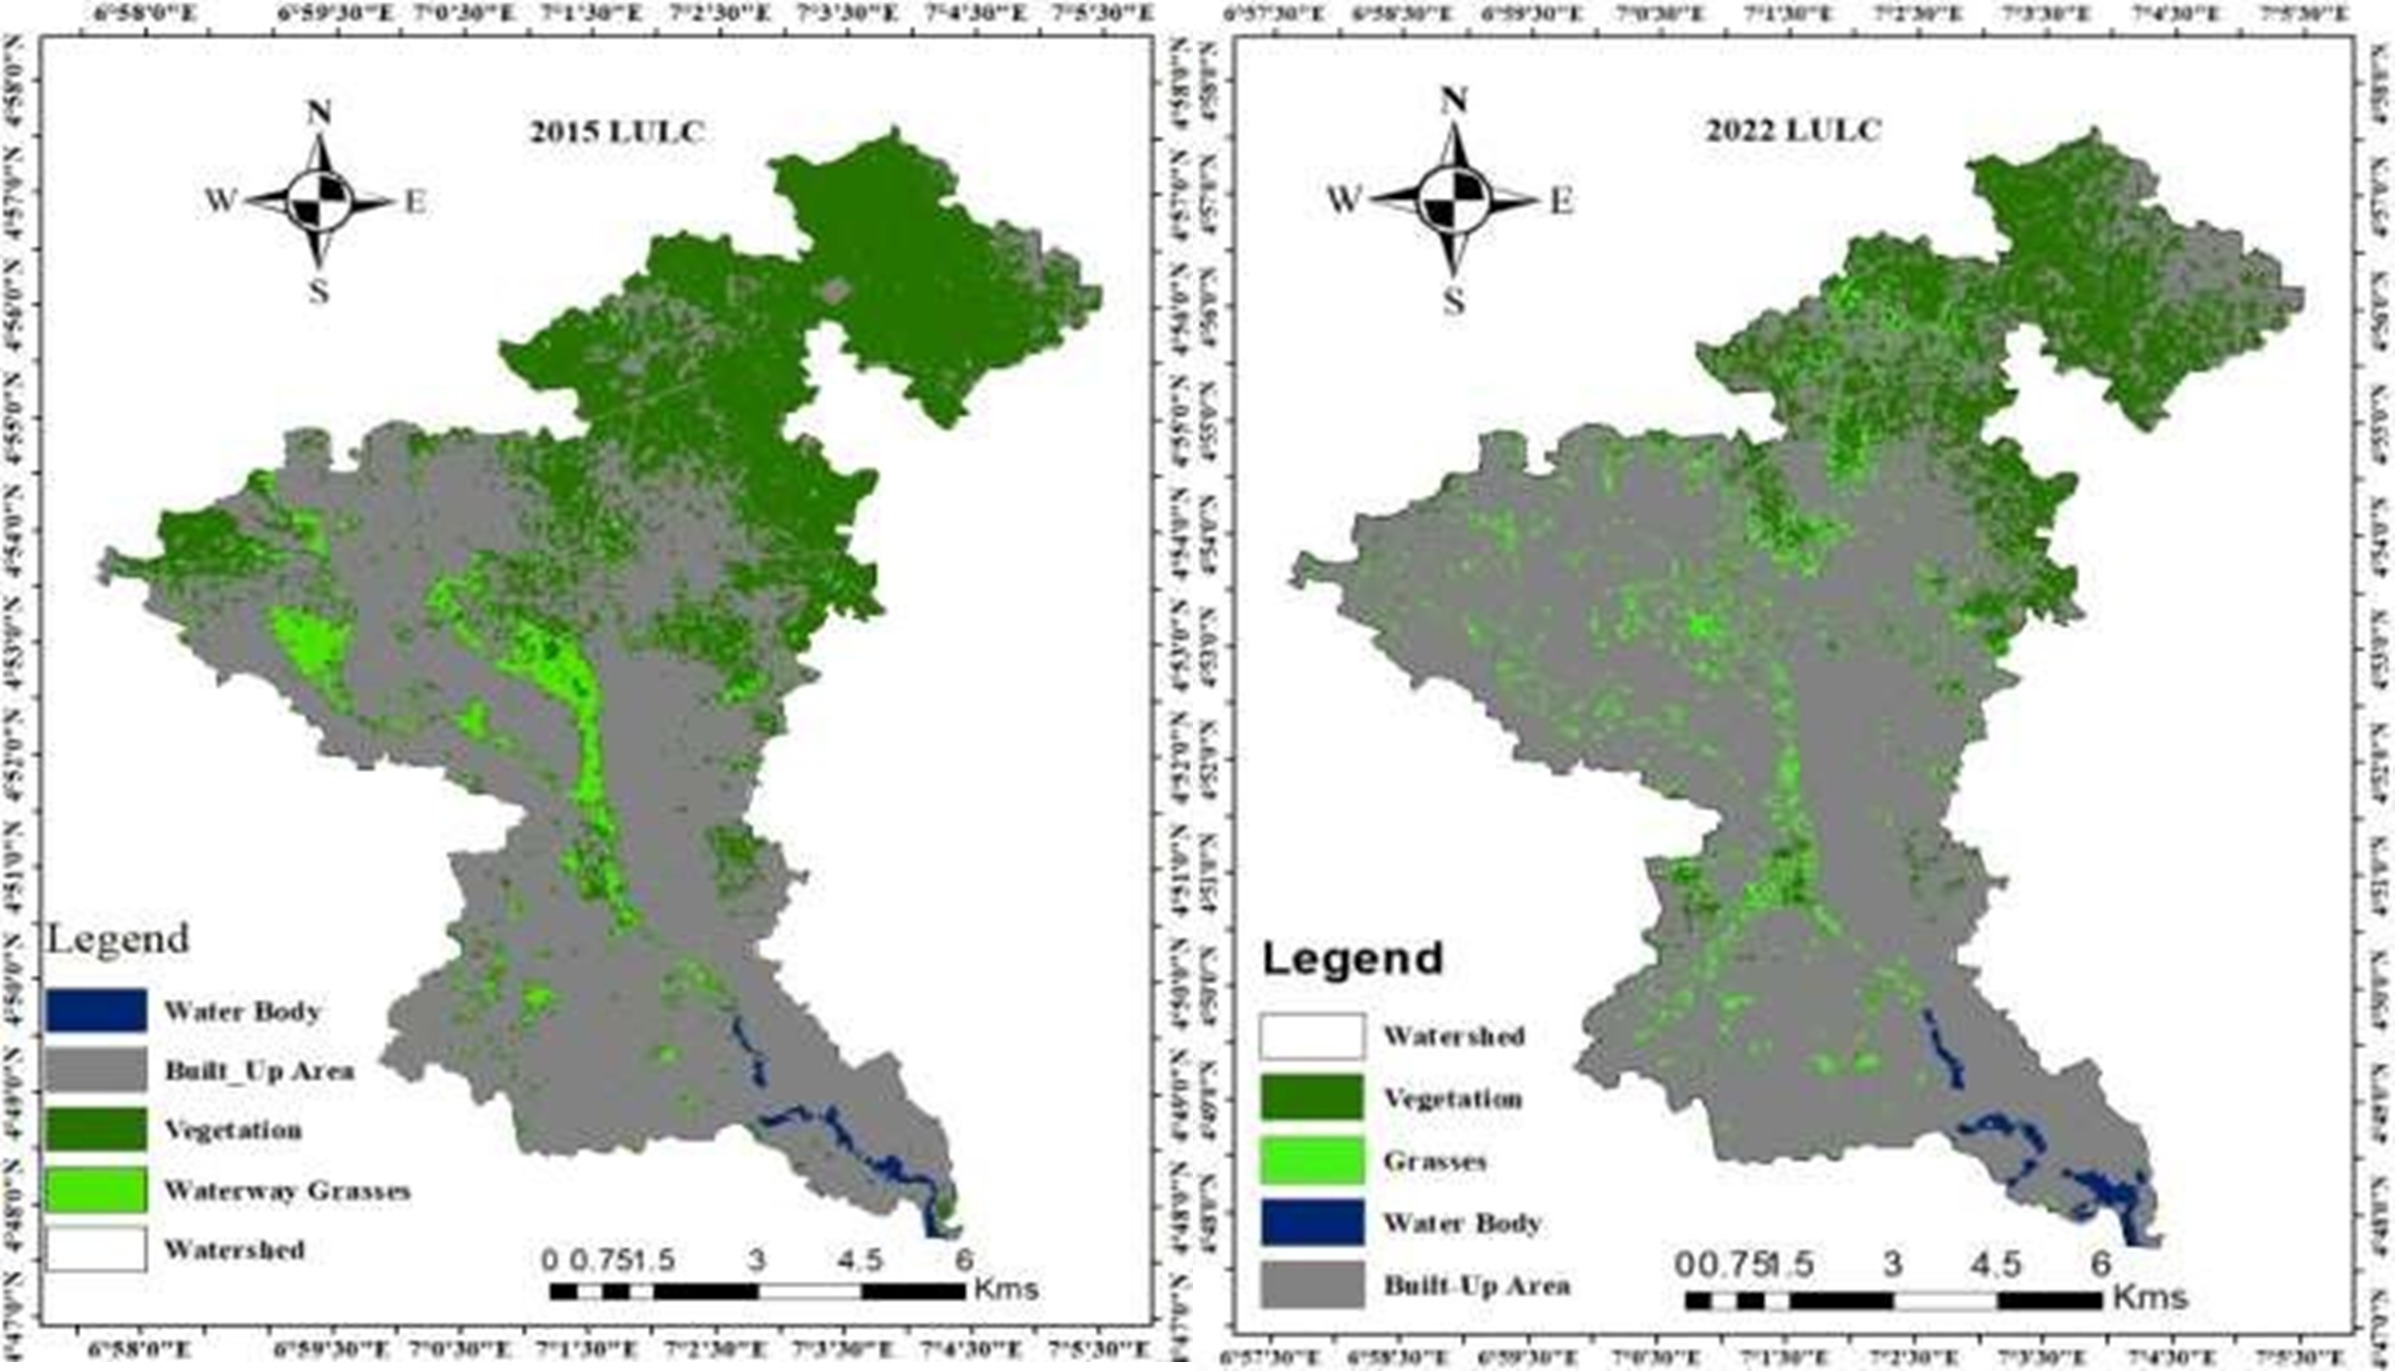
Figure 7: Land Use and Land Cover Change of Woji River Basin for 2015 and 2022
Conversely, vegetation cover decreased by 16.19%, suggesting that urbanization and other human activities have led to the loss of natural vegetation. Studies have shown that drainage density is influenced by vegetation cover and land use. According to Fryirs and Brierley (2013), sparse vegetation cover leaves the landscape exposed to intense rainfall that induces high rate of erosion and landscape dissection increasing drainage density.
Water bodies exhibited minimal change which weren’t significant visually. There is 0.28% increment in the water body of the Woji River Basin from 0.60% to 0.88%. The slight increment could be attributed to serious anthropogenic activities of dredging going on in the basin which has resulted in the increase in the surface area of the river channel (from 0.62km2 to 0.91km2) and consequent increase in the volume of water which could as well encourage erosion within the basin.
CONCLUSION
To fully understand the erosional status and stage of development of the landscape, hypsometric analysis has been conducted for Woji River basin and its sub-basins and GIS technique is indeed a convenient tool for such evaluation. The analysis revealed that the entire Woji basin is in equilibrium or mature stage and about 45% of the landmass of the basin is yet to be eroded. Although the hypsometric integral value suggests a mature stage of geomorphic development, the gentle slope as well as the human-induced changes (increased built-up area and decreased vegetation) may be altering the basin’s morphology, potentially leading to changes in the hypsometric curve over time, increased sedimentation, and runoff issues. Sustainable urban planning and environmental monitoring and management practices to mitigate the adverse effects of human activities on the basin’s natural environment is highly recommended.
REFERENCES
- Ahmed, F. & Rao, K.S. (2016). Hypsometric analysis of the Tuirini drainage basin: A Geographic Information System approach. International Journal of Geomatics and Geosciences. 6. 1685-1695.
- Farhan, Y., Elgaziri, A., Elmaji, I. & Ali, I. (2016). Hypsometric Analysis of Wadi Mujib-Wala Wa tershed (Southern Jordan) Using Remote Sensing and GIS Techniques. International Journal of Geosciences, 7, 158-176. http://dx.doi.org/10.4236/ijg.2016.72013
- Fryirs, K. A. & Brierley, G. J. (2013). Geomorphic Analysis of River Systems: An approach to reading the landscape. Wiley Blackwell Publication, pp. 29-62
- Gabale, S.M. & Pawar, N.R. (2015). Quantitative Morphometric Analysis of AmbilOdha (Rivulet) In Pune, Maharashtra, India. IOSR Journal of Environmental Science, Toxicology and Food Technology, Volume 9, Issue 7 Ver. I (July. 2015), PP 41-48
- Iloeje, N.P. (1972). A New geography of West Africa. Longman Group Ltd; Nigeria.
- Jones, K.H. (1998). Comparison of Algorithms used to compute Hillslope as a property of the DEM. Computers & Geosciences. 1998: 24: 315-323p.
- Kumaraswamy, R. K., Poornima, R. K., & Ravikumar, A. S. (2020). Quantitative Analysis of Morphometric and Hypsometric using RS and GIS Techniques. International Journal of Engineering Research & Technology, ISSN: 2278-0181. NCACE-EWIT- 2020 Conference Proceedings.
- Langbein, (1947). Topographic Characteristics of Drainage Basins, U.S.G.S. Water Supply Paper, 968C: pp.127-157
- Latief, S.U., Naqvi, H.R., Alam, A. & Arshad, A. (2015). Morphometric Analysis of East Liddar Watershed, Northwestern Himalayas. SSARSC International Journal of Geo Science and Geo Informatics, Volume 2 Issue 1, April 2015, ISSN 2348-6198
- Mehar, R., Verma, M.K. & Tripathi, R.K. (2018). Hypsometric Analysis of Sheonath River Basin, Chhatisgarh, India: A Remote Sensing and GIS Approach, International Journal of Engineering Research & Technology (IJERT).
- Oyegun C.U. & Adeyemo, A. (1999). Port Harcourt Region. Port Harcourt. Paragraphics.
- Pike, R.J. & Wilson, S.E. (1971). Elevation- relief ratio hypsometric integral and geomorphic area-altitude analysis. Geological Society of America Bulletin, 82, pp 1079–1084.
- Rai, P. K., Chandel, R. C., Mishra, V. N. & Singh, P. (2018). Hydrological Inferences through Morphometric Analysis of Lower Kosi River Basin of India for Water Resource Management based on Remote Sensing Data, Applied Water Science, (8)15,1-16. https://doi.org/10.1007/s13201-018-0660-7
- Ritter, D.F, Kochel, R.C. & Miller, J.R. (2002). Process Geomorphology. McGraw Hill
- Strahler, A. N. (1952). Hypsometric (area-altitude) analysis of erosional topography. Geological Society of America Bulletin, 63(11): 1117-1142.
- Vivoni, E.R., Benedetto, F.D., Grimaldi, S. & Eltahir, E.A.B. (2008). Hypsometric control on surface and subsurface run-of. Water Resour Res, 44:W12502. https://doi.org/10.1029/2008WR006931